ECMT1020_Lecture_Week_2-1
Continuous Random Variables
It has 2 main characteristics:
set of its possible values is uncountable e.g. 2.345
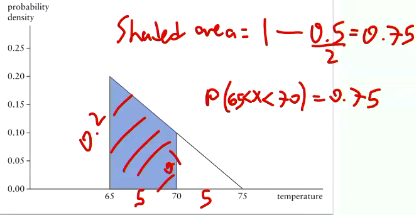
compute probability of a given interval by integrating a function called probability density function.
Probability of a single value of a continuous random variable is 0.
A probability density function (PDF) of a continuous random variable is a function that describes the likelihood of the variable taking on a particular value. The PDF must satisfy two conditions:
The function is non-negative:

The total area under the curve of the PDF over its entire range is equal to 1:
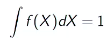
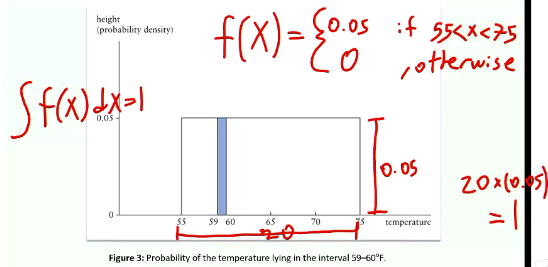
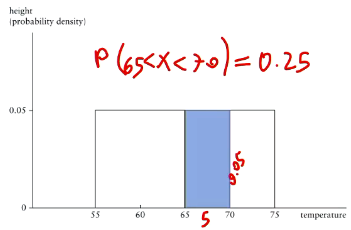
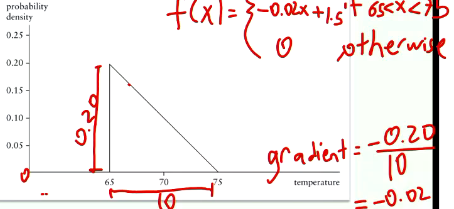
The probability that the variable falls within a certain interval can be found by integrating the PDF over that interval.
How to find probability using probability density function?
Expected value and variance of a continuous random variable
E(X) = ∫ x * f(x) dx, where f(x) is the probability density function.
the summation by integration of x with probability density function.
E[g(X)] = ∫ g(x) * f(x) dx, where f(x) is the probability density function of X and g(X) is a function.
Variance (σ²) = ∫ (x - μ)² * f(x) dx, where μ = E[X] and f(x) is the probability density function.
you can calculate standard deviation using the square root of variance.
Covariance
Covariance is a statistical measure that indicates the extent to which two random variables change together. It helps to determine the relationship between the variables: whether they tend to increase or decrease together.
Formula:
The covariance between two variables (X) and (Y) is calculated as:

Where:
(n) = number of data points
(X_i) and (Y_i) = individual sample points
(\bar{X}) and (\bar{Y}) = means of (X) and (Y) respectively.
Independence of random variables
Independence of Random Variables: Two random variables (X) and (Y) are independent if the occurrence of one does not affect the probability distribution of the other. Mathematically, this is expressed as:
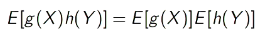
In particular, if X and Y are independent, E(XY) = E(X)E(Y)
Population Covariance: When two random variables are independent, their population covariance is zero: cov(X,Y) = 0
because they don’t show any relationship (similar but not the same to correlation)
Cov(X, Y) = E[(X - μX)(Y - μY)] = E[XY] - μXμY
Covariance rules
Here’s a concise table of covariance rules:
Rule | Formula |
Cov(X, X) | Var(X) |
Cov(X, Y) | Cov(Y, X) |
Cov(aX, Y) | a * Cov(X, Y) |
Cov(X, aY + b) | a * Cov(X, Y) |
Cov(aX + bY, Z) | a * Cov(X, Z) + b * Cov(Y, Z) |
Cov(X + Y, Z) | Cov(X, Z) + Cov(Y, Z) |
cov(X, b) | 0, any constant is zero |
Where:
X, Y, Z are random variables
a, b are constants
Variance rules
Here’s a concise table for variance rules:
Rule | Formula |
Variance of a Constant | Var(b) = 0 |
Variance of a Sum | Var(X + Y) = Var(X) + Var(Y) + 2Cov(X,Y) |
Variance of a Difference | Var(X - Y) = Var(X) + Var(Y) - 2Cov(X,Y) |
Variance of a Scaled Variable | Var(aX) = a² * Var(X) |
Variance of Independent Variables | Var(X + Y) = Var(X) + Var(Y) |
Correlation
Correlation is a statistical measure that describes the strength and direction of a relationship between two variables. It ranges from -1 to +1, where -1 indicates a perfect negative correlation, +1 indicates a perfect positive correlation, and 0 indicates no correlation.
Formula for Pearson correlation coefficient (r):
Where:
( n ) = number of pairs of scores
( x ) and ( y ) = variables being compared
What is the differences between covariance and correlation?
Covariance:
Measures the degree to which two variables change together.
Can take any value from negative to positive infinity.
Indicates the direction of the relationship (positive or negative).
Formula: ( \text{Cov}(X, Y) = \frac{\sum (X_i - \bar{X})(Y_i - \bar{Y})}{n-1} )
Correlation:
Standardized measure of the relationship between two variables.
Ranges from -1 to 1.
Indicates both the strength and direction of the relationship.
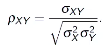
Formula: ( r = \frac{\text{Cov}(X, Y)}{\sigma_X \sigma_Y} )
Key Difference: Correlation is a normalized version of covariance, making it easier to interpret.