D4- Extinction and life history variation
Life‐history correlates of extinction risk and recovery potential, Jeffrey Hutchings, 2012
Introduction:
Historically unprecedented reductions in abundance have accelerated efforts to identify correlates of extinction risk
Proxies of extinction risk and population viability have been proposed to evaluate species status when abundance or distributional data are sparse
Life-history correlates of increased extinction risk include large body size, long life span, and delayed age at maturity
The hypothesis that high fecundity confers low extinction risk and high recovery potential is empirically suspect, it was believed that marine organisms have low extinction risk due to this
Limitations of extinction risk correlates:
based on IUCN status
is categorical rather than continuous
Aims→
to estimate and then compare rmax (maximum per-capita population growth rate→ used as a continuous, quantitative metric to depict extinction risk) for three classes of vertebrates (Chondrichthyes, Actinopterygii, and Mammalia; n ¼ 199 species) to evaluate the degree to which extinction risk differs between fishes and mammals ceteris paribus
to quantify potential correlations between rmax and each of three life-history traits for which data on at least one trait tend to be readily available: fecundity, maximum body size, and age at maturity
to test the null hypothesis that correlations between each of these traits and rmax do not differ among the three vertebrate classes examined here.
Materials and Methods:
Estimates of (r_{max}) for teleost fish were derived from the Euler-Lotka equation
For chondrichthyans and mammals, (r_{max}) was also estimated from the Euler-Lotka equation, using data on age at maturity, fecundity, and natural mortality obtained from the literature
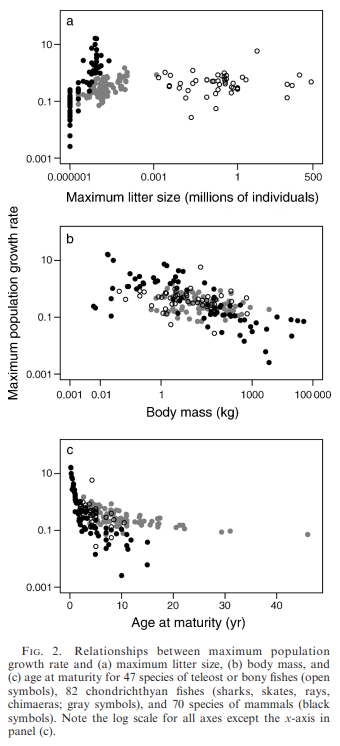
Data on life-history traits for teleost fishes were collated for 47 species
Data on chondrichthyans were collated for 82 species
Data on mammals were obtained for 70 species
Log-transformed (r_{max}) was modelled with three linear mixed-effect models (LMEs), where fecundity, body mass, or age at maturity was considered as a fixed covariate together with taxonomic class (factor) and its interaction with the life-history covariate
Results:
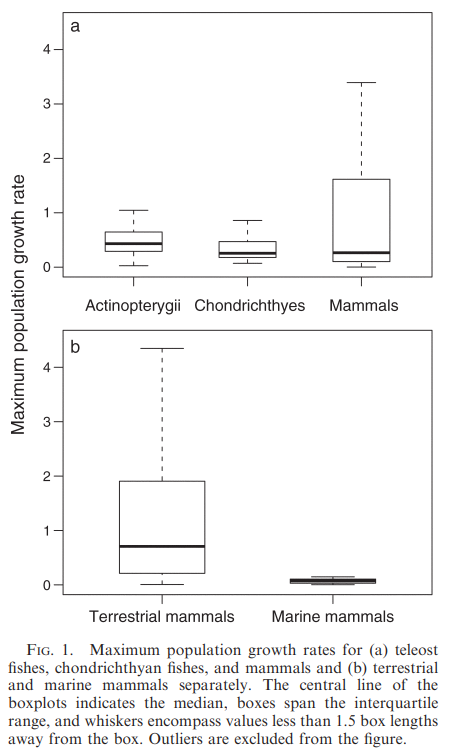
Maximum population growth rates differed among teleosts, chondrichthyans, and mammals:
Based on their median estimates and degree of CI overlap, rmax was highest among teleosts and terrestrial mammals, significantly lower among chondrichthyans, and lower still among marine mammals.
Maximum population growth rate was significantly affected by interactions with both the life-history trait and taxonomic class in all three models:
Fecundity was not correlated with (r_{max}) in fishes, although a positive association was evident in mammals
Body size was negatively correlated with maximum population growth rate in chondrichthyans and mammals, whereas in teleosts the negative correlation was not significant
Age at maturity was strongly and negatively correlated with (r_{max}) within each taxonomic class
Discussion:
Maximum population growth rate and, thus, extinction probability differs among taxonomic classes of vertebrates
Population growth rate is highly correlated with age at maturity across taxa, suggesting that this life-history metric might be the most reliable predictor of (r_{max})→ consistent with earlier work
Regression models can be used to predict maximum population growth rate when data for only one significant life-history correlate of (r_{max}) are available→ can be used in efforts to apply life-history criteria to species conservation and management
The maximum population growth rate of sharks, skates, rays, and chimaeras is significantly lower than that of teleosts→ possibly due to larger body size and older age at maturity characteristic of chondrichthyans. Mammals do not differ from teleosts though→ suggests the probability of extinction among teleosts is similar to that of terrestrial mammals
There is no support for the hypothesis that increased fecundity confers lower extinction threat and increased resilience in fishes
reason why fecundity is unrelated to rmax may be that it is only one of many traits that contribute to an individual’s fitness (and thus population growth rate) and given that various tradeoffs (reflected by negative associations among traits) often prevent selection from increasing the value of one fitness-related trait without diminishing the value of another (Roff 2002). Nonetheless, we do note the positive species-level association between fecundity and rmax within mammals, which might be attributable to the relatively narrow range in fecundity within this class
At the species level, the functional relationships between life-history traits and (r_{max}) differed among chondrichthyans, teleosts, and mammals
Age at maturity can serve as a universal predictor of extinction risk in fishes and mammals when (r_{max}) is unknown
Limitations→ there remains uncertainty in one’s estimate of rmax for a given species, an uncertainty that can be magnified by environmental stochasticity
Future→ application of our results will improve overall predictability in forecasting species or population viability and their risk of depletion or extinction
Demographic and life history traits explain patterns in species vulnerability to extinction, Haydee Hernandez-Yañez et al., 2022
Introduction:
the importance of predicting species vulnerability to extinction which depends on intrinsic (life history) and extrinsic (environmental) factors
introduces the idea of using demographic rates such as survival, growth, and reproduction to describe life history strategies9. The introduction also mentions the study's aim
aim→ to investigate if certain demographic patterns (in stage-specific survival and reproductive rates) are more vulnerable to extinction than others, using the COMPADRE and COMADRE databases
Methods:
data sources used→ COMPADRE and COMADRE databases, IUCN Red List, and phylogenetic information
there was a selection criteria for species and matrices
calculated 14 life history and demographic metrics
used 159 species of herbaceous plants, trees, mammals, and birds
statistical analyses used→ conditional random forest and phylogenetic generalized least squares regression
Results:
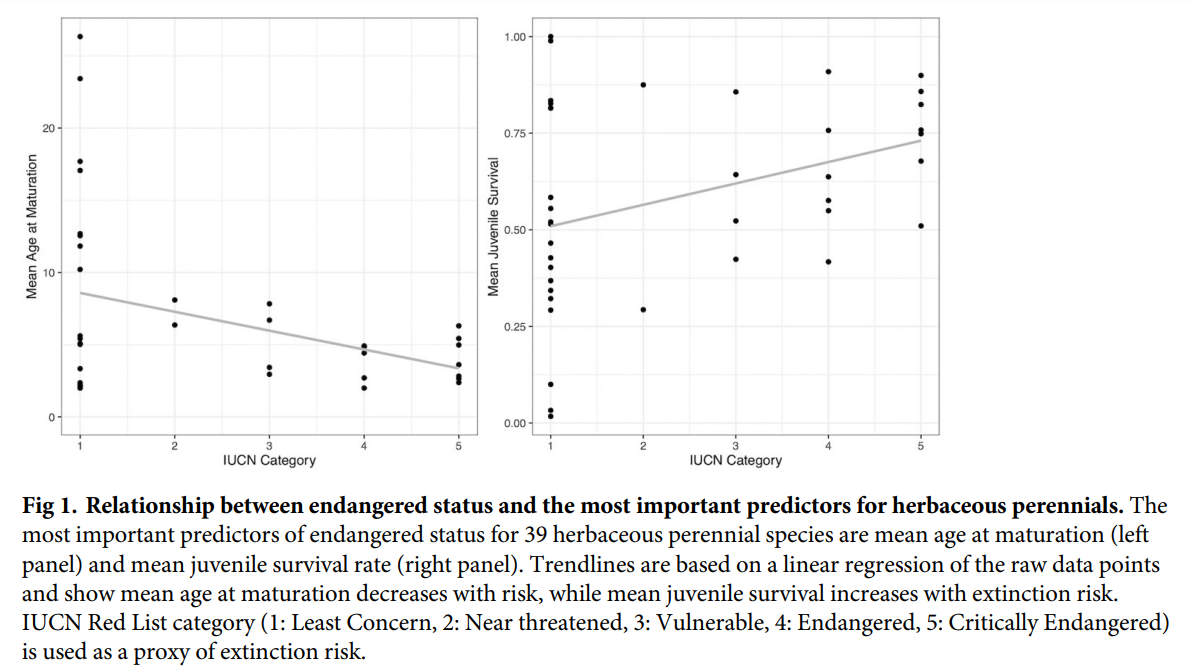
For herbaceous perennials (plants that live for more than two years and can survive frost), early maturation and high juvenile survival correlate with higher extinction risk
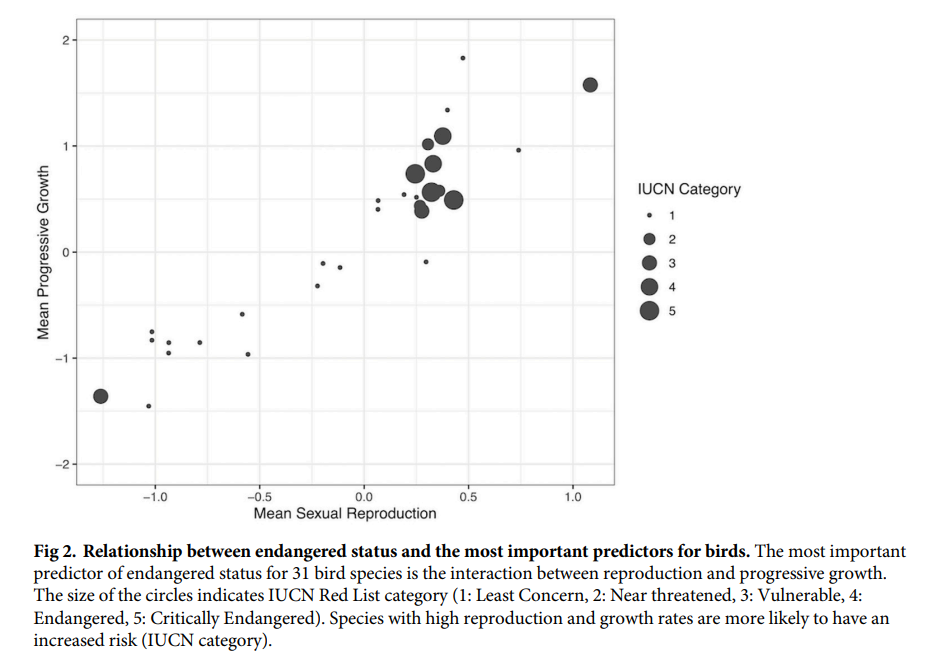
For birds, high reproduction and progressive growth are associated with greater vulnerability
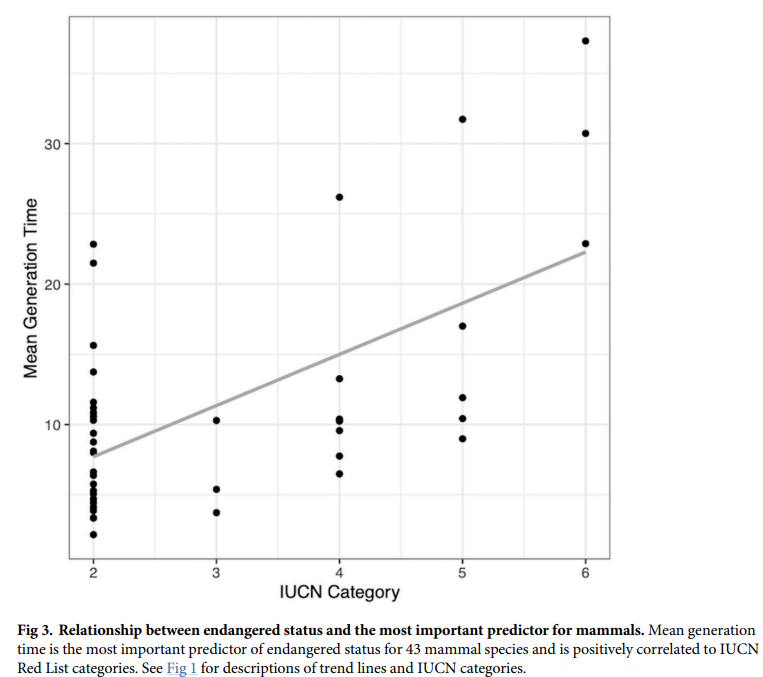
Mammals with longer generation times are more prone to extinction
No significant predictors of endangered status were found for tree species
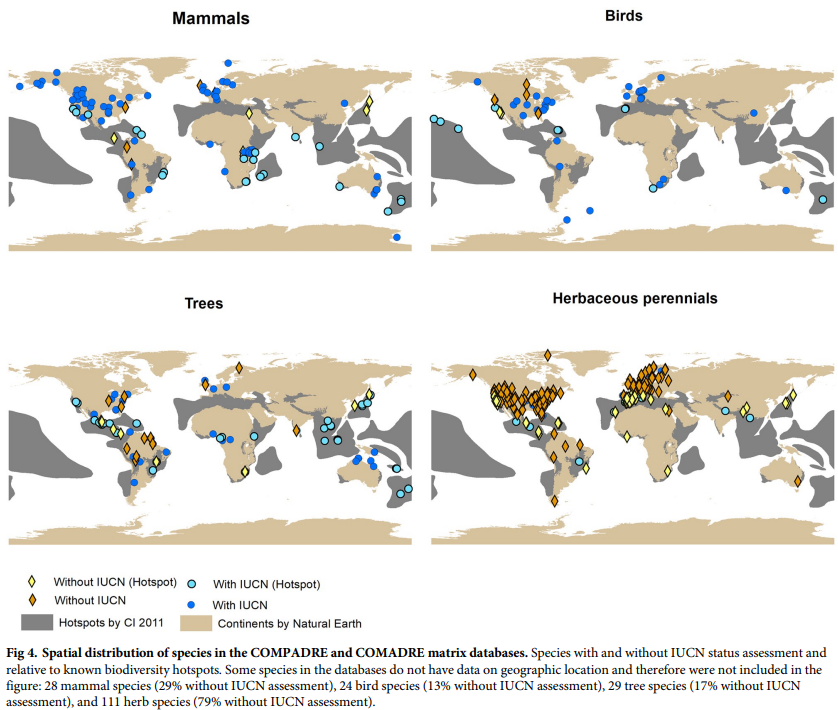
There are a number of species in COMPADRE and COMADRE without IUCN assessments, the study examines the overlap of species with biodiversity hotspots and IUCN assessments to those without
Discussion:
existing literature→ taxa differ in the variables that explain their vulnerability to extinction
potential reasons for the findings→ life history strategies and extrinsic threats
limitations→ fecundity calculations, suggests further analyses
conclusion→ is important to use demographic data for IUCN assessments and identify at-risk species
linking rmax to age of maturity, number of offspring and survival
3 traits- body size, age of maturity and fecundity
controlled for phylogenetic relationships
used more organisms
IUCN red list have many positives but lots aren’t completed yet
future papers incorporate climate change→ PA management
extrinsic factors→ human activity
primary correlate of rmax was age of maturity→ mechanisms
Q1:
Taxonomic diversity was a strength as it included marine species and plants as well as animals, however Hernandez-Yañez et al. didn’t have a large sample of species within each IUCN category (as low as 2-3 species in a category).
IUCN red-list is determined by humans so may include biases/ are under-studied due to accessibility issues, e.g. many species are data deficient and less charismatic species are overlooked. Hutchings et al use of rmax meant it didn’t include as much environmental stressors such as habitat degradation and anthropogenic pressure in their metrics of extinction risk, which is one of the strengths of using IUCN data, since it includes those extrinsic pressures.
Hutchings et al. discussed how conservationists might identify and prioritise vulnerable species when their rmax is less known by using age at maturity and generation time. This may be helpful particularly for data deficient species.
Q2:
Age at maturity often matters more than fecundity or body size because it directly influences a species' population growth rate (rmax).
Species that mature later take longer to start reproducing, which slows population recovery after declines.
Even if a species has high fecundity, delayed reproduction means fewer opportunities to replace lost individuals, especially if adults face high mortality.
Body size can correlate with slower life histories, but it's not as precise a predictor as age at maturity.
Q3:
Life history - can identify species who are inherently vulnerable (slow history). - although fast life history species can still become extinct if their environment is significantly changed.
Q4:
Marine mammals- True
predicting species extinction risk- false
High fecundity- false
Low rmax- true
Related species- true