Properties of Substances and Mixtures (AP Exams) — Complete Study Guide
Intermolecular & Interparticle Forces (IMFs)
1. London Dispersion Forces (LDFs)
The weakest type of IMF exists between all atoms and molecules.
Caused by temporary (instantaneous) dipoles when electron clouds shift momentarily.
Strength increases with:
Larger molar mass (more electrons = more polarizable).
Greater surface area (more contact = stronger attractions).
Important in nonpolar substances (e.g., noble gases, N₂, O₂, hydrocarbons).
Example: I₂(s) has stronger LDFs than F₂(g) due to more electrons and larger molecular size.
2. Dipole-Induced Dipole Interactions
Occur when a polar molecule induces a dipole in a nonpolar molecule by distorting its electron cloud.
Strength depends on:
Polarity of the polar molecule.
Polarizability of the nonpolar molecule.
Example: O₂ (nonpolar) dissolving in H₂O (polar)—temporary attraction forms.
3. Dipole–Dipole Interactions
Occur between two polar molecules with permanent dipoles.
Molecules align positive end to negative end.
Stronger than dispersion forces but weaker than hydrogen bonding.
Greater dipole moment = stronger interactions.
Example: HCl molecules attract through dipole–dipole forces.
4. Ion–Dipole Interactions
Occur between an ion and a polar molecule.
Very strong IMF; key in dissolving ionic compounds in water.
Example: Na⁺ and Cl⁻ ions surrounded by water molecules in an aqueous solution.
Cations attract oxygen (δ–) and anions attract hydrogen (δ+).
5. Molecular Dipole Moment
A measure of net polarity in a molecule; vector sum of all bond dipoles.
Molecules can have polar bonds but no dipole moment if symmetrical (e.g., CO₂, CCl₄).
Measured in Debye units (D).
Polar molecules exhibit stronger IMFs, higher boiling/melting points, and greater solubility in polar solvents.
6. Hydrogen Bonding
Special case of strong dipole–dipole interaction.
Occurs when H is bonded to N, O, or F and attracted to a lone pair on another N, O, or F atom.
Responsible for:
High boiling points of water and alcohol.
Ice’s lower density (hydrogen bonds form an open lattice).
DNA base pairing (A–T, G–C hydrogen bonds).
Example: H₂O, NH₃, HF.
7. Interactions in Large Biomolecules
Biological macromolecules (proteins, DNA) rely on multiple weak IMFs:
Hydrogen bonding stabilizes secondary structures (α-helices, β-sheets).
Van der Waals (dispersion) forces help protein folding.
Ion–dipole and dipole–dipole interactions maintain tertiary and quaternary structures.
Weak forces collectively create strong structural stability.
Properties of Solids, Liquids, & Gases
1. Solids & Liquids
Determined by IMF strength:
Stronger IMFs → higher melting/boiling points.
Weak IMFs → more fluid and volatile substances.
Solids
Properties:
Fixed shape and volume
Strong particle attractions
Liquids
Properties:
Fixed volume
Variable shape
Moderate IMFs.
2. Ionic Solids
Composed of positive and negative ions in a crystal lattice.
Strong ionic bonds
Properties:
Have high melting point
Hard
Brittle
Conductivity:
Solid: nonconductive (ions fixed in lattice).
Molten/dissolved: conductive (ions free to move).
Example: NaCl, MgO.
3. Covalent Network Solids
Atoms held by covalent bonds in a continuous network.
Properties:
Very hard
Have high melting points
Poor conductors
Examples:
Diamond (C) — tetrahedral bonding.
Quartz (SiO₂) — 3D silicon–oxygen framework.
Graphite (C) — sheets of covalent layers (conducts electricity due to delocalized electrons).
4. Molecular Solids
Made of discrete molecules held by IMFs (not covalent or ionic bonds).
Properties:
Low melting points
Soft
Poor electrical conductors
Examples: CO₂ (dry ice), H₂O (ice), C₁₂H₂₂O₁₁ (sucrose).
5. Metallic Solids
Consist of metal cations surrounded by a sea of delocalized electrons.
Properties:
Malleable
Ductile
Electrically/Thermally Conductive
Strength varies with metal ion charge and electron density.
Examples: Fe, Cu, Ag, Na.
6. Noncovalent Interactions in Large Molecules
Includes:
Dispersion
Dipole–dipole
Hydrogen bonding
Ion–dipole
Dictate biological recognition (enzyme–substrate binding, DNA pairing).
Weaker individually but strong in large numbers.
7. The Structure of Solids
Described by crystal lattice patterns:
Simple cubic
Body-centered cubic (BCC)
Face-centered cubic (FCC)
Unit cell: smallest repeating unit.
Affects density, melting point, and stability.
8. The Liquid Phase
Particles close together but can move freely.
Surface tension and viscosity depend on IMF strength.
Evaporation rate inversely proportional to IMF strength.
9. The Gas Phase
Particles far apart; negligible attraction.
Compressible and expandable.
Follows gas laws under ideal conditions (low pressure, high temperature).
Gas Laws
1. The Ideal Gas Law
PV = nRT
P = pressure (atmospheres, atm)
V = volume (liters, L)
n = moles (moles, mol)
R = gas constant = 0.0821 L·atm/mol·K
T = temperature (kelvin, K).
Applies best to gases with weak IMFs and low density.
Derivatives:
Boyle’s Law: P ∝ 1/V (constant T, n).
Charles’s Law: V ∝ T (constant P, n).
Avogadro’s Law: V ∝ n (constant P, T).
2. Partial Pressure & Total Pressure
Dalton’s Law: Pₜₒₜ = P₁ + P₂ + P₃ + …
Meaning:
The total pressure of a mixture of gases is equal to the sum of the partial pressures of all the individual gases in the mixture.
Each gas exerts pressure proportional to its mole fraction.
Used for gas collection over water and mixture analysis.
3. Graphical Representations of Gas Laws
Boyle’s Law

Pressure (P) vs. Volume (V)
Shape: A curve (hyperbola) that slopes downward from left to right.
Meaning:
When volume decreases, pressure increases.
When volume increases, pressure decreases.
Explanation: The gas particles have less space to move when volume is smaller, so they hit the walls of the container more often creating higher pressure.
Example: If you compress a syringe (decrease volume), you feel more resistance (increased pressure).
Pressure (P) vs. 1/Volume (1/V)
Shape: A straight line passing through the origin.
Meaning:
As 1/V increases, P increases proportionally.
Explanation: This linear relationship confirms the inverse proportionality between pressure and volume.
Charles’s Law
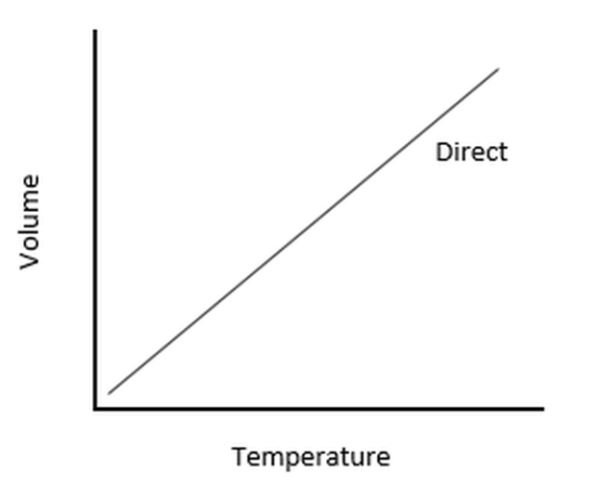
Volume (V) vs. Temperature (T)
Shape: A straight line that slopes upward from left to right.
Meaning:
When temperature increases, volume increases.
When temperature decreases, volume decreases.
Explanation: Heating a gas causes its particles to move faster and push outward, expanding the volume if the pressure remains constant.
Example: A balloon expands when heated because the gas molecules inside move faster and occupy more space.
Avogadro’s Law
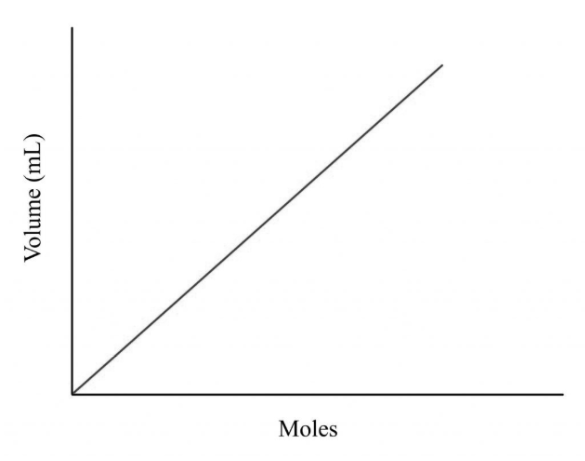
Volume (V) vs. Moles (n)
Shape: A straight line that slopes upward from left to right.
Meaning:
When the number of moles increases, the volume increases.
When the number of moles decreases, the volume decreases.
Explanation: Adding more gas particles (moles) increases the number of collisions with the container walls, so the gas expands to maintain constant pressure and temperature.
Example: Filling a balloon with more air makes it larger because more gas particles occupy more space.
4. Kinetic Molecular Theory (KMT)
Gas particles are in constant random motion.
Volume of individual molecules ≈ negligible.
Collisions are elastic (no energy loss).
Average kinetic energy ∝ temperature (Kelvin).
Explains pressure as particle collisions with container walls.
5. The Maxwell–Boltzmann Distribution
Describes range of molecular speeds in a gas sample.
At higher temperatures:
Distribution broadens.
Average kinetic energy increases.
Lighter molecules move faster on average.
6. Non-Ideal Behavior of Gases
Deviate from ideal gas law at high pressures or low temperatures.
Attractive forces lower pressure; finite volume reduces free space.
Corrected by van der Waals equation:
[(P + a(n/V)^2)(V - nb) = nRT]
where a and b correct for attractions and volume, respectively.
Solutions & Mixtures
1. Calculations About Solutions
Molarity (M): M = moles solute / liters solution.
Molality (m): m = moles solute / kg solvent.
Percent composition, mole fraction, ppm/ppb used in concentration analysis.
2. Homogeneous & Heterogeneous Mixtures
Homogeneous: uniform composition (solutions).
Heterogeneous: non-uniform, distinct phases (suspensions, emulsions).
Example: air = homogeneous; sand in water = heterogeneous.
3. Molarity
Used for stoichiometric calculations.
Dilution formula: M₁V₁ = M₂V₂.
Important for titrations and reaction concentration control.
4. Particulate Representations of Solutions
Diagrams depict:
Solvent–solute interactions (ion–dipole, hydrogen bonding).
Ion dissociation in ionic solutes.
Molecular solutes staying intact but evenly distributed.
5. Separation by Chromatography
Separates components based on affinity for mobile and stationary phases.
More polar substances interact strongly with polar stationary phase → move slower.
Used for pigment separation, purity tests, forensic analysis.
6. Separation by Distillation
Relies on differences in boiling points.
Lower boiling point component vaporizes first.
Used to purify liquids or separate miscible liquids.
7. Solubility of Ionic & Molecular Compounds
“Like dissolves like”: polar dissolves polar; nonpolar dissolves nonpolar.
Ionic compounds dissolve via ion–dipole interactions.
Molecular solutes dissolve via dipole–dipole or hydrogen bonding.
Solubility depends on temperature and IMF balance.
Spectroscopy
1. The Electromagnetic Spectrum
Ordered by wavelength (λ) and frequency (ν):
Radio → Microwave → Infrared → Visible → UV → X-ray → Gamma.
Energy related by: E = hν = hc/λ.
Shorter wavelength → higher energy.
2. Transitions Associated with Radiation
Microwave: molecular rotations.
Infrared (IR): bond vibrations.
Visible/UV: electronic transitions.
X-rays: inner electron transitions or ejection (photoelectron spectroscopy).
3. Properties of Photons
Photon energy depends on frequency: E = hν.
Photoelectric effect: light of sufficient energy ejects electrons from metal surface.
Demonstrates quantized nature of light.
4. Beer–Lambert Law
Relates absorbance (A) to concentration (c) and path length (l):
A = εlc, where ε = molar absorptivity.Used in UV–Vis spectroscopy to determine solution concentration.
Higher concentration → higher absorbance (linear relationship).
✅ AP Exam Focus Tips
Be able to compare IMF strength and predict relative boiling/melting points.
Explain why certain substances dissolve or remain insoluble using molecular reasoning.
Interpret phase diagrams and gas law graphs.
Perform stoichiometric and molarity calculations accurately.
Describe spectroscopic evidence for molecular structure or concentration.
Relate microscopic behavior (particle level) to macroscopic properties (observable traits).