SSD Wk3- Process Modeling and Data Flow Diagram Basics
Process Modeling Definition
Graphically represent processes that:
Capture, manipulate, store, and distribute data
Flow between a system and its environment, as well as its components.
Use information from requirements determination.
Benefits of Process Modeling
Clear Understanding: Improves comprehension of how processes function.
Consistency: Standardizes processes and controls execution.
Efficiency: Identifies and eliminates redundancies and inefficiencies.
Clarity: Outlines starting and ending points of processes.
Popular Methods of Process Modeling
Data Flow Diagram (DFD)
Entity Relationship Diagram (ERD)
Data Flow Diagram Definition
A DFD is a visual representation that illustrates:
Information flow through a process or system.
Helps in understanding operational functions, discovering problems, and improving efficiency.
Benefits of DFDs
Accessibility: Easier to comprehend complex concepts compared to text.
Clarity: Aids in understanding team requirements for operations.
Productivity: Enhances team effectiveness by minimizing errors and streamlining processes.
Clear Visualization: Allows for clear visualization of data flows, structures, and requirements.
Gane and Sarson Notations (DFD Symbols)
Gane and Sarson notation is a structured method used to represent Data Flow Diagrams (DFDs). It consists of specific symbols to represent processes, data flows, data stores, and external entities.
1. Process
Represents a function or activity that transforms incoming data into outgoing data.
Labeled with a verb-noun phrase (e.g., "Process Order").
Represented as a rounded rectangle
2. Data Flow
Shows the movement of data between processes, data stores, and external entities.
Labeled with a noun phrase (e.g., "Order Details").
Represented as an Arrow.
3. Data Store
Represents a repository where data is stored for later use.
Labeled with a noun phrase (e.g., "Customer Database").
Represented as an open rectangle
4. External Entity (Source/Sink)
Represents an external system, person, or organization that interacts with the system.
Often placed at the edges of the diagram.
Represented as a square or rectangle
DFDs and Use Case Diagrams (Relationship and Conversions)
DFDs focus on the flow of data within a system, while use case diagrams emphasize the interactions between users and the system, illustrating the functional requirements.
Key Differences:
DFDs provide a detailed view of data processes and storage, whereas use case diagrams offer a high-level overview of user interactions.
DFDs are used primarily for system analysis and design, while use case diagrams help in understanding user requirements.
Converting Use Case Diagrams to DFDs
Important to visualize data flow, map processes, and understand component interactions. Example: Renovating a house by converting a floor plan into a detailed construction plan.
Steps for Conversion to DFD
Identify Main Processes
Core activities of the main process.
Ensure alignment with overall system objectives.
Determine the inputs and outputs of the main process.
Identify Data Flows
Map movement of data, sources, and destinations.
Determine the sources and destinations of data
Consider the data stores involved in the process, including databases, cloud storage, and any external APIs that may interact with the system.
Identify The External Entities
Identify all external entities interacting with the system, i.e Users, other systems, or organizations
Document the interactions between the external entities and the system.
Consider how data flows between the external entities and the system.
Generate the diagram.
Context Diagram Overview
The context diagram provides a high-level view of the system's interactions with external entities.
It illustrates the flow of information and data between the system and its external stakeholders, such as users, other systems, and data sources.
Key components include:
External Entities: Represented as squares, indicating users or systems that interact with the primary system.
Data Flows: Arrows that show the direction of information exchange between the system and external entities.
System Boundary: A circle or box that encapsulates the system, distinguishing it from external interactions.
Note: Only has one process symbol, and no data stores shown.
DFD Guidelines
The input to a process must be different from the out put of that process
Every Process must have a unique name that clearly describes its function to avoid confusion and ensure accurate documentation.
Processes:
No process can have only outputs, if an object has only outputs then it must be a source.
No process can have only inputs, if an object has only inputs then it must be a sink.
A process is labeled as a verb phrase
Data Store:
Data cannot move directly from one data store to another, it must be moved by a process
Data cannot move directly from an outside source to a data store, it must be moved by a process.
Data cannot move directly to an outside sink from a data store, It must be moved by a process.
Data store has a noun phrase label
Source/Sink:
Data cannot move directly from a source to a sink, it must be moved by a process if the data is to be of any concern to the system, otherwise, the data flow is not shown on the DFD.
A source/sink has a noun phrase label.
Data Flow Direction: A data flow moves in only one direction between symbols. When reading before updating a data store, use two separate arrows to indicate different timings.
Fork in Data Flow: A fork means the same data is sent from a common point to multiple processes, data stores, or external entities (sources/sinks), indicating copies going to different locations.
Join in Data Flow: A join means identical data is received at a common location from multiple sources (processes, data stores, or external entities).
No Direct Self-Loop: A data flow cannot return directly to the process it originated from; at least one intermediary process must handle the flow before it loops back.
Data Store Interaction:
Data flow to a data store = Update (delete or change).
Data flow from a data store = Retrieve or use.
Labeling Data Flows:
A data flow should have a noun phrase label.
Multiple noun phrases can be on a single arrow if they move together as one unit.
Note:
Timing: Time is not represented well of DFDs, Best to draw DFDs as perpetual systems with no start or stops
DFD development is iterative, expect to redraw diagrams severally before reaching closest approximation.
Functional Decomposition
The iterative process of breaking a system description down into finer detail. Creates a set of charts in which one process on a given chart is explained in greater detail by another chart. This process continues until no subprocesses can be further decomposed.
Decomposition Levels
Context Diagram —→ Level 0 DFD —→ Level 1 DFD ——Level-n DFD
Each level provides increasing detail, illustrating how data flows between processes and data stores.
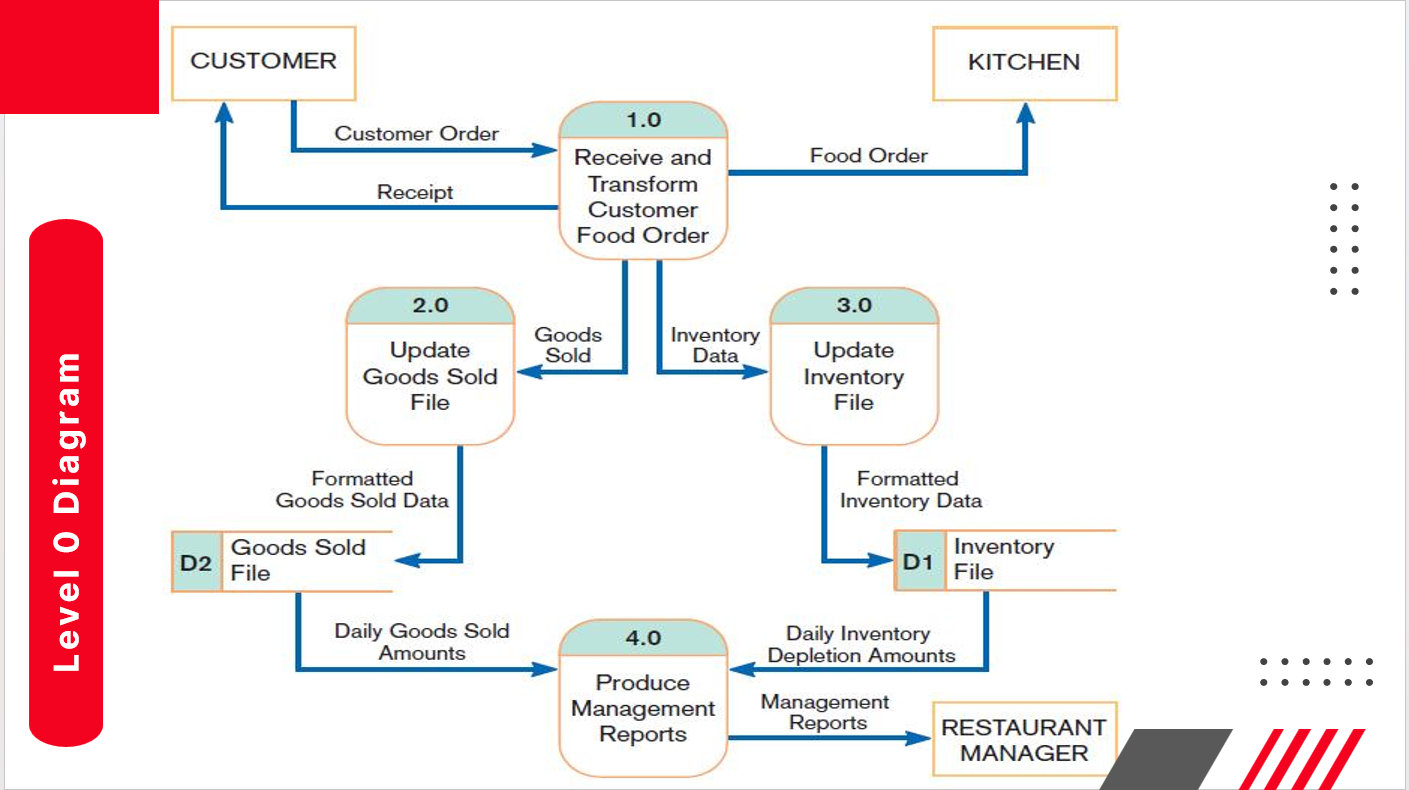
Level-0 DFD
Represents a system's major processes and flows at a high level of detail. Each process is labled 1.0, 2.0,etc. These processes can be decomposed into lower level DFDs
Level 0 Diagram Example
This example displays food ordering processes involving customer orders, inventory updates, and report management.
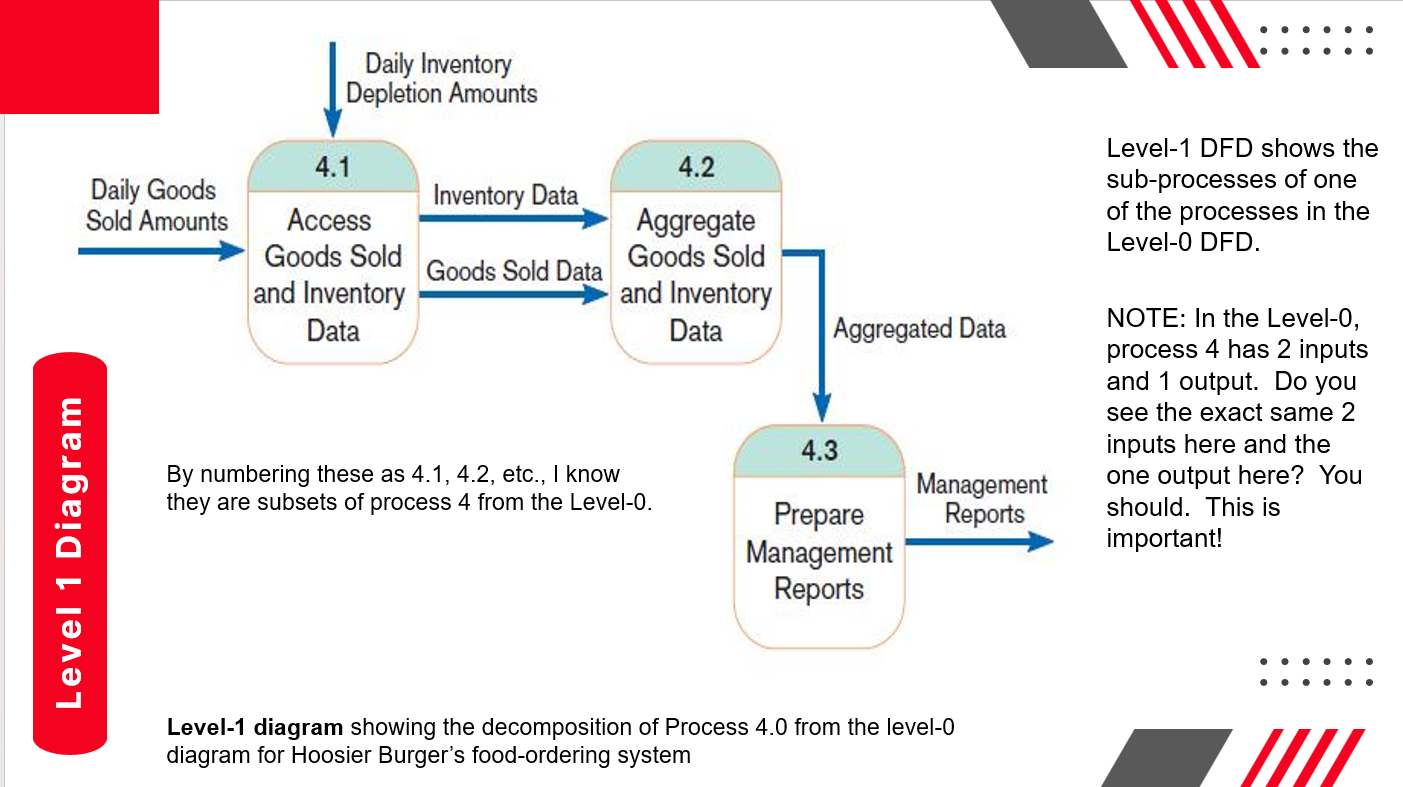
Level 1 DFD
Shows decomposition of processes in Level-0 DFD. Number if input and output for a level 1 DFD must match the number of inputs and outputs in the level 0 process it represents.
Level 1 DFD Example
This example is a Level 1 decomposition of the Level 0 process number 4
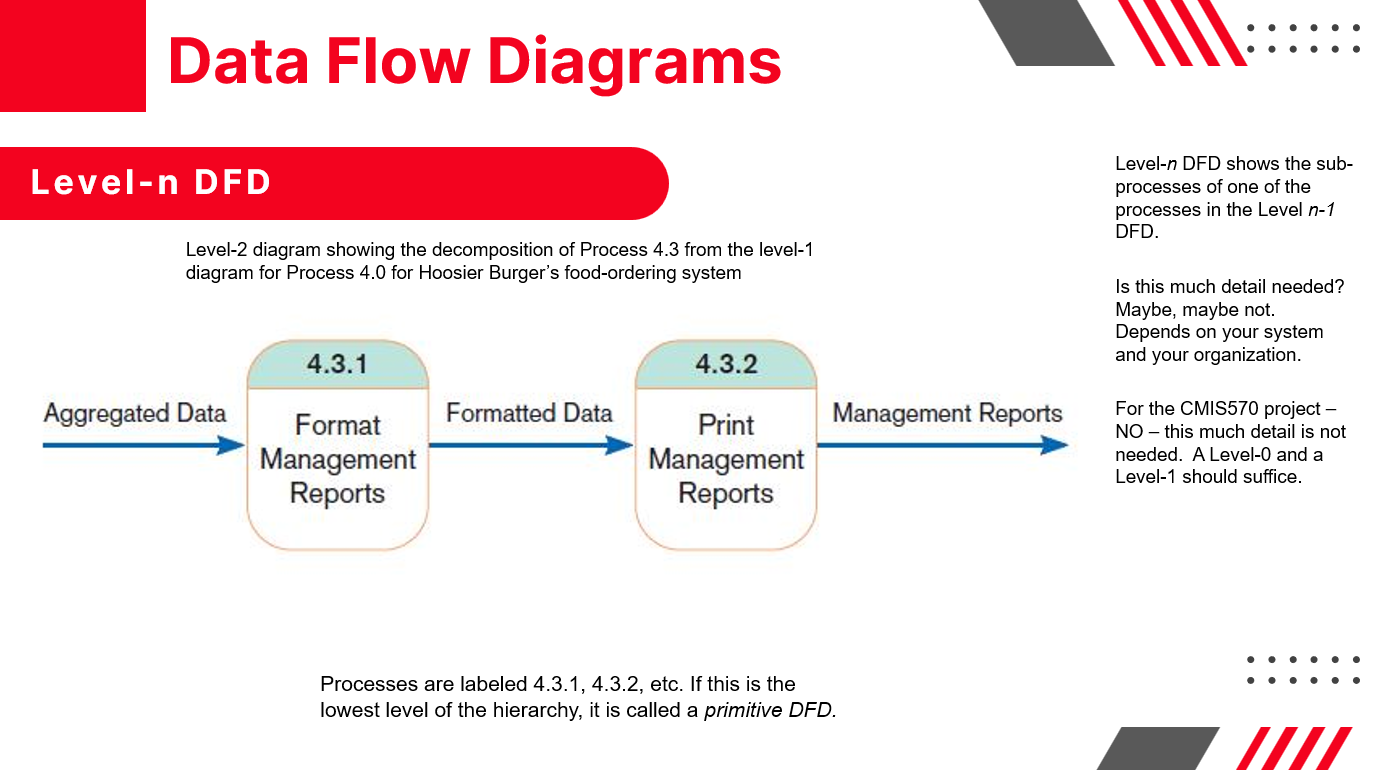
Level-n DFD
Displays the lowest level of decomposition when detailed information is necessary.
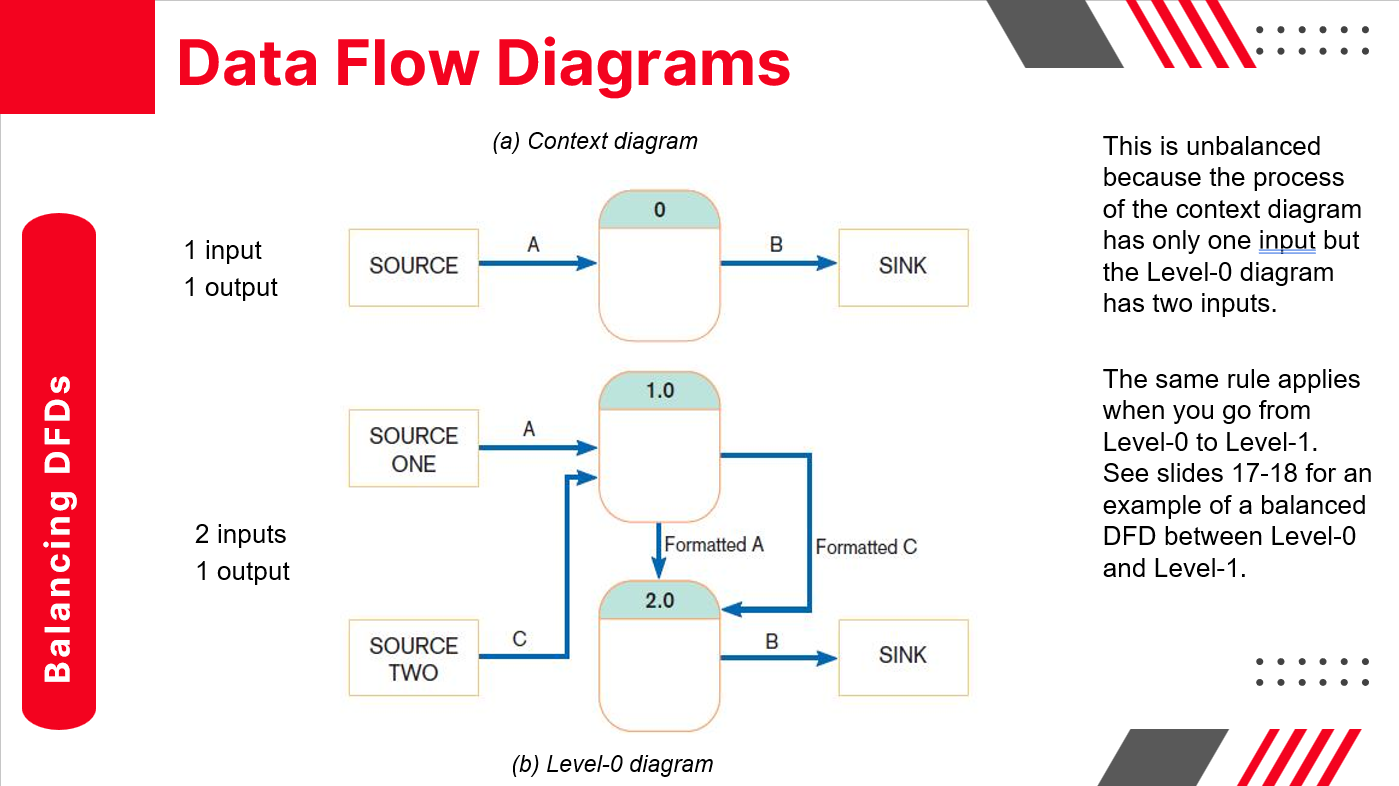
Balancing DFDs
Input/output counts need consistency across levels.
DFD Balancing
A Balanced DFD is one where the number of inputs an outputs match across all levels of the diagram.
Rules for Balancing DFDs
Composite Data Flow: A composite flow on one level can be broken into component flows at the next level, but no new data can be added. All composite data must appear in sub-flows.
Inputs and Outputs:
Inputs to a process must be sufficient to produce its outputs, including data stored in data stores.
All data in the inputs must be accounted for, either moving to another process, a data store, or another level of DFD.
Exceptional Conditions: At the lowest DFD level, new data flows (e.g., error messages) may be added for exceptional conditions like prompts or warnings.
Avoid Line Crossings:
To prevent line crossings, repeat symbols for data stores or sources/sinks.
Use distinguishing marks (e.g., double vertical lines on data stores or diagonal lines on sink/source squares) to indicate repeated symbols.
Timing considerations in DFDs and iterative development processes.
Using a Level-0 DFD for course listing and seating arrangements.
Need for Level-0 DFD in automating current payroll processes.