Exam 3 Supply Chain
Chapter 7-9
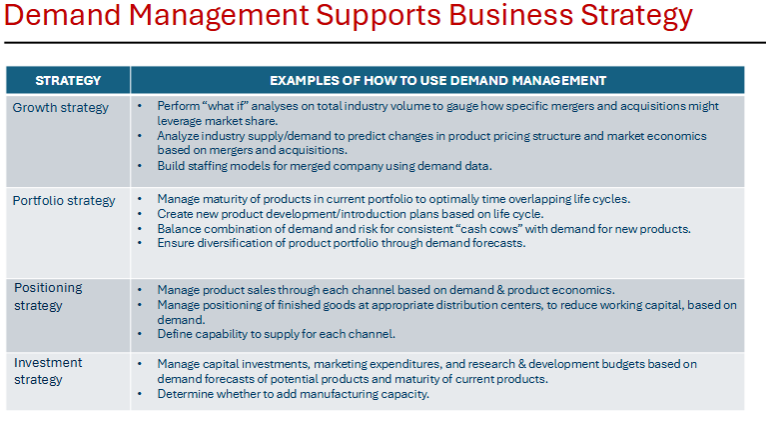
The Essence of Demand Management
To estimate and manage customer demand and use this
information to make operating decisions.To further the ability of firms throughout the supply chain to
collaborate on activities related to the flow of products, services,
information, and capital
Desired end result:
Greater value for the end user or consumer
Common Problems in Demand Management
Lack of coordination between departments
Too much emphasis placed on forecasts of
demand, with less attention on the
collaborative efforts and plans needed to be
developed from the forecastsNon-strategic uses of demand information
Effective Demand Management
unifies channel members with the
common goals of satisfying customers and solving customer problems.Gather & analyze knowledge about consumers, their
problems, and their unmet needs.Identify partners to perform functions needed in
demand chain.Move functions to the channel member that can perform
them most effectively and efficiently.Share with other supply chain members knowledge
about customers, technology, and logistics challenges
and opportunities.Developing products and services that solve customers’
problems.Develop & execute best methods to deliver products &
services to consumers in the desired format.
Demand Forecasting
Foundation of many SC manager decisions
How to balance supply and demand
All forecasts will be wrong
Select the forecasting technique with the lowest forecast error
Two Types of Demand Forecasting
Forecasts serve as a plan for both marketing and operations to set goals
and develop execution strategies
Independent Demand
demand for the primary item, known as base
demand
Dependent Demand
demand directly influenced by demand for an
independent item
All Demand is Subject to Fluctuations
Random fluctuation – cannot be
anticipated & is usually the cause to hold
safety stocks to avoid stockoutsTrend fluctuation – gradual increase or
decrease in demand over time for an
organizationSeasonal fluctuation – patterns will
normally repeat themselves during a year
for most organizations
common forecasting techniques
simple moving average
weighted moving average
exponential smoothing
weighted moving average
assigns a weight to each previous period with higher weights usually given to the more recent demand
pros: allows emphasis on more recent demand as a predictor of future demand
cons: not easily accommodate seasonal demand patterns
Other Quantitative Methods
Regression – based on the assumption that underlying factors influence
what is being forecastedSimulation – can be very sophisticated, often used to compare different
forecasting methods
Common Qualitative Methods
Executive Judgment – expert opinions from different
departments is averagedSales Force Composite – forecast based on the
opinions of salespeopleMarket Research/Survey – directly collecting
information from consumers about purchasesDelphi Method – panels of experts individually
questioned (not as a group); effective for long range
forecasting
Demand Management Impacts Order Management
Demand Management: How organizations create forecasts that are
used to create marketing, production,
finance, and logistics plans & Align organization resources to strategic
goalsOrder Management & Customer Service: The execution of the plans from demand management & Tactical, day-to-day activities
Order Management
Defines and sets in motion the logistics
infrastructure of the organization
Two Phases:
Phase 1: Influence and Order
Organization attempts to change the manner by which
customer place orders
Phase 2: Execute the Order
Order receipt: electronic vs. manual
Order fulfillment: inventory policy, number and location
of warehousesOrder shipments: transportation mode choice
Customer Service
Anything that touches the customer, including all activities that impact
information flow, product flow, and cash flow between the organization and its
customersCustomer service as a philosophy
Elevated to an organization-wide commitment
Customer service as a performance measure
Assess performance through measures like on-time delivery and percentage of
orders filled complete
Customer service as an activity
A task that an organization must perform to satisfy customers
Order Management: Influencing the Order
Customer Relationship Management (CRM)
Align the supplier’s resources with its customers in a manner that
increases both customer satisfaction and supplier profitsHow? How much? What? When?
• Maximize efficiencies of the shipping organizations logistics
network
4 Basics Steps in the Implementation of the CRM Process
1. Segment the Customer Base by Profitability
2. Identify the Product/Service Package for Each Customer
Segment3. Develop and Execute the Best Processes
Measure Performance and Continuously Improve
CRM: product/service package example Option #1, Most Commonly Used
Offer the same product/service to each customer segment, while varying the product quality or
service levels.Pro: easy for the supplier to manage
Con: Assumes that all customer segments value the same types of supplier offerings.
CRM Product/Service Package Example, Option#2
Vary the service offerings for each customer segment
Pro: meet the needs of each segment
Con: difficult for the supplier to manage
What is Activity Based Costing?
“A methodology that measures the cost and performance of activities, resources, and cost
objects. Resources are assigned to activities, then activities are assigned to cost objects based
on their use. ABC recognizes the causal relationships of cost drivers to activities”
Customer Segmentation
Danger zone segment strategies are: (1) Change the manner in which the customer interacts with the shipper to
move the customer to another segment; (2) Charge the customer the actual cost of doing; or (3) Switch the customer to an alternative distribution channel.Build segment strategies aim to maintain the cost to serve but build net sales value to help drive the customer into the “Protect” segment.
Cost engineer segment strategies aim to find more efficient ways for the customer to interact with the shipper.
Protect segment: most profitable, provide shipper with the most cost efficiencies
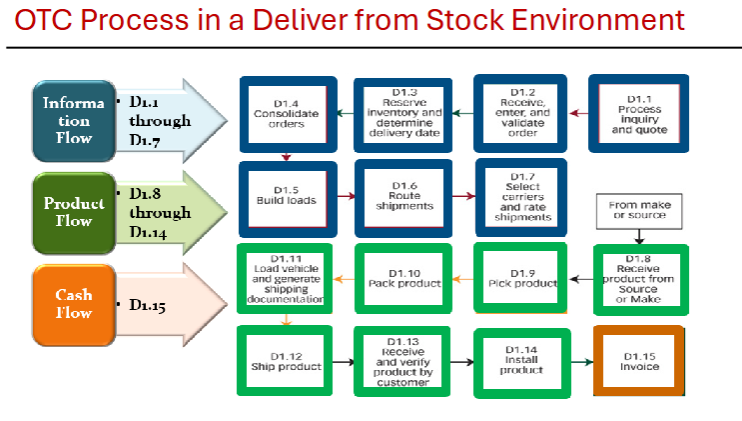
OTC: refer to outbound-to-customer shipments. The order to cash (or order cycle) is all of the activities that occur when an order is received by a seller until the product is received by the buyer, plus the flow of funds back to the seller based on the invoice.
Replenishment Cycle: The term replenishment cycle is used more frequently when referring to the acquisition of additional inventory as in materials management.
Customer Service
Output of logistics activities
Right product, right place, right time…lead to good
customer service
Today’s consumers:
Time conscious
Demand flexibility
High standards for quality
Not always brand loyal
Desire products at the best price, best service, with times that are convenient for their schedules
Companies build today’s customer service strategies on speed, flexibility, customization, and reliability
Customer Service: The Logistics/Marketing Interface
Marketing Objective: Allocate resources to the marketing mix to maximize long-term profitability of the firm
Logistics Objective: Minimize total costs, given customer service
objective, where: Total cost = Transportation costs + Warehousing costs + Order processing & Information costs + Lot quantity costs + Inventory carrying costs
4 Elements of Customer Service
Time – absolute length of lead time
Sellers – order to cash
Buyers – order cycle time, lead time, replenishment
time
Dependability – consistent lead time, safe delivery,
correct ordersCommunications – pre-transaction, transaction, post
transactionConvenience – flexible logistics service level
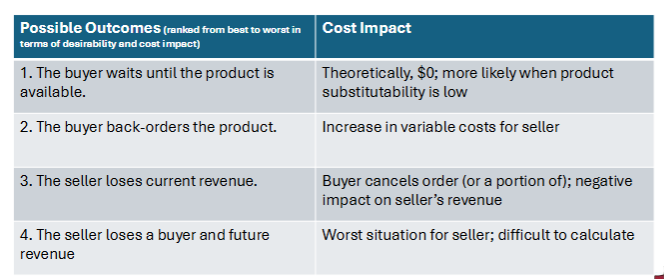
stockout- occurs when desired quantities of finished goods are not available when or where a customer needs them.
Item- a case, an inner-pack, or an “each” on an order
Line- a single product on a multiple product order
Item fill rate- the percentage of items in stock available to fill an order
Line fill rate- the percentage of total lines filled complete on an order
Order fill rate- the percentage of orders filled complete
Perfect order rate- the percentage of orders filled completely, received on time, billed accurately, etc
Metrics
Internal
Item fill rate
Line fill rate
External Metrics
Order fill rate
Perfect order
Financial Impact of Order Fill Rate: Improvement in order fill results in improvement in cash flow but might require some type of investment in inventories and/or technology
Service Recovery
Requires an organization to realize that mistakes will occur and to have plans in place to fix them.
Key Aspects
Measuring the costs of poor service
Anticipating the needs for recovery
Developing employee training and empowerment
Basic Facts About Inventory
Asset on the balance sheet
Variable expense on the income statement, direct impact on COGS
Direct impact on service levels
Part of corporate strategy
Constant balancing of too much vs. too little
Major logistics cost tradeoff is between transportation and inventory
Basics of Inventory Management
A set of techniques used to manage the inventory levels within different companies in a
supply chainGoal is to reduce cost (efficiency) while maintaining service levels customers require
(effectiveness)Forecast + product price = inputs that IM needs to balance
3 Types of Inventory
Cycle Stock – needed to meet demand between normally scheduled orders
Safety Stock – necessary to compensate for demand uncertainty & order lead times
Seasonal – produced and stockpiled in anticipation of future demand
Conflicting Goals of Functional Areas
Marketing- In favor of holding sufficient, or extra, inventory to ensure
product availability to meet customer needs and new
product offerings for continued market growth.Manufacturing- In favor of long production runs of a single product with
minimal changeovers to lower labor and machine costs
per unit, resulting in high inventory levels of the product.Finance- In favor of low inventories to increase inventory turns,
reduce liabilities and assets, and increase cash flow to
the organization
Major Types of Inventory Costs
Inventory Carrying Cost
Incurred by inventory at rest and waiting to be used. Four major components: Capital cost, Storage space cost, inventory service cost, & Inventory risk cost.
Ordering and Setup Cost
Refers to the expense of placing an order, excluding the cost of the product itself. Setup cost refers to the expense of changing/modifying a production/assembly process to facilitate line changeovers.
Expected Stockout Cost
Cost associated with not having a product/materials available to meet customer/production demand. Most organizations hold safety stock or buffer stock, to minimize the possibility of a stockout and costs of lost sales.
In-transit Inventory Carrying Cost
Generally, carrying inventory in transit costs less than in warehouses. However, in-transit inventory carrying cost becomes especially important on global moves since both distance & time increase.
4 Fundamental Questions of Inventory Management
How much should inventory be ordered?
When should inventory be ordered?
Where should inventory be held?
What specific line items should be available at specific
locations?
3 Key Factors of Inventory Management Strategies
1. Dependent vs. Independent demand- Independent demand is unrelated to
the demand for other items, while dependent demand is directly related to,
or derives from, the demand for another inventory item or product.
2. Pull vs. Push- The “pull” approach relies on customer orders to move
product through a logistics system, while the “push” approach uses
inventory replenishment techniques in anticipation of demand to move
products.
3. System-wide vs. Single-facility solutions- A system-wide approach plans
and executes inventory decisions across multiple nodes in the logistics
system. A single-facility approach does so for shipments and receipts
between a single shipping and receiving point.
Inventory Management Approaches
Economic Order Quantity (EOQ)
Just-in-time (JIT)
Materials Requirement Planning (MRP)
Manufacturing Resource Planning (MRP II)
Distribution Requirements Planning (DRP)
Vendor Managed Inventory (VMI)
Economic Order Quantity (EOQ)
Most cost-effective amount to purchase at a time
Order a fixed amount each time reordering takes place
Limitation – assumes consumer demand is constant
fixed order quantity EOQ model: inventory is reordered when the amount on hand reaches the reorder point. The reorder point quantity depends on the time it takes to get the new order and on the demand for the item during this lead time.
Just in Time (JIT) Approach
JIT is an operating concept based on delivering materials in exact amounts and at the precise times that organizations need them—thus minimizing inventory costs.
Designed to manage lead times and eliminate waste
Ideally, product should arrive exactly when an organization needs it, with no tolerance for late or early deliveries
High priority on short, consistent lead times but reliability is also important
4 Major Elements of JIT Concept
Zero inventories
Short, consistent lead times
Small, frequent replenishment quantities
High quality (zero defects)
Materials Requirements Planning (MRP)
Begins by determining how much end products (independent demand
items) customers desire and when they are neededTiming and component needs based on end-product demand are disaggregated
Objectives similar to JIT
An MRP system is designed to translate a master production schedule into time-phased net inventory requirements and the planned coverage of such requirements for each component item needed to implement this schedule.
Advantages:
Attempt to maintain reasonable safety stock levels and to minimize or eliminate inventories whenever
possible.Can identify process problems and potential supply chain disruptions long before they occur and take the
necessary corrective actions.Production schedules are based on actual demand as well as on forecasts of independent demand items.
They coordinate materials ordering across multiple points in an organization’s logistics network.
Disadvantages:
Application is computer intensive, and making changes is sometimes difficult once the system is in operation.
Both ordering and transportation costs might rise as an organization reduces inventory levels and possibly moves toward a more coordinated system of ordering product in smaller amounts to arrive when the organization needs it.
Not usually as sensitive to short-term fluctuations in demand as are order point approaches (although they are not as inventory intensive, either).
Frequently become quite complex and sometimes do not work exactly as intended.
Manufacturing Resource Planning (MRP2)
More comprehensive set of tools than MRP alone
Allows the integration of financial planning and operations/logistics
Helps an organization conduct “what if” analyses to determine appropriate product movement and storage strategies
Distribution Requirements Planning (DRP)
DRP systems accomplish for outbound shipments what MRP
accomplishes for inbound shipments.Determines replenishment schedules between a firm’s manufacturing
facilities and its distribution centers.Usually coupled with MRP systems to manage the flow and timing of both inbound materials and outbound finished goods.
Underlying rationale is to more accurately forecast demand and the
share that information for use in developing production schedules
Vendor Managed Inventory (VMI)
Vendor-managed inventory manages inventories OUTSIDE a
firm’s logistics network, specifically inventories held in its
customer’s distribution centers.How it works:
1. The supplier and its customer agree on which products are to be managed using VMI in the customer’s distribution centers.
2. An agreement is made on reorder points and economic order quantities for each of these products.
3. As these products are shipped from the customer’s distribution center, the
customer notifies the supplier, by SKU, of the volumes shipped on a real- time basis.4. The supplier monitors on-hand inventories in the customer’s distribution center, and when the on-hand inventory reaches the agreed-upon reorder point, the supplier creates an order for replenishment, notifies the customer’s distribution center of the quantity and time of arrival, and ships the order to replenish the distribution center
Principal advantages of VMI systems
The knowledge gained by the supplier of real-time inventory levels of its products at its customer locations allows the shipper more time to react to sudden swings in demand to assure that stockouts do not occur.
Principal shortcomings of VMI systems
Suppliers’ uses of VMI to push excess inventory to a customer distribution center at the end of the month in order to meet monthly sales quotas, resulting in the customer holding extra inventory, adding costs to its operations
Inventory Classification Techniques
Multiple product lines and inventory control require organizations to focus on more important inventory items and use more sophisticated and effective approaches to inventory management.
ABC Analysis
ABC classification technique assigns inventory items to one of three groups according to the relative impact or value of the items that make up the group. A items are considered to be the most important, B items lesser importance, and C items least important.
Pareto’s Law (The “80–20” Rule)
Pareto’s Law “80–20” rule suggests that a relatively small percentage of inventory might account for a large percentage of the overall impact or value.
Quadrant Model
Quadrant model classifies finished goods inventories using value and risk to the firm as the criteria. Value is measured as the value contribution to profit; risk is the negative impact of not having the product available when it is needed.
ABC Classification
In many ABC analyses, a common mistake is to think of the B and C items as being far less important than the A items. However, all items in the A, B, and C categories are important to some extent and each category deserves its own strategy to assure availability at an appropriate level of cost (stockout cost vs. inventory carrying cost).
Quadrant Model
Items with high value and high risk (critical items) need to be managed carefully to ensure adequate supply. Items with low risk and low value (generic or routine items) can be managed much less carefully.
Full Exam review
demand management
essence of demand management “slide”
demand forecasting “slide”
all demand is subject to fluctuation “slide” know the differences in fluctuations
common forecasting techniques- simple moving average & weighted moving average- know the difference between the two types; when it comes to “weighting”
common qualitative methods “slides” know what each is and difference between them
sales and operations
CPFR
difference between them
know the acronyms
Order management & customer service
order management “slide”
influencing order how and why companies do that
section about how companies “tender” orders
customer service “slide”
understand the difference between what customer service is
order management influencing the order “slide”
customer relationship management
4 steps of the relationship process
what is activity based costing- principle behind why companies use this
customer segmentation
profitable customers, change customers, danger zone customers; know the customer in each
order to cash cycle
customer service in logistics “slide”; what marketing org does v logistics org does
dreaded stockout
know what a stockout is and potential outcomes
terminology
financial impact on product availability “slide”; understand the breakeven point
Inventory management
basic facts about inventory
COGS
basics of inventory management “slide”
3 types of inventories; know which one which is
rational behind different types of inventories
seasonality, procurement, emergency or unusual need
inventory carrying cost “slide”; know the cost categories
what is not a part of inventory carrying cost?
inventory carrying cost vs. ordering cost
economic order quality “slide”
know reorder point vs safety stock
all things “just in time” JIT
requirement planning, basics on “planning”
all the acronyms with planning
vendor management
advantages and disadvantages
inventory classification techniques
ABC Vs. Quadrant models