AMSCO Unit 1 Chapter 1-2 Notes
Thinking Geographically
Unit Overview
Geography emphasizes the spatial perspective, focusing on:
The "why of where" – why phenomena are located in certain areas and their relationships.
The interactions between humans and the physical environment.
Tools for understanding geography include:
Big Ideas: Broad concepts for understanding geographic processes.
Four-Level Analysis: A framework to help structure geographic thinking (explained below).
Five Skill Categories: Guidelines for analyzing geographic data and concepts.
Branches of Geography
Physical Geography:
Studies the natural environment's spatial characteristics, such as:
Landforms
Bodies of water
Climate
Ecosystems
Erosion
Human Geography:
Focuses on human activities and their spatial patterns, including:
Population
Culture
Politics
Urban areas
Economics
Four-Level Analysis Spatial Framework
Location is key to geographic understanding.
Four-Level Analysis involves:
Comprehension: What is happening?
Identification: Are there patterns in the source?
Explanation: Pick a pattern and explain why it occurs.
Prediction: What will be the impact on the economy, society, politics, or the environment?
Tools include maps, charts, graphs, and data to analyze spatial relationships.
Four-Level Analysis Spatial Framework Example
Comprehension (L1):
Questions: What? Where? When? Scale? Source?
Example using Earth at night:
What? Earth at night
Where? Earth
When? 2016
Scale? Global scale
Source? nasa.gov
Identification (L2):
Questions: Are there patterns in the source? Examples of patterns:
Coasts are brighter than interiors.
Northern Hemisphere is brighter than the Southern Hemisphere.
Eastern China is brighter than Western China.
Explanation (L3):
Question: Why did this pattern occur there?
Example: Coastal areas have more access to global trade networks, fostering economic activity. Additionally, opportunities like jobs and resources attract populations to these areas.
Prediction (L4):
Question: What are the impacts or future implications?
Examples:
Economic: Cost of living is higher in coastal regions.
Environmental: Pollution and waste affect oceans and marine life.
Essential Geography Skill Categories 1–5
The AP Human Geography exam requires students to:
Learn content and discipline-specific language.
Apply skills to real-world scenarios in both parts of the exam.
Skill Category 1: Concepts and Processes
Analyze geographic theories, approaches, concepts, processes, or models in theoretical and applied contexts.
Analyze: Break down content and study each part carefully.
Theory: A system of ideas explaining or predicting interactions and processes.
Concepts: Key vocabulary, ideas, and building blocks geographers use to describe the world.
Processes: Series of steps explaining why or how patterns occur.
Models in Geography:
Representations of reality that help geographers understand and analyze spatial patterns.
Two types of models:
Spatial Models: Stylized maps showing patterns like land use or city distribution.
Nonspatial Models: Use graphs, tables, or words to depict changes over time rather than spatial patterns.
Data Driven Models
Formulas geographers use to help them understand how the world works.
Example:
Time-Distance Decay: The idea behind this model is that things like cities are often more connected when they are closer to each other.
Skill Category 2: Spatial Relationships:
Analyze geographic patterns, relationships, and outcomes in applied contexts.
Spatial Patterns: The general arrangement of things being studied
Important Terms Include:
Density
Dispersion
Clustered
Scattered
Linked
These terms are used to communicate information about locations and distributions
Networks: A set of interconnected entities, sometimes called nodes.
Skill Category 3: Data Analysis:
Analyze and interpret quantitative geographic data represented in maps, tables, charts, graphs, satellite images, and infographics.
Quantitative Data: Any information that can be measured and recorded using numbers
Geospatial Data: Quantitative data that includes a geographic location as a component
Remember that data can be incorrect, inaccurate, or incomplete.
Skill Category 4: Source Analysis:
Analyze and interpret qualitative geographic information represented in maps, images (e.g., satellite, photographic, cartoon), and landscapes.
Qualitative Sources: Data that is not usually represented by numbers. Often based on feeling (e.g. people’s opinion of the danger of an intersection).
Skill Category 5: Scale Analysis:
Analyze geographic theories, approaches, concepts, processes, and models across geographic scales to explain spatial relationships.
Scales of Analysis: The ability to zoom in or out of scale to develop a more complete picture and understanding of the topics being studied.
1.1 Introduction to Maps
Maps
A map is the most important tool that a geographer can use to help organize complex spatial information. No other tool communicates spatial information like this like a map.
Reference Maps
Reference Maps: Maps designed for people to refer to for general information about places.
Political maps show and label human created boundaries and designations like countries, states, and cities.
Physical maps show and label natural features like mountains, rivers, and deserts.
Road maps show and label highways, streets, and alleys.
Plat maps show and label property lines and details of land ownership.
Thematic Maps
Used to show data about specific topics. Four main types:
Choropleth Maps:
Use colors or patterns to show data like population density or climate.
Example: Darker areas might show higher population rates.
Dot Distribution Maps:
Use dots to show the location and amount of something (e.g., schools or COVID-19 cases).
Each dot represents a specific number of something.
Graduated Symbol Maps:
Use symbols of different sizes to show amounts.
Example: Bigger circles = larger population.
Isoline Maps:
Use lines to show equal data points, like elevation or temperature.
Commonly used for weather maps (e.g., topographic maps).
Cartograms
Resize areas on a map based on data, not physical size.
Example: A world population cartogram makes China and India huge, while smaller countries like Canada shrink.
Scale on Maps
Shows the relationship between map distances and real-life distances.
Words: Example - "1 inch = 10 miles."
Ratio: Example - "1:200,000" means 1 unit = 200,000 real-world units.
Graphic Scale: Uses a bar line to measure real distances.
Small-Scale Maps: Show large areas but with less detail (e.g., a map of the world).
Large-Scale Maps: Show smaller areas but with more detail (e.g., a city map).
The Global Grid (Latitude and Longitude)
Latitude: Horizontal lines, measure how far north or south a location is.
Equator = 0° latitude.
Longitude: Vertical lines, measure how far east or west a location is.
Prime Meridian = 0° longitude.
Absolute Location: Uses coordinates (latitude and longitude) to find an exact spot. Example: Mexico City is 19°N, 99°W.
Relative Location: Describes where something is in relation to something else. Example: Salt Lake City is "just south of the Great Salt Lake."
Spatial Patterns on Maps
Spatial patterns describe how things are arranged on Earth.
Location: Where things are.
Distance: How far apart things are.
Direction: Cardinal directions (north, south, east, west) or intermediate directions (northeast, southwest, etc.).
Elevation: How high or low a place is compared to sea level.
Distortion in Map Projections
Maps always distort something because Earth is a sphere. Different projections balance this distortion:
Mercator Projection: Good for navigation, but distorts size (Greenland looks massive).
Robinson Projection: Balances size and shape, good for general use.
Peters Projection: Correct land sizes but distorts shapes.
Distance and Elevation
Distance: Maps help measure the physical space between two points. For example, the map scale can show how far Mexico City is from Guadalajara.
Elevation: Refers to the height of a place compared to sea level. Maps with elevation data, like topographic maps, show where land is higher or lower.
Example: The mountains in the reference map of Mexico indicate areas of high elevation, which affects climate, travel, and human settlement.
1.2 Geographic Data
Essential Question:
What are different methods of geographical data collection?
Landscape Analysis
Definition:
"Landscape" refers to the condition of the land or a specific area.
Example: Desert landscapes or the landscape of Tuscany.
Landscape analysis is the process of defining and describing landscapes.
Observation and Interpretation:
Observation:
Geographers act as careful observers of phenomena.
Field observation: Physically visiting a location to gather data (e.g., photos, measurements, maps, and interviews).
Developments in Gathering Data:
Technology has improved how geospatial data is collected. Examples include:
Satellite imagery: Collects data from space.
Aerial photography: Pictures taken from planes or drones.
Ground-level photos: Capture detailed visuals.
Remote sensing is the use of cameras or sensors mounted on planes or satellites.
Interpreting Data:
After collecting data, geographers synthesize it to understand the area.
Goal: Make conclusions and interpret patterns.
Geospatial Data
Definition:
Geospatial data ties information to a specific place.
Includes:
Physical features (e.g., mountains, rivers).
Human activities and traits (e.g., poverty levels, language spoken).
Questions Geographers May Ask:
Who is moving into/out of an area?
What are the causes of movement?
How does movement affect the environment?
Sources of Quantitative Data:
Map: Shows life expectancy in different areas.
Graph: Displays trends (e.g., life expectancy changes over time).
Table: Compares numerical data between countries.
Infographic: Combines visuals and data for quick insights.
Obtaining Geospatial Data
Geographers collect data through:
Fieldwork: Observing and recording locations.
Census: Data from the population.
Interviews: First-hand accounts.
Technology: More accurate and efficient methods include surveys, photos, and land measurements.
Other Sources:
Government documents (e.g., treaties).
News articles.
Smartphone apps (e.g., location services suggest nearby activities).
Key Terms:
Field Observation: Collecting data in person.
Remote Sensing: Using cameras or sensors on planes/satellites to record data.
Aerial Photography: Photos taken from above the ground.
1.3 The Power of Geographic Data
Essential Question:
What are the effects of decisions made using geographical information?
Using Geographic Data to Solve Problems
Benefits:
Helps solve real-world problems like natural disasters or disease outbreaks.
Creates maps and visualizations to explain data (e.g., COVID-19 hot spots).
Examples:
COVID-19 Maps: Helped track infections and return students to classrooms safely.
Planning: GIS tools analyze data like transportation routes and pollution effects.
Challenges:
Data has limitations (e.g., incomplete data sets).
Misinterpretation of maps can cause poor decisions.
Geospatial Technologies
Solutions in Action
Example:
Nuba Mountains, Sudan:
Conflict led to a lack of water access and infrastructure.
Researchers used geospatial tools and worked with NGOs to improve the community’s water supply.
Community-Based Solutions:
Engage locals to ensure success.
Work with organizations like Nuba Water Project to address needs.
Key Terms:
Geovisualizations: Interactive maps that help people understand data.
Global Positioning Systems (GPS): Technology for location tracking.
Remote Sensing: Collecting data from the Earth’s surface using satellites or aircraft.
Chapter 2: Spatial Concepts and Geographic Analysis
Topics 1.4 to 1.7:
Topic 1.4: Spatial Concepts
Learning Objective: Define the major geographic concepts that illustrate spatial relationships. (PSO-1A)
Topic 1.5: Human-Environmental Interaction
Learning Objective: Explain how major geographic concepts illustrate spatial relationships. (PSO-1B)
Topic 1.6: Scales of Analysis
Learning Objective: Define scales of analysis used by geographers. (PSO-1C)
Explain: What scales of analysis reveal. (PSO-1D)
Topic 1.7: Regional Analysis
Learning Objective: Define different ways that geographers define regions. (SPS-1A)
1.4 Spatial Concepts
Essential Question: What are the major geographic concepts that illustrate spatial relationships and patterns?
Spatial Approach:
Focuses on the arrangement of phenomena across the surface of the Earth.
Considers movements of people, changes over time, and perceptions of space/place.
Four-Level Analysis: A method to analyze spatial distributions by asking:
Why are things where they are?
How did things become distributed this way?
What is changing the pattern of distribution?
What are the implications of the spatial distribution for people?
Major Geographic Spatial Concepts:
Location:
Identifies where phenomena are on a grid system or relative to another location.
Concepts:
Absolute Location: Exact coordinates.
Relative Location: Position relative to surroundings.
Location influences:
Connections
Accessibility
Place:
Refers to specific human and physical characteristics.
Characteristics include:
Immediate factors (soil type, climate).
Broader surroundings (connectivity).
Sense of Place:
Perception of a place based on personal experience or cultural beliefs.
Placelessness:
Places without unique characteristics.
Toponyms:
Place names that provide insights into:
Physical geography
Historical events
Cultural identity
Controversial changes in naming (e.g., Denali vs. Mount McKinley).
Distance and Time:
Distance can be:
Absolute: Measured in miles/kilometers.
Relative: Measured in time or connectivity.
Time-Space Compression: Shrinking of "distance" due to advances in communication and transportation.
Friction of Distance:
Concept that distance weakens connections (distance decay).
Reduced by technological improvements.
Patterns and Distribution:
Refers to spatial arrangement of phenomena.
Patterns can be linear, circular, dispersed, etc.
Spatial Association:
Relationship between distributions of two phenomena.
1.5 Human-Environmental Interaction
Natural Resources:
Materials valued by humans.
Renewable Resources:
Unlimited (e.g., wind, solar energy).
Nonrenewable Resources:
Limited (e.g., oil, coal).
Sustainability:
Practices to ensure resource availability for future generations.
Land Use:
How humans utilize the environment (agriculture, industry).
Interaction Themes:
Environmental determinism vs. Possibilism.
Impact of humans on natural landscapes.
Analysis of Human Responses To:
Hazards
Climate change
Resource scarcity
Natural Resources:
Renewable Natural Resources:Air (wind power)
Water (surface water, hydroelectric)
Solar (sun’s energy)
Biomass (organic material like wood, crops, and sewage)
Non-Renewable Natural Resources:
Fossil fuels (petroleum, natural gas, coal)
Earth minerals (gold, copper, silver)
Underground fresh water (from deep aquifers)
Soil
Sustainability:
Focuses on using resources responsibly to ensure their availability for future generations.
Sustainable development aims to address:
Resource depletion
Pollution
Climate change impacts
Example: Policies promoting renewable energy use while reducing fossil fuel consumption.
Land Use:
Examines how people use, modify, and organize land.
Geographers study patterns and impacts of land use on:
Environment
Landscapes
Societies
Natural Environment: Includes plants, air, water, and animals.
Built Environment: Human-made artifacts like buildings, roads, and farms.
Reflects cultural and physical landscapes.
Examples: Varying architectural styles in China vs. Germany.
Cultural Landscape: Combination of natural and built environments shaped by human activity.
Human-Environmental Interaction:
Natural Resources: Items from the environment useful to people (e.g., air, water, minerals).
Renewable Natural Resources: Unlimited or replenishable (e.g., wind power, solar energy).
Non-Renewable Natural Resources: Finite and exhaustible (e.g., fossil fuels, minerals).
Sustainability: Using resources to meet current needs while preserving availability for the future.
Land Use:
Includes agriculture, industry, and urbanization.
Reflects cultural and environmental factors.
Theories of Human-Environmental Interaction:
Environmental Determinism: Argues environment shapes societies (discredited for overemphasis).
Possibilism: Emphasizes human creativity and cultural influence over environmental limitations.
Example: The Netherlands and its water management systems.
Key Terms
Spatial Approach: Focuses on spatial patterns and relationships.
Space: Area between two phenomena.
Location: Absolute or relative.
Place: Human and physical characteristics of an area.
Region: Defined areas with shared characteristics.
Site/Situation: Physical characteristics of a location (site) and its surroundings (situation).
Sense of Place: Personal or cultural meaning of a location.
Toponyms: Place names.
Distance Decay: Connection weakens with distance.
Time-Space Compression: Distance "shrinks" with technology.
Flow: Movement of people, goods, and ideas.
Patterns/Distribution: Spatial arrangement of phenomena.
Spatial Association: Linked distributions of phenomena.
1.6 Scales of Analysis
Essential Question: What are scales of analysis and what do they reveal to geographers?
Geographic/Relative Scale: The area of the world being studied
Zooming in and out of maps that use different scales.
Aggregation: When geographers organize data into different scales.
Allows data to be more easily mapped or organized in a chart or graph
1.7 Regional Analysis
Essential Question: What are ways geographers define regions.
Regions: An area with boundaries, unifying characteristics, and are created by people
Formal/Uniform/Homogeneous Regions are united by many traits
Political, like the USA
Physical, such as the Sahara
Cultural, such as southwestern Nigeria, an area where the Yoruba language is spoken
Economic, such as the Gold Coast of Africa (Ghana), which exports gold
Functional Regions are organized around a focal point
Pizza delivery areas; the pizza shop is the node
A state or a country with the capital city as the node
An airport is a node, the locations the flights connect form a functional region
A functional region must include a flow of some phenomenon across the networks that unite the region.
Perceptual/Vernacular Regions are defined by the informal sense people ascribe to them
The South
Upstate New York
The Middle East
AP Human Geography Ten Large Regions
North America
South America
Europe
Africa
Asia
Oceania
Central Asia
Middle East
Southeast Asia
Caribbean
World Subregions
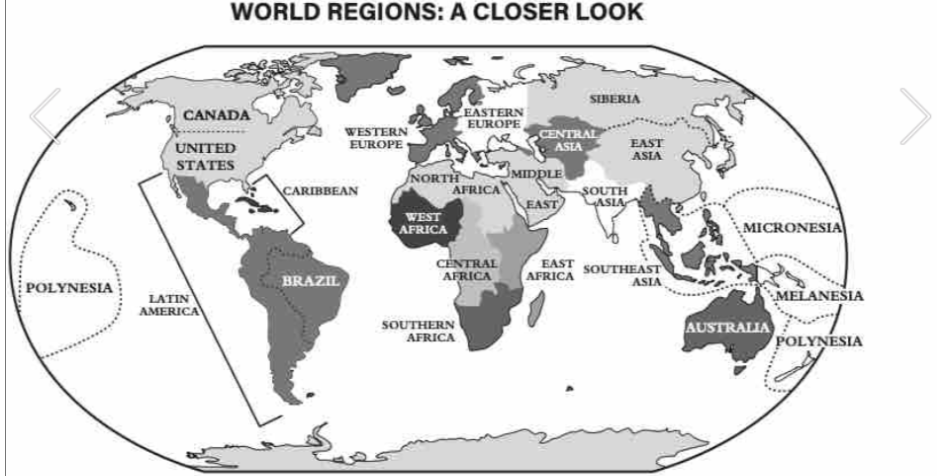
Terms: