Unit 2 Measures of Economic Performance 💰
Topic 2.1 Circular Flow of Economic Activity
A basic or expanded circular flow model illustrates the flows of money, goods and services, and factors of production through the economy.
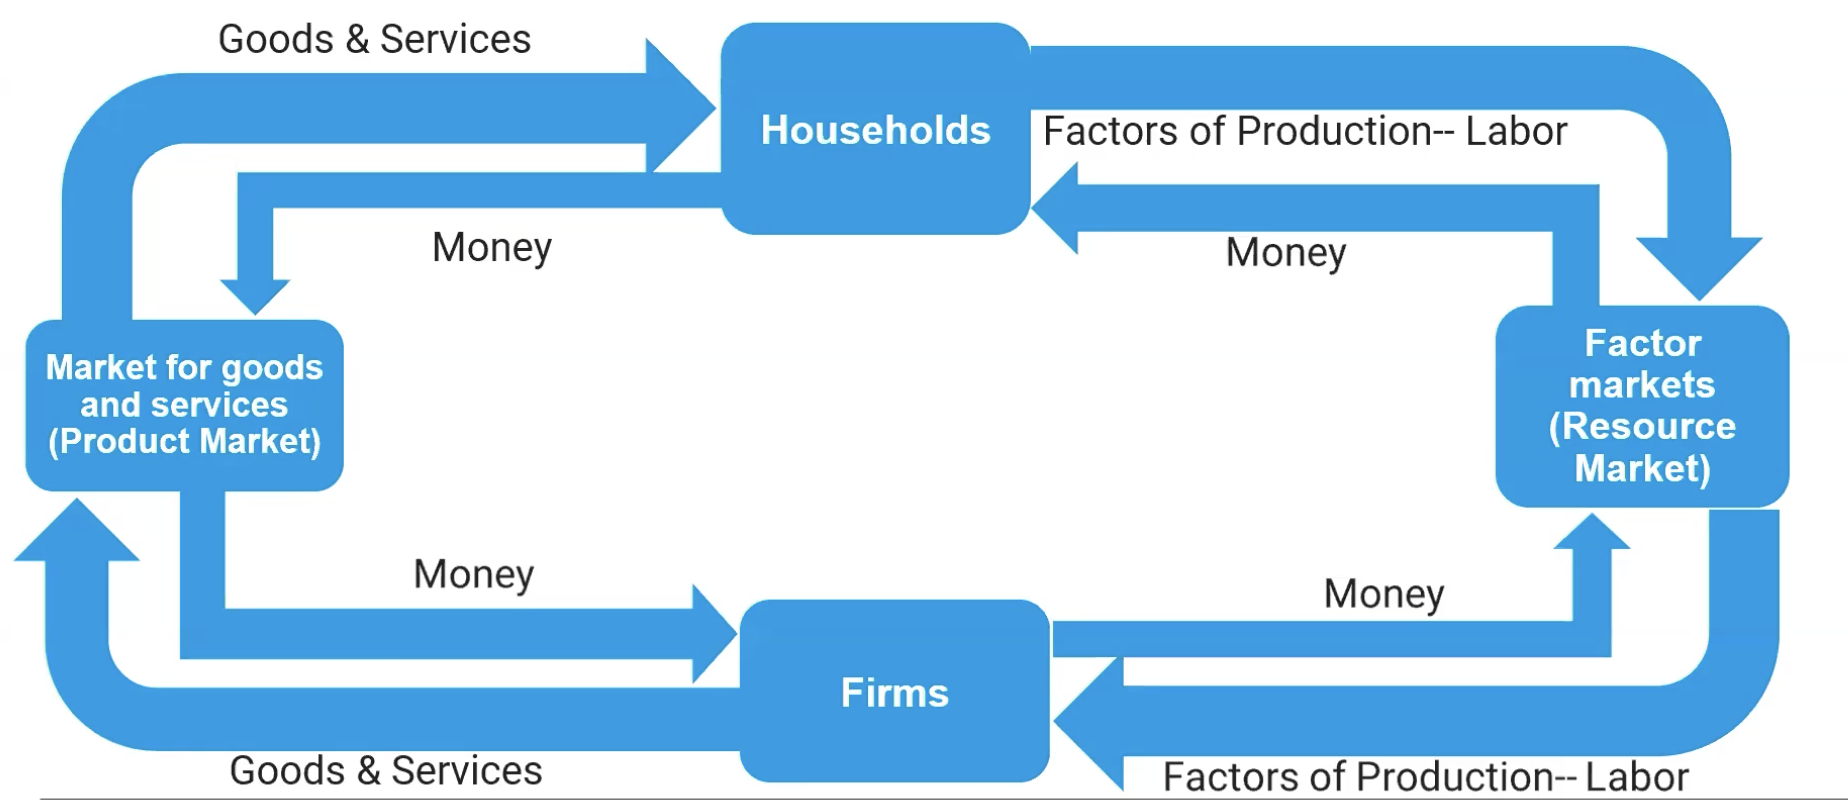
The basic circular flow model starts with the two basic entities within an economy- households and firms. These entities interact with each other through the product market, also known as the market for goods and services, and the resource market, also known as the factor market, where the factors of production flow through.
A household is an income earner or several income earners that share pool their incomes. Consumers, people living in households, demand finished goods and services in the product market.
A firm is a business. An example of a business can be a large corporation such as Target or a small shop such as an ice cream shop in a beach town. Firms demand in the factor market because they need resources like labor and capital to produce goods and services.
This is how the basic circular flow model works:
Individuals in households provide their factors of production, which is generally labor to firms. l work for a firm and the firm pays me wages, money you earn from labor.
Firms are also producers where they produce goods and services in a household. They will work through a product market to buy these goods and services. When you buy these goods and services, you will pay money to the firm.
In the basic model of the circular flow in the economy, we will just focus on how money flows. There are other factors that influence the circular flow model of the economy such as the flow of goods and services plus products.
This is the simple circular flow model:
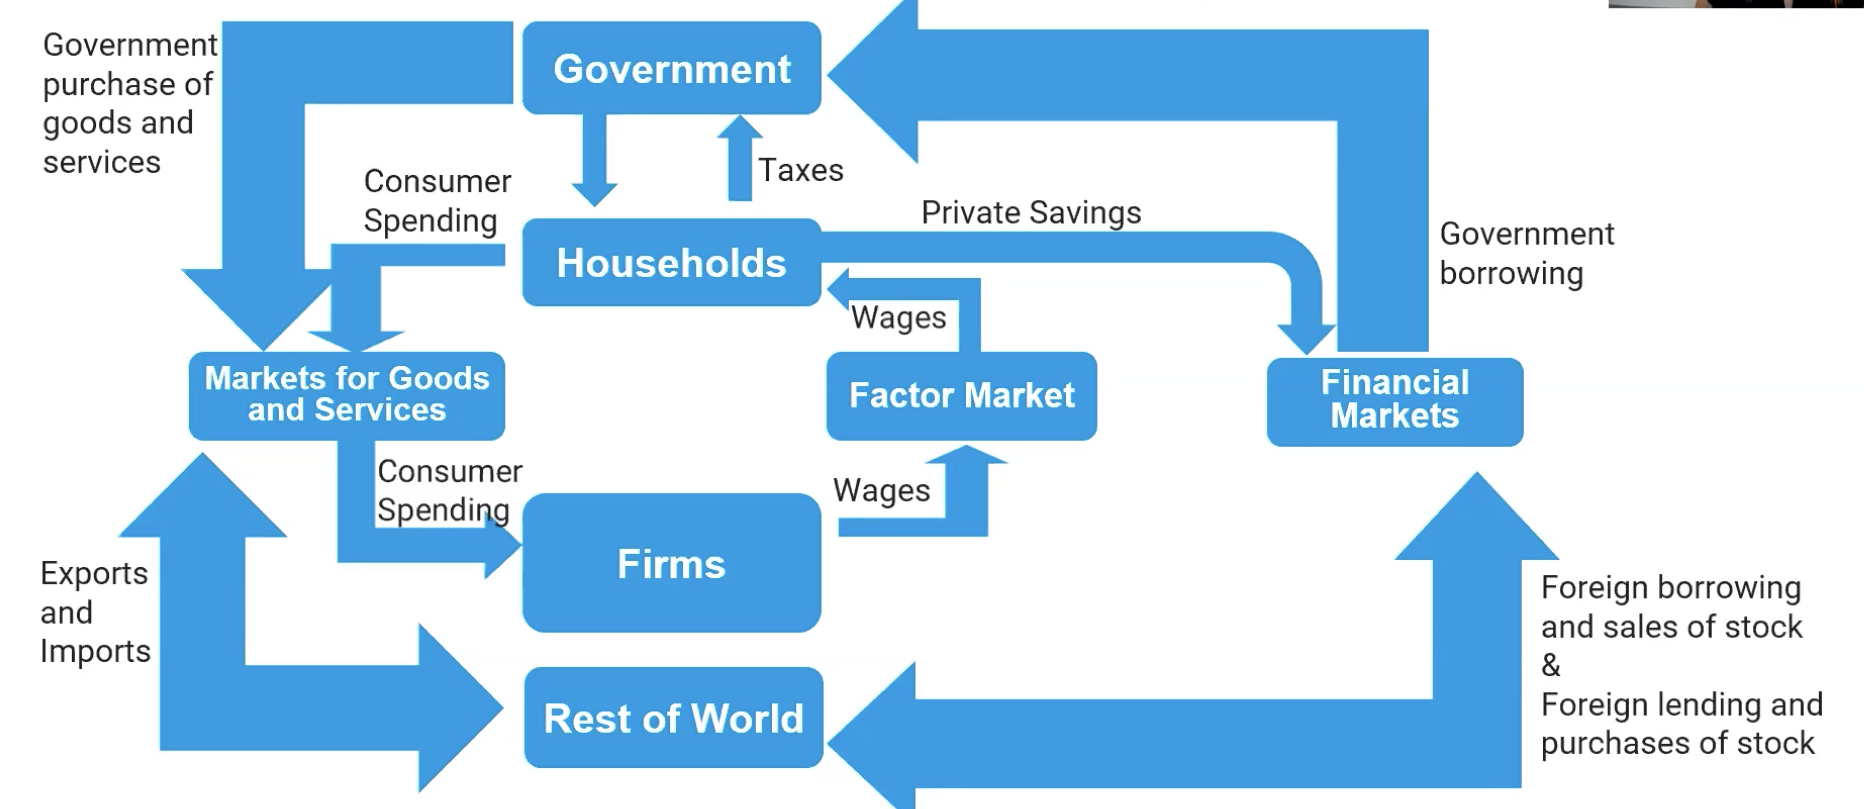
This is how the expanded circular flow model works:
You have the government, rest of the world, and the financial markets. First, the government will interact with households.
Households and firms pay taxes to the government.
The government will leak money into households
The government flows money into households through transfer payments.
The rest of the world interacts with the model by the government purchasing goods and services, and also through imports and exports.
The government buys all sorts of goods and services.
The rest of the world buys imports and sells exports.
The financial markets and the government interact because the government does a lot of borrowing.
Households interact with the financial market because we borrow and flow money into financial markets, known as savings.
The rest of the world interacts with our financial markets as well, through borrowing and the sales of stocks and bonds.
Households provide labor to firms in exchange for wages, which they then spend on goods and services.
Firms produce goods and services using the resources obtained from households and other sectors, contributing to overall economic activity.
Financial institutions facilitate transactions by providing loans to households and firms, enabling further investment and spending.
Government spending plays a crucial role by injecting money into the economy through public services and infrastructure projects.
Of course, firms interact with financial markets. They borrow to invest and also using stock and bond purchases, as well as sales.
Economists keep track of the flows of money between sectors, how much households are spending, and how much firms are spending.
This is how the expanded model works:
Topic 2.2 GDP
The gross domestic product (GDP) is the total market value of final goods and services provided by a country within 1 year.
The purpose of GDP is to get a total count of production within an economy.
We are looking at the value of all production within an economy whether it is a good or service.
When and where a good is produced matters. If a good is produced in India, then that good counts for Indian GDP and not for any other country’s GDP.
A final good ais a good that is done with production and is ready to be purchased such as a diamond ring or a cupcake.
An intermediate good is a good that makes up another good such as diamonds or sprinkles.
The final value of the ketchup is the bottle not the ingredients that make up ketchup.
GDP can indicate the health of an economy. If GDP is increasing, then the economy is healthy.
Used products, financial transactions, services provided for no money do not count in GDP.
The three ways to measure GDP is the value of production of final goods and services, factor income earned by households from firms in the economy, and value of spending on domestically produced final goods and services (the aggregate/expenditure spending model). We are study the aggregate/expenditure spending model.
The formula for the expenditure model is GDP= C+I +G+Xn. C is consumption spending. I is investment spending. G is governemnt spending. Xn is net exports (exports-imports).
GDP does not equal higher standards of living or prosperity. GDP measure aggregate output but it does not include non market transactions that contribute to quality of life such as leisure time, volunteerism, housework, natural beauty. These things do not provide value to GDP.
GDP is a useful indicator of economic performance but it has some limitations. It fails to account for non-market transactions and it doesn't fully address the standards of living such as quality of life,education, sustainability, health, etc.
Topic 2.3 Employment, Unemployment, Labor Force
People who are employed hold a full time/part time job in the economy.
People who are unemployed are not currently working in a job but are actively looking for a job.
The labor force is the sum of people who are currently working a job or actively searching for a job. Basically, you have to be employed or unemployed.
The labor force participation rate is the percentage of the population, aged 16 or older, that is in the labor force.
This is the labor force participation rate formula: (Labor Force/Population Age 16 or Older)(100).
Prisoners, people in mental institutions, and military personnel are not counted in the labor force participation rate because they’re considered institutionalized or on active duty.
The unemployment rate is the number of unemployed people in an economy’s labor force.
This is the unemployment rate formula: (Number of Unemployed People/Labor Force)(100).
An economy’s performance can be measured by different indicators such as unemployment rate.
People who are not counted in the labor force and the unemployment rate are discouraged workers, marginally attached workers, and underemployed workers.
Discouraged workers are nonworking people who are capable of working, but have given up looking for a job due to the state of the job market after at least a month.
Marginally attached workers are nonworking people who have looked for jobs in the recent past but have not recently due to other factors such as school or taking care of family.
Underemployed workers are workers who do not get paid enough for the work that uses 100% of their skills.
People who are frictionally employed are workers that are unemployed due to the time they spend searching for a job. College graduates are an example of frictionally unemployed workers and people who leave their old jobs for better jobs are examples of frictionally employed workers.
People who are structurally unemployed are workers whose skills have become obsolete/outdated in this economy. They need to be retrained to get back into the labor force. Also, structural employment occurs when there are more people searching jobs in a labor market than there are jobs available at the current wage rate.
People who are cyclically unemployed are laid off when there's a recession. Cyclical unemployment follows the business cycle. People return to their jobs after the recession usually.
Topic 2.4 Consumer Price Index (CPI)
The Consumer Price Index (CPI) is the measure of average change over time in the prices paid by consumers in a FIXED “market basket“ of goods and services.
The CPI is one example of a price index that is used to calculate the inflation rate. It is also the way to evaluate the purchasing power of a household.
CPI and inflation rate are positively related. When the CPI rises, an inflation occurs. Inflations are periods in the economy where the prices are rising. An inflation weakens the purchasing power of a household. When CPI decreases, a deflation occurs. Deflations are periods in an economy where the prices are decreasing. A deflation strengthens the purchasing power of a household.
Essentially the market basket is the category of goods and services bought by consumers. Recreation, medical care, education, communication, food and beverages, housing, transportation, and apparel are categories in the “market basket” of goods and services.
The market basket is fixed, so we can figure out what is happening to the prices. Quantity is irrelevant in the CPI.
To calculate the rate of inflation, using CPI, we first calculate the market basket value. In order to calculate the market basket value, we first determine what is the base year and what is the current year. The year that occurs first is of course the base year and the other year is the current year. Then, you multiply the base year quantity and the base year price for each good and adding all the prices together. For example, 1997 is the base year and 1998 is the current year, and we are finding the market basket value for the base year:(Quantity^1997 Price^1997)^Good 1 +(Quantity^1997 Price^1997)^Good 2.
However, for the current year, you ignore the quantity for the current year and only focus on the prices in the current year and multiply it with the base year quantity (Quantity^1997 *Price^1998)^Good 1 + (Quantity^1997 *Price^1998)^Good 2 .
To get the CPI you put the value of the market basket of the current year over the value of the market basket in the base year and multiply it by a 100. The base year CPI is always 100. Basically CPI=Nominal CPI/Base Year CPI.
Finally, you use the rate of change formula to determine the inflation rate using the base year CPI and current year CPI. The rate of change formula is (new-old/old)(100) or (new CPI - old CPI/ old CPI)(100).
Economists use the term nominal to refer to values that have not been adjusted for inflation.
Nominal income is the amount of money a worker earns in the form of wages or salary.
Nominal GDP is the value of an economy’s output in current dollars.
Nominal interest rate is the stated interest rate.
Economists use the term real to refer to values that have been adjusted for inflation. Real income is the purchasing power of a given wage or salary.
Real GDP is the value of an economy's output in inflation adjusted dollars. Real interest rate refers to the inflation adjusted cost of borrowed money.
To deflate a nominal value, you use a price index where you divide the nominal value by the price index/100. Basically, real value=nominal value/(price index/100).
The substitute bias refers to the fact that the market basket is only updated every few years. The market basket does not change to reflect consumer reaction to changes in relative prices. As the price of a good or service rises, the people stray away from the expensive good and gravitate towards the less expensive good. If consumers are not buying the expensive good, then they are not losing as much purchasing power as the CPI would suggest
The market basket does not reflect the change in purchasing power when new goods are introduced. Purchasing power is greater for some goods. The market basket does not reflect unmeasured quality changes because of manufacturing reasons or availability of raw materials. If you pay $10 every time you buy a good, and if this year the quality is higher, the $10 now has more purchasing power than last year.
The prices of some goods in the CPI vary much more dramatically in comparison to other goods.
Many government programs use the CPI to adjust for changes in the overall levels of prices. These are called cost of living adjustments (COLA).
The CPI may overstate the inflation rate because of a variety of shortcomings.
Topic 2.5 Costs of Inflation
An inflation is an increase in prices. Inflations result in a decrease in the purchasing power of a nominal sum of money.
A deflation is a decrease in prices. Deflations result in an increase in the purchasing power of a nominal sum of money.
People build expectations of future prices into their decision making. When they enter into a contract or agreement that goes on for a long time, they build a sense of what they would expect to happen in terms of the real value of the payments that they are receiving or making.
The more price stability there is, the more confidently people enter into those agreements. When there is a decrease in price stability and people’s expectations for inflation are unmet, it results in hesitancy and a lot of economic decision making. This can lead to reduced levels of investment, as businesses may postpone expansion plans due to uncertainty about future costs and revenues.
People who enter into variable interest rate loans are protected from unexpected inflation. However, people who enter into fixed interest rate loans suffer. This is because their payments remain constant while the actual value of those payments may decrease, leading to a potential loss in purchasing power over time.
When inflation is higher than expected, the purchasing power of a given amount of money to be received is lower than expected. This leads to a decrease in consumer spending, as individuals find that their money does not stretch as far as they anticipated, ultimately slowing down economic growth. This can create a cycle where businesses also reduce investment due to uncertainty, further exacerbating the economic slowdown and potentially leading to higher unemployment rates.
The beneficiaries of unexpected inflation are borrowers, people who are paying a fixed amount of money (borrowers benefit when there is an unexpected inflation).
The losers of unexpected inflation are lenders, people who receive a fixed amount of money (lenders lose when there is an unexpected inflation). Other losers of unexpected inflation include people on fixed incomes, social security recipients, worker who are subject to multi-year wage agreements.
When people enter into wage contracts, they do so based on what the inflation rate is going to be. When the inflation rate is higher than expected, then the real value of those wages that they’ve negotiated is going to be lower than expected.
The real value is the nominal value divided by the price index over a 100- real value= nominal value/price index/100 (price index over a 100 is a fraction).
Topic 2.6 Real vs Nominal GDP
The nominal GDP is equal to price level times real GDP- PL*Y. It is a measure of how much is spent on output in a given period. Nominal GDP is not adjusted for inflation. The value of aggregate output (Q) in given dollars (P).
Current Year Price*Current Year Quantity for all goods and services in nominal GDP.
The GDP Deflator measures the changes in prices for all goods and services produced in an economy in a given period, which tells us the aggregate price level. It can be used to convert nominal GDP to real GDP using the formula: GDP Deflator = (Nominal GDP/Real GDP)(100)
The real GDP is the value of aggregate output in constant dollars.
Base Year Price*Current Year Quantity in real GDP.
The GDP Deflator is a price index that measures the changes in prices of goods and services produced in a nation within a given time period, which tells us the aggregate price level.
The GDP Deflator can also be used to calculate the inflation rate using the formula (Current Year GDP Deflator - Old GDP Deflator/Old GDP Deflator)(100).
There is a key difference between cpi and the GDP Deflator.
The CPI is used to calculate the change in purchasing power, based on a fixed market basket of changing prices. Quantity is held constant and prices change in context of CPI.
The GDP Deflator is used to determine how much output has changed over time. Prices are held constant and quantity change in context of the GDP Deflator.
Topic 2.7 The Business Cycle
The business cycle model can be represented graphically.
The amount of goods and services produced is called output, which is measured on the y-axis. We could be looking at real GDP, real GDP per capita, nominal GDP, or growth rates on the y-axis.
Time is measured in quarters (3-month periods) or in years.
In reality, output tends to increase and decrease over time at varying rates.
In an expansionary phase, economic output and employment is increasing.
In a recessionary phase, economic output and employment is decreasing.
Turning points of the business cycles are found when economic output goes from increasing to decreasing, called peaks, and from decreasing to increasing, called troughs.
The difference between actual output and full-employment output is the output gap.