Human Geography Unit 1 ✅
1.1 What is Human Geography?
Spatial perspective: where something occurs - where things are located and why are they located there.
Ecological perspective: relationships between living things and their environments. This perspective helps explain human societies' dependence on diverse ecosystems for essential resources such as food and water.
Location and place
location: positions that a point or object occupies on earth.
Absolute location: exact location of object → expressed in coordinates
Relative location: description of where place is in relation to other places or features
Place: location on earth that is distinguished by its physical and human characteristics → climate, landforms, soils, water sources, vegetation…
“Sense of place” emotions attached to an area based on personal experiences.
Mental maps: person’s internal representation of the world around them, shaped by their perceptions, experiences, and knowledge
Site: place’s absolute location, as well as physical characteristics → landforms, climate, resources
Situation: which refers to a place's location in relation t o other places or its surrounding features. Situation describes a place's connections to other places, such as transportation routes
Space, Pattern, and Flow
Space: area between two or more things on earth’s surface
Density: Number of things → people, animals, objects.
Manila, the capital city of the Philippines, has over 171,000 people per square mile. A rural area like the province of Davao del Sur, on the other hand, has about 850 people per square mile.
Human - Environment interaction → Theories of interaction
Environmental determinism: argues that human behavior is largely controlled by physical environment. According to the theory, a region's climate and soil fertility dictate how a society develops as it adapts to the environment.
weakness: it argued that the environment most suited to human development is that of western Europe and North America.
Possibilism: a theory that argues that humans have more agency, or ability to produce a result, than environmental determinism would suggest. According to possibilism, individuals are active, not passive, agents. The environments in which they live offer individuals opportunities and challenges.
Sustainability: the use of Earth's land and natural resources in ways that ensure they will continue to be available in the future.
Models
Distance decay: principle states that the farther away one thing is from another the less interaction the two things will have → Waldo Tobler the closer things are to one another, the more they are related
Time-space compression: describes the processes causing the relative distance between places to shrink. Modern transportation has greatly reduced travel times, and the internet and other forms of communication have made it easier to communicate with people anywhere on the planet and to send money around the world through online banking
Case study→ New Orleans - Site vs. Situation
In the early 18th century, French colonists chose New Orleans as the capital of Louisiana, despite its less-than-ideal location. Situated on a bend in the Mississippi River, near the Gulf of Mexico and Lake Pontchartrain, the city is prone to flooding and storms. However, its strategic location made it a valuable port, connected to much of the continent’s commerce. To manage the flooding risks, early residents built levees and drained wetlands, allowing the city to expand. By the mid-2000s, around 50% of New Orleans lay below sea level, relying on levees for protection.
In 2005, Hurricane Katrina exposed the vulnerabilities of these levees. The storm’s heavy rain and storm surge overwhelmed the levees, flooding 80% of the city. While over a million people evacuated, tens of thousands remained, leading to severe public health crises. By September 6, the city was nearly empty, but it eventually began rebuilding, with some displaced residents returning.
1.2 Spatial Patterns: scale and region
Scale: area of the world being studied
Region: an area of Earth's surface with certain characteristics that make it distinct from other areas. The boundaries between regions are typically not clearly defined and are often transitional, overlapping,
and contested.
Formal region: also called a uniform region or homogeneous region. an area that has one or more shared traits. It i s also referred to as a uniform region → The shared trait can be physical, such as a landform like a mountain range or a climate area like a
The corn belt, an area of the Midwest United States where corn and soybeans are the dominant crops, is a formal economic and agricultural region.
Functional region: an area organized by its function around a focal point, or the center of an interest or activity. The focal point of a functional region is called a node.
Nodes serve a particular function - often a political, social, or economic purpose-and have internal connections that tie the region together.
Suburbs: the residential areas surrounding a city
Perceptual region/Vernacular region: a type of region that reflects people's feelings and attitudes about a place. their subjective understanding of the world as influenced by their culture and experience.
Case study → India-regional differences in scale
India has experienced significant economic growth since the early 21st century, with its GDP increasing by 474% between 2000 and 2017. However, this wealth is not evenly distributed across the country. Richer states like Maharashtra, Kerala, and Tamil Nadu have seen greater prosperity, while poorer regions lag behind. The economic divide is also evident within states, with cities like Mumbai and Delhi becoming financial and commercial hubs, while rural areas remain underdeveloped. Although poverty has declined overall, wealth inequality remains a major issue, with 10% of the population holding 77% of the national wealth. Corruption and a lack of political reforms exacerbate the problem, leading to growing discontent and protests among the less privileged.
1.3 Globalization and Sustainability
Globalization expanded many companies’ reach outside of the borders of their home country.
→ Social media apps allow people to share their views instantaneously, becoming instrumental in the spread of political movements such a s the Arab Spring, a series of pro-democracy protests that took place in Southwest Asia (also referred to as the Middle East) and North Africa in 2011.
→ Beginning in 1994, for instance, the North American Free Trade Agreement (NAFTA) allowed companies in the United States, Canada, and Mexico to sell goods and hire workers in any of the three countries.
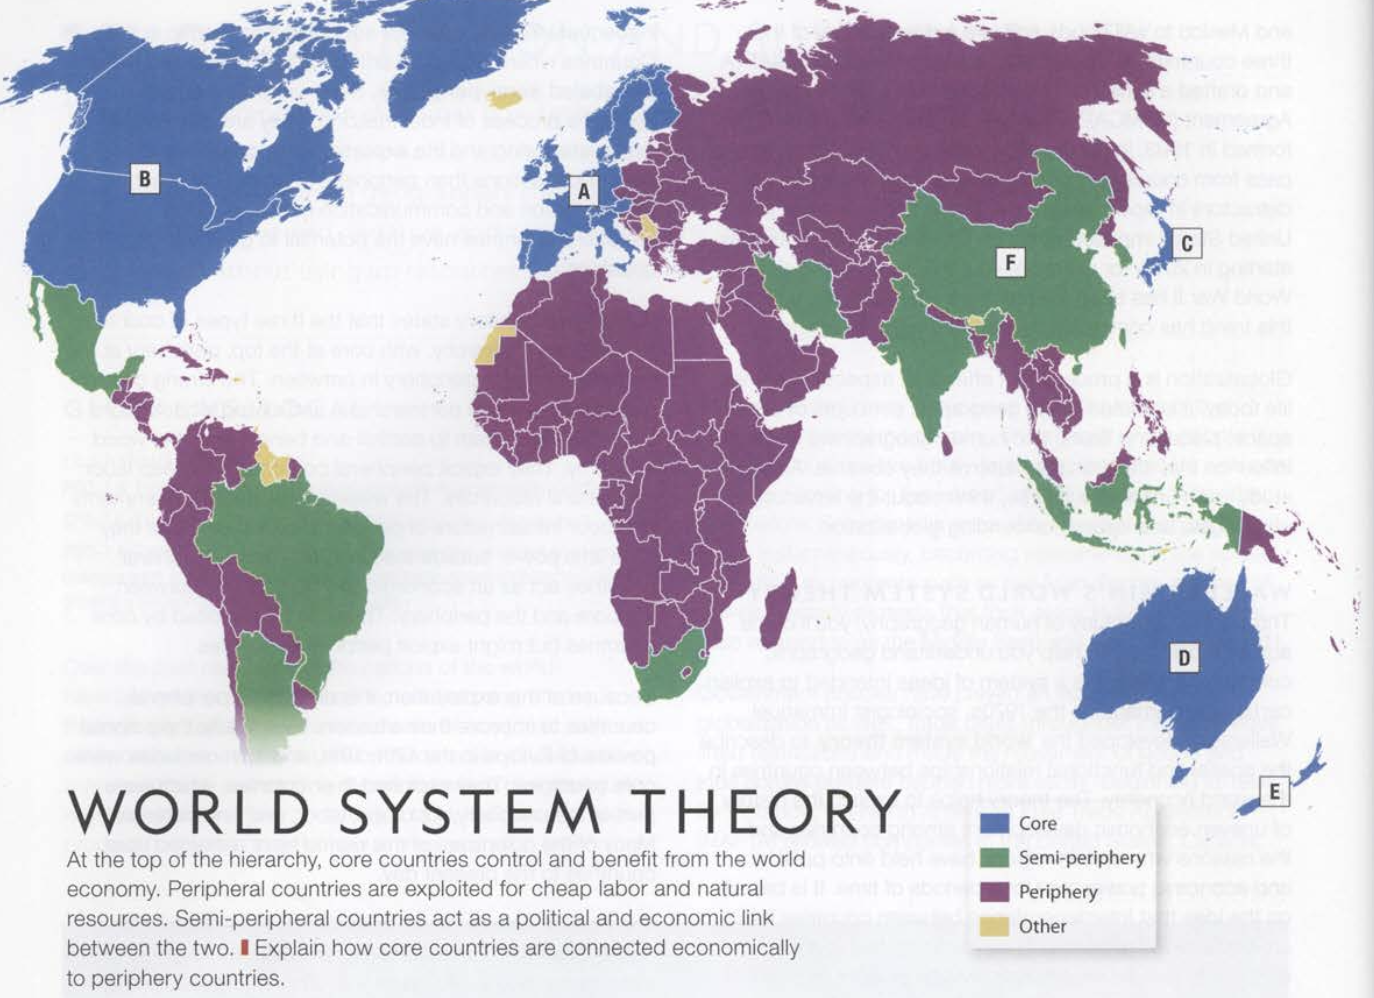
Wallerstein’s world system theory
Immanuel Wallerstein developed the world system theory describe the spatial and functional relationships between countries in the world economy.
theory helps to explain the history of uneven economic development among countries and the reasons why certain regions have held onto political and economic power over long periods of time.
The theory argues that the world is divided into three interconnected regions with a hierarchy of power and economic development:
1. Core Countries
highly interconnected with good transportation and communication networks. they have stable government and strong political alliances.
Highly developed, industrialized nations (e.g., the US, Germany, Japan).
Control global trade and capital.
Produce high-tech goods and services.
Exploit resources and labor from less developed regions.
2. Semi-Periphery Countries
are in process of industrialization, often active in exporting.
Emerging economies (e.g., China, Brazil, Mexico).
Have a mix of industrialization and dependency on core nations.
Act as intermediaries between core and periphery countries.
Can exploit periphery nations while being exploited by core nations.
3. Periphery Countries
lower education, less stable government, poorer services such as healthcare
Least developed nations (e.g., many African and South Asian countries).
Provide raw materials, cheap labor, and agricultural products.
Suffer from economic dependency and political instability.
Exploited by both core and semi-periphery nation
core countries exploit peripheral countries for cheap labor and natural resources.
Semi-peripheral countries act as an economic and political link between two classes. They can be exploited by core countries but might exploit peripheral countries Because of this exploitation, it is difficult for peripheral countries to improve their situation.
Sustainable development: Growth that doesn’t deplete resources or harm future development. Ensuring equal access to resources, healthcare, education, and human rights.
Heimler’s Unit 1 guide
Reference maps: shows specific Geographic Locations → Topography maps shows mountains and valleys, political maps shows boundaries.
Themaic maps: to display geographic information. Thematic maps are maps focused on a particular topic or theme. For example, a map showing early human migrations out of Africa and their rate of dispersion to other parts of the world can be shown on a thematic map.
→ Choropleth map: visualizes data with different colors - elections
→ Dot distribution map: uses dots to visualize the location of certain data points: into one-to-one data one dot equals one unit of data but in the one-to-many one dot represents a group.
→ Graduated symbol map: uses symbols visualize data
→ Isoline map: uses lines to depict data: lines that are closer together indicate rapid change in data and that are further apart indicate smaller changes
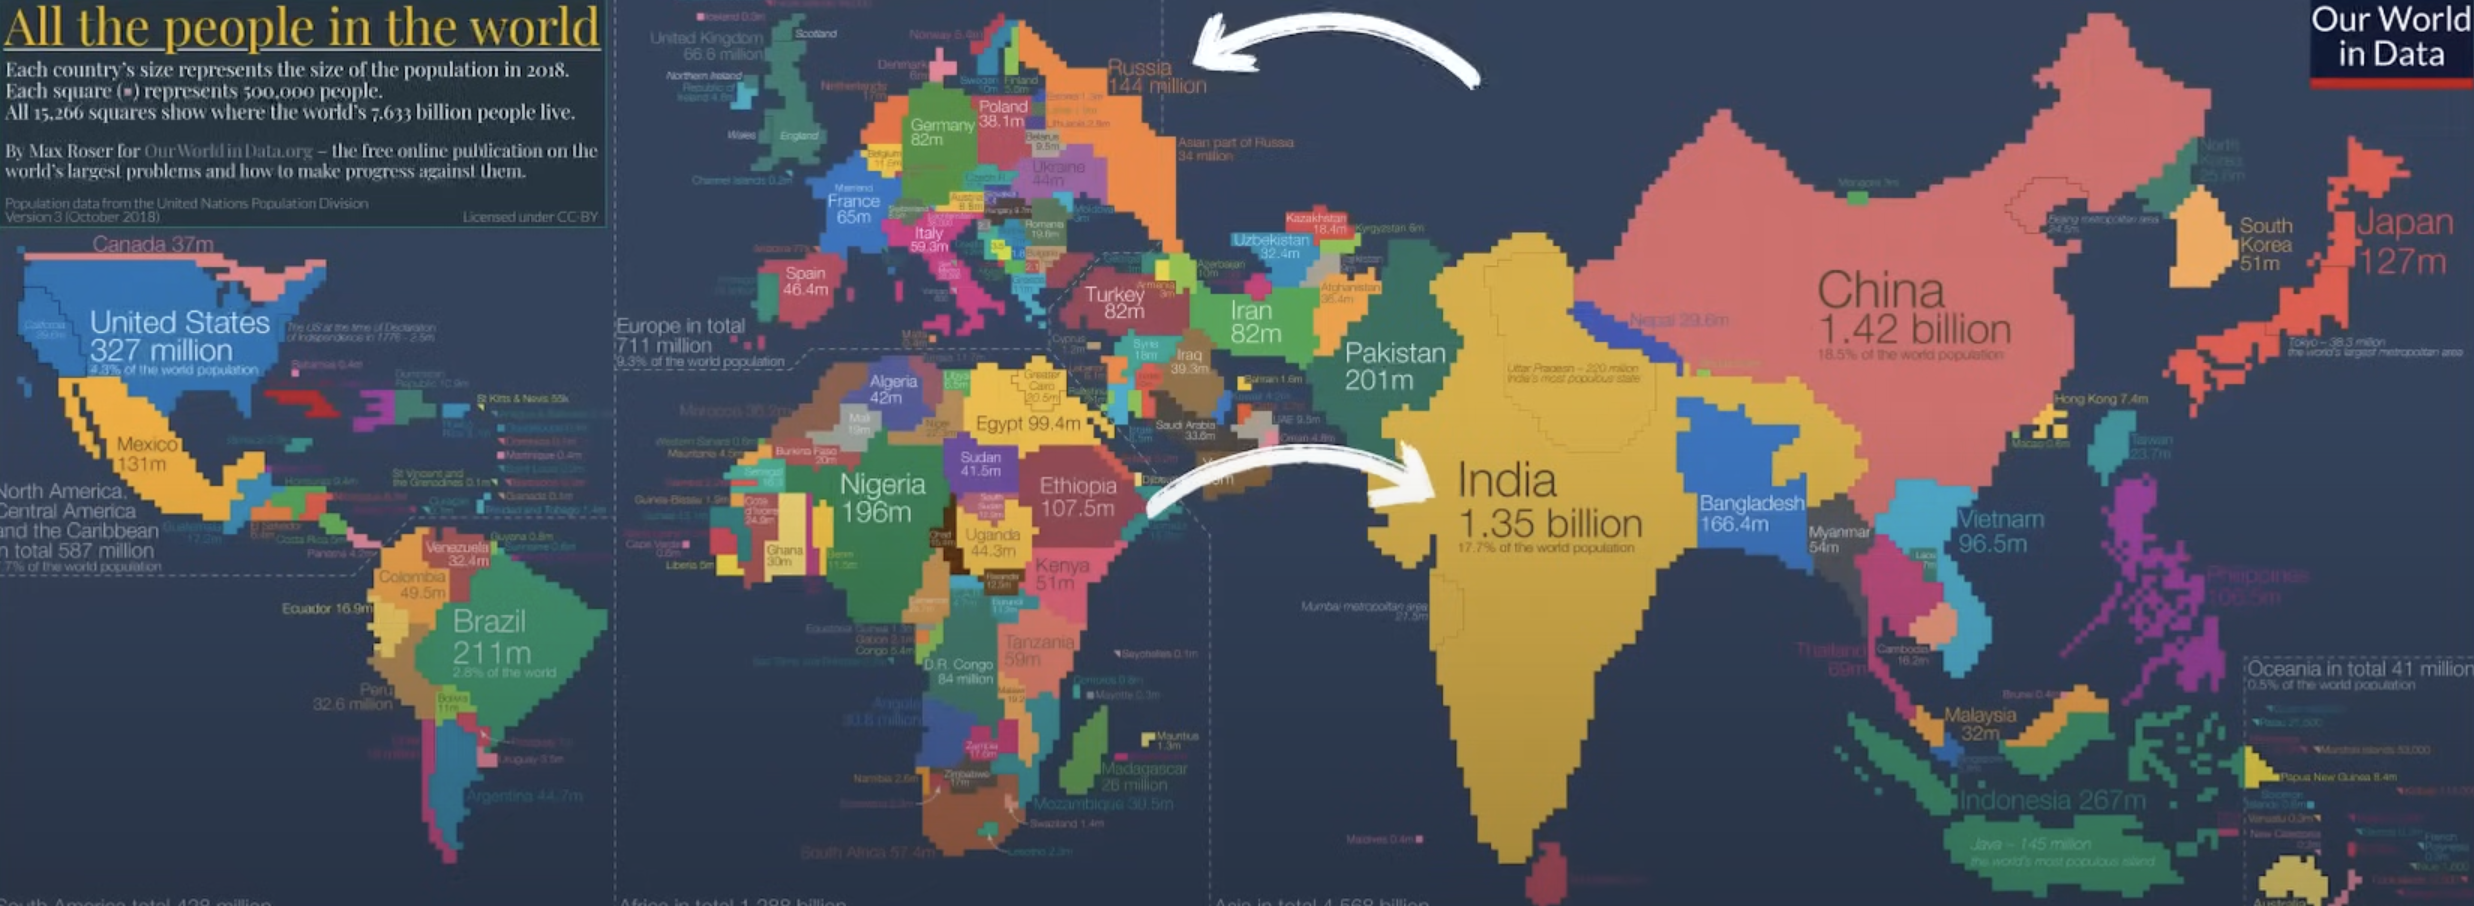
→ Cartogram: distorts the size of the geographic shapes to display differences in data
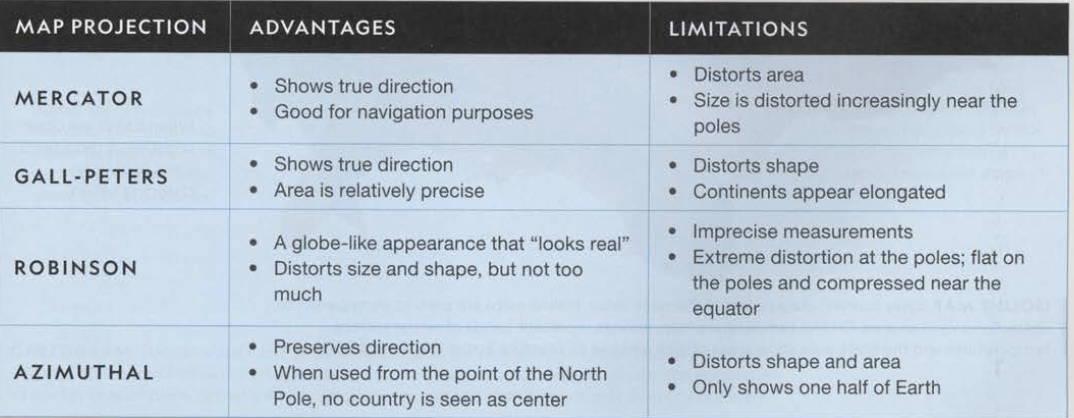
Map projectors
Mercator projection:The Mercator projection is a type of world map that stretches the globe onto a flat surface. It was created in 1569 by Gerardus Mercator to help sailors navigate the seas.
It keeps directions accurate. If you draw a straight line between two points, a ship can follow that exact path using a compass.
It preserves shapes of countries and continents, meaning coastlines look correct.
The Problem with Mercator Maps:
• It stretches areas near the poles, making places like Greenland, Canada, and Russia look much bigger than they really are.
• Greenland looks almost the same size as Africa, but Africa is actually 14 times bigger!
• Countries near the equator, like those in Africa and South America, look smaller than they actually are.
Some people say it gives a misleading view of the world, making Europe and North America look more important.
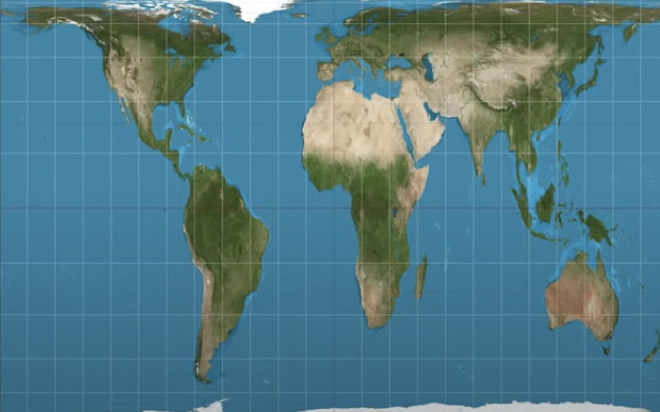
Peters projection: challenges Eurocentric projection by depicting continents according to the true size of their landmass.
The map stretches landmasses vertically, making continents like Africa, South America, and India appear elongated.
• The Peters projection was promoted as a fairer world map because it does not exaggerate the size of wealthy Northern Hemisphere countries while shrinking less-developed equatorial regions.
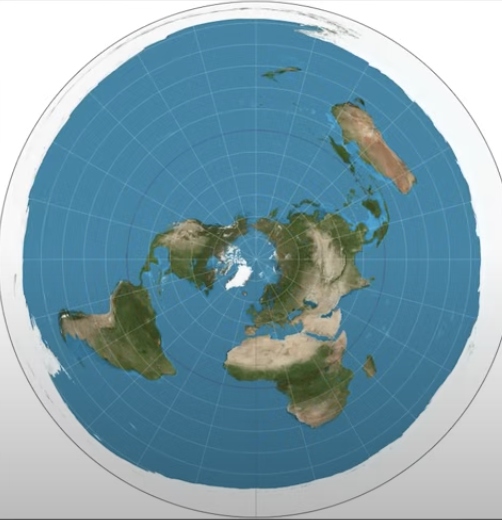
Polar Projection: Views the world from north or south pol.
• The projection shows the polar area in great detail while distorting the shapes and sizes of landmasses further from the pole.
• This type of map makes it easier to view routes or distances near the poles and is often used in contexts like airline routes or polar exploration.
Landmasses closer to the equator (like Africa and South America) appear much larger than they really are.
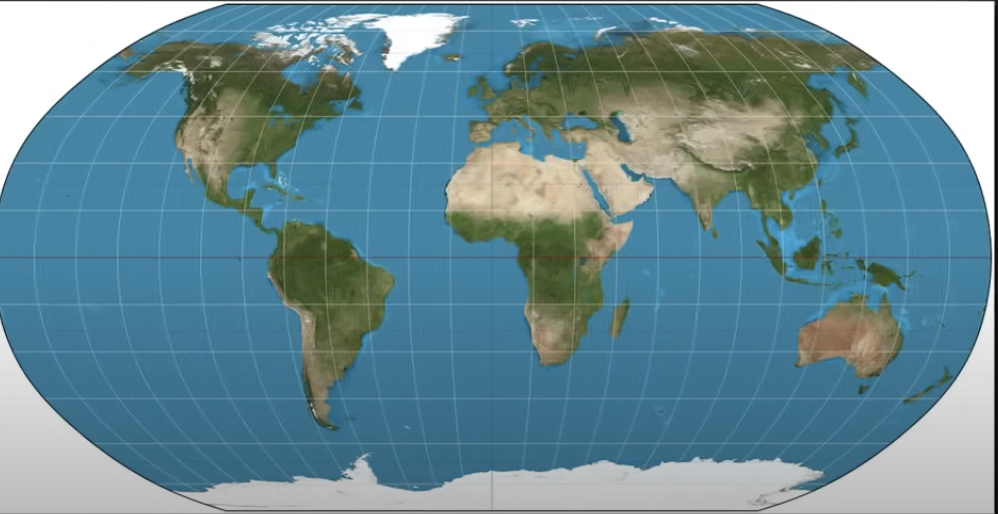
Robinson projection: a compromise between Peters and Mercator map projections. attempts to minimize distortion of both shape and area to provide a more visually pleasing and balanced view of the world.
• The edges of the map are curved, making it visually less angular than some other projections like the Mercator or Gall-Peters projections.
→ Tobler’s First Law of Geography states:
“Everything is related to everything else, but near things are more related than distant things.”
• Places that are closer together tend to have stronger connections (like similar cultures, economies, or environments) than places that are far apart.
• Distance reduces interaction—this is called distance decay (meaning, the farther something is, the less influence it has).
Friction of distance refers to how distance acts as a barrier to interaction between places. The farther apart two places are, the more effort, time, and cost it takes to connect them, which can reduce interaction.
Pattern
Agglomeration is when clustering occurs purposefully around a central point or a economic growth pole
A random pattern is when there is no rhyme or reason to the distribution of a spatial phenomenon
Objects that are normally ordered but appear dispersed are scattered
If it is a straight line, the pattern is linear
If it is a wavy line, the pattern is Sions
Density
Arithmetic density is most often calculated as the number of things per square unit of distance.
Physiologic density measures the number of people per square unit of arable land, meaning land that either is actively farmed or has the potential to be
Agricultural density refers only to the number of farmers per square unit of arable land
Diffusion Patterns
There are a number of different ways and patterns in which human phenomena diffuse spatially, or spread across the Earth’s surface.
A hearth is the point of origin or place of innovation
Expansion diffusion is a process where an idea, innovation, or trend starts in a central place and spreads outward to new areas while remaining strong in its place of origin.
Hierarchical diffusion is when an idea, trend, or innovation spreads from higher-order places or influential people to lower-order places or individuals, moving step by step → Fashion Trends – High-end fashion starts in cities like Paris or Milan, then moves to major retailers, and finally to local stores.
Contagious diffusion happens when an idea, trend, or phenomenon spreads rapidly from its point of origin to nearby places, often without skipping any areas. especially those on adjoining transportation lines
Stimulus diffusion occurs when an idea, trend, or innovation spreads to a new place but is modified or adapted to fit the local culture, needs, or conditions. Instead of copying exactly, people take the underlying principle and change it to make it work for them.
Relocation diffusion pattern begins at a point of origin and then crosses a significant physical barrier, such as an ocean, a mountain range, or a desert, and then relocates on the other side
2.3 Understanding maps
absolute distance: distance that can be measured using a standard unit of length.
relative distance: measured in terms of other criteria such as time and money.
Absolute direction: north, south, east.
Relative direction: left, right, up, down ( based on people’s perceptions)
map scale: mathematical relationship between the size of a map and the part of the real world it shows. it allows to measure absolute distance.
scale can be expressed in 3 ways: a representative fraction, a written scale, or graphically.
a representative fraction is often expressed as a ration → 1: 1000000 means one unit on map represents 1 million earths surface
A graphic scale is expressed with a scale bar showing the relationship between the distance on the map and the distance on Earth's surface.