module 10 animal behavior
Module 10: Animal Behavior
Adapted from materials provided by Professor Doebel, & Awanti Shastri
Objectives & Purpose:
Students will review, understand, and utilize major steps of the scientific method as it relates to animal behavior. Further, students will be able to define and describe basic examples of animal behavior (such as taxis and kinesis) using appropriate terminology. With guided explorations of specific behaviors among varied taxa, students will also be able to state the possible adaptive and evolutionary significance of such responses to stimuli for these organisms. Finally students will use basic statistical tests to assess the significance of their experimental findings to further refine their skills as experimental and quantitative biologists. PPE MUST be worn at all times when handling the live organisms (gloves, goggles, lab coat).
Introduction to animal behavior:
One of the basic characteristics of life is the capacity for an organism to respond to changes in its environment. An organism reacts to a specific change in its environment (a stimulus) by carrying out an appropriate action (a response). The repertoire of responses that characterizes an organism is called its behavior. Ethology is the study of animal behavior. Living organisms have evolved a remarkable diversity of behaviors that can be roughly divided into two sub-categories:
Learned behavior - responses acquired by an organism in the course of its experience
Innate or instinctive behavior - the organism is genetically programmed to carry out the behavior in response to the stimulus
Experimental evidence for both learned and innate behavior suggests the basis for both lies in the animal’s genes. As with all genetically controlled features of an organism (like eye color or limb length or scale pattern, etc…), behavior must be subject to evolutionary adaptation.
Classification of common types of behavior:
What are the common types of behavior observed in animals? Orientation behaviors place the animal in its most favorable environment. One type of orientation behavior is taxis. During taxis, the animal moves towards or away from a particular stimulus such as light, heat, moisture, sound, or chemicals. For example, if an insect prefers to live in dark places rather than in lighted areas, we can demonstrate that it actually avoids light by moving away from it, and we can describe this behavior as taxis.
Prefixes may be added to this term to describe the nature of the stimulus. The response to light uses the prefix “photo-”, the response to gravity uses the prefix "geo-”. In addition, the term ‘positive’ may be added if movement is towards the stimulus or ‘negative’ if movement is away from the stimulus. For example, Euglena swimming towards light would be called positive phototaxis.
What if an organism doesn’t respond to a stimulus with positive or negative taxis? When an organism’s movement is random and shows no orientation with respect to the stimulus, the behavior is described as kinesis. For example, if an organism responds to bright light by moving away, that is taxis, but if an animal responds to bright light by random movements in any and all directions that would be called kinesis. Positive kinesis would be if an activity increased in response to a stimulus, and negative kinesis would be when the activity decreased in response to a stimulus. In today’s lab you will examine the responses of multiple invertebrates both aquatic and terrestrial (Planarian flatworms, Brine Shrimp, Pill Bugs, and Termites) to light, gravity, moisture levels, and other stimuli to determine if they demonstrate a form of kinesis or a form of taxis.
A second type of behavior is agonistic behavior. When animals respond to each other by aggressive or submissive responses their behavior is described as agonistic. Often the agonistic behavior is simply a display that makes the organism look big or threatening. A third type of behavior, mating behavior, involves a complex series of activities that facilitate finding, courting, and mating with a member of the same species. While this lab does not focus on agonistic or mating behaviors, next time you are in a store that sells pet Betta fishes (Figure 1 below), take a few minutes to observe the actions of males and females placed in adjacent tanks. Which behaviors performed in which contexts would you think are agonistic and which behaviors would you think are related to mating? While the morphological differences in male and female betta fishes is obvious in most cases, do you expect to observe differences in their behavior? Are agonistic behaviors and those related to mating necessarily mutually exclusive?
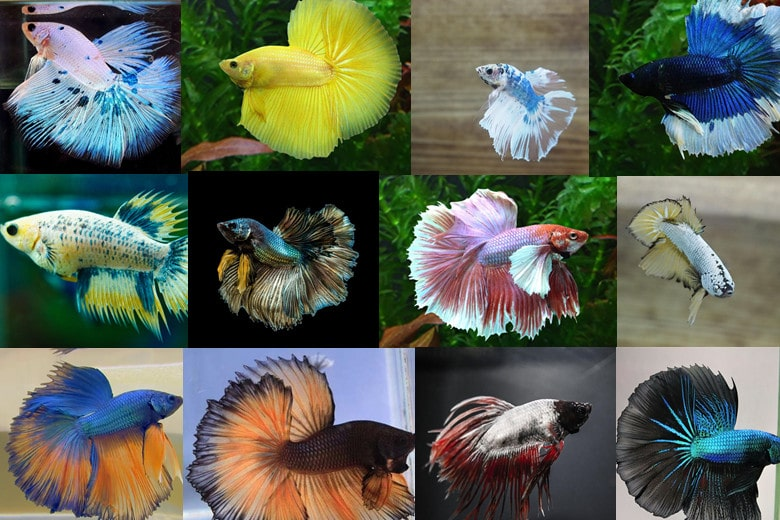
Figure 1. Diversity of male morphology in the betta fish (Betta splendens), are also known as Siamese fighting fishes for the male’s aggression and colorful displays. Betta fish are endemic to the central plain of Thailand, where they were first domesticated at least 1,000 years ago. They were initially bred for aggression and subject to gambling matches akin to cockfighting. (Photo credit: Shannan Reyes).
Tinbergen’s “four questions” guide our study of animal behavior:
In conducting ethological research, scientists try to understand the “how’s” and “why’s” of what an animal is doing. Nikolaas Tinbergen, the co-recipient of the 1973 Nobel Prize in Physiology, developed a formalized approach to guide us in the study of animal behavior by asking four key questions:
What stimulus elicits the behavior, and what physiological mechanisms mediate the response?
How does the animal’s experience during growth and development influence the response mechanisms?
These first two questions refer to the “hows” above and investigate the proximate causes of animal behavior: how does an animal respond to a stimulus? Here, we also investigate the underlying physiological and neural mechanisms of the animal.
How does the behavior aid survival and reproduction?
What is the behavior’s evolutionary history?
These last two questions refer to the “whys” above and investigate the ultimate causes of animal behavior: why does the animal do what it does? Basically, the scientist is asking for the evolutionary explanation underpinning the behavior.
To illustrate this discussion of proximate and ultimate causes related to adaptive behaviors, let's look at an example involving a dragonfly like the one pictured below in Figure 2. The dragonfly will, for example, respond to a human or avian intrusion into its territory by taking flight and making evasive maneuvers in the air. The proximate cause for this behavior is the light reflected off the human or avian intruder stimulates sensory receptors in the compound eyes of the dragonfly, which triggers nervous impulses. The nervous impulses, relayed from the brain of the dragonfly, cause the muscles of the dragonfly’s wings to contract rhythmically in a flight pattern. The ultimate causes for this behavior are the adaptive value of retreating from potential predators as soon as they are detected to avoid being eaten… and an eaten dragonfly cannot produce offspring, therefore genes coding for these behaviors are selected for over generations.

Figure 2. Blue-eyed Darner dragonfly resting on marsh plants, ever vigilant for avian predators and humans looking to expand their entomological collections. (Photo credit: Rick Leche)
As you study different behaviors today, try to think about them as adaptive mechanisms for the organism in question and ask yourself why they might be useful to the organism in its natural environment. Also, consider how the stimuli you are using may differ from those to which the organism normally encounters in its natural environment. In this lab you and a lab group first will go through a couple of standard behavioral exercises on geotaxis of Planaria (Figure 3 below), phototaxis in brine shrimp (Figure 4), kinesis in pillbugs (Figure 5), and trail following in termites (Figure 6), collecting data as you do so and analyzing some of that data using the chi-square test.
Chi-Square test refresher:
You will use the Chi Square test on your data to decide whether to reject or fail to reject the null hypothesis when your predictor (independent) variable and outcome (dependent) variable are both categorical in nature. Remember, the end result of any statistical test is a p value, which tells you whether you reject or fail to reject the null hypothesis. Using a significance level of 0.05, if p>0.05, then you fail to reject the null hypothesis and conclude that any differences between your data and the null hypothesis are due to random error or sampling differences. If p<0.05, you reject your null hypothesis, and conclude that the differences are so large between your data and the null hypothesis that the independent variable does have a significant effect on the dependent variable.
To use the Chi Square test, you calculate a X2 value from your data, then compare it to a value from a Chi Square Table found below (Table 1) or online. If the value you calculated for X2 from your data is greater than (>) the critical value given in the Chi Square Table, then p<0.05 and you must reject the null hypothesis. If the value you calculated for X2 from your data is less than (<) than the critical value given in the Chi Square Table, then p>0.05 and you must fail to reject the null hypothesis (this means you found support for your alternative hypothesis). Let’s consider a simple question: “Are slugs attracted to sugar?” An appropriate null hypothesis for this question is that slugs are neither attracted nor repulsed by sugar (they have no response to sugar). An alternative hypothesis would be that slugs show a preference for sugar. You run an experiment where you place 50 slugs in the middle of a plastic tube with sugar in one end and nothing at the opposite end, then you wait an hour to see which end of the tube the slugs end up in. Keep in mind, if the null hypothesis is true, would expect slug movement to be essentially random and approximately half would be found on each side of the tube. If the alternative hypothesis is true, you would expect a much higher number of slugs on the sugar side of the tube. After you have run your experiment, you find 31 of the 50 slugs in the sugar end of the tube and 19 in the empty end of the tube. This is Chi Square Test equation and how to set it up in this example:
X^2 = ∑ ((Observed value - Expected value)^2)
Expected value
Class (side of the tube slug found on) | Observed | Expected | Obs-Exp | ((Obs-Exp)^2)/Exp |
|---|---|---|---|---|
Sugar half | 31 | 25 | 6 | 36/25 = 1.44 |
Empty half | 19 | 25 | 6 | 36/25 = 1.44 |
Sum-> 1.44+1.44 = 2.88 = X^2 | ||||
The Chi Square test is used for data that fall into classes or categories. Here the classes are the sugar half and the empty half of the tube. The observed numbers are simply what you counted. The expected numbers are based on your null hypothesis that states there is no preference, only random movements, so you would predict about half the slugs to be on each side of the tube. A totally random distribution should show 25 slugs in each half of the tube, with some variation just due to chance. After the calculations are done for each class, the χ values of the separate classes are added to give a Chi Square value for your experiment of 1.44 + 1.44 = 2.88. This is the calculated Chi Square value. But we are not done yet! See the Chi Square table (Table 2) below and keep reading.
Table 1. Chi Square Values for degrees of freedom up to 10
Degrees of Freedom (df) | Probability (p) | ||||||||||
|---|---|---|---|---|---|---|---|---|---|---|---|
0.95 | 0.90 | 0.80 | 0.70 | 0.50 | 0.30 | 0.20 | 0.10 | 0.05 | 0.01 | 0.001 | |
1 | 0.004 | 0.02 | 0.06 | 0.15 | 0.46 | 1.07 | 1.64 | 2.71 | 3.84 | 6.64 | 10.83 |
2 | 0.10 | 0.21 | 0.45 | 0.71 | 1.39 | 2.41 | 3.22 | 4.60 | 5.99 | 9.21 | 13.82 |
3 | 0.35 | 0.58 | 1.01 | 1.42 | 2.37 | 3.66 | 4.64 | 6.25 | 7.82 | 11.34 | 16.27 |
4 | 0.71 | 1.06 | 1.65 | 2.20 | 3.36 | 4.88 | 5.99 | 7.78 | 9.49 | 13.28 | 18.47 |
5 | 1.14 | 1.61 | 2.34 | 3.00 | 4.35 | 6.06 | 7.29 | 9.24 | 11.07 | 15.09 | 20.52 |
6 | 1.63 | 2.20 | 3.07 | 3.83 | 5.35 | 7.23 | 8.56 | 10.64 | 12.59 | 16.81 | 22.46 |
7 | 2.17 | 2.83 | 3.82 | 4.67 | 6.35 | 8.38 | 9.80 | 12.02 | 14.07 | 18.48 | 24.32 |
8 | 2.73 | 3.49 | 4.59 | 5.53 | 7.34 | 9.52 | 11.03 | 13.36 | 15.51 | 20.09 | 26.12 |
9 | 3.32 | 4.17 | 5.38 | 6.39 | 8.34 | 10.66 | 12.24 | 14.68 | 16.92 | 21.67 | 27.88 |
10 | 3.94 | 4.86 | 6.18 | 7.27 | 9.34 | 11.78 | 13.44 | 15.99 | 18.31 | 23.21 | 29.59 |
Nonsignificant | Significant | ||||||||||
How do you find the table Chi Square value for comparison to your calculated Chi Square value?
You will need two additional pieces of information to find the table Chi Square value, the degrees of freedom for your experiment and the significance level for your experiment. The degrees of freedom (df) for an experiment are simply the number of classes minus one. For this experiment, df is 1 (2 classes –1). So we would look under 1 df in the Chi Square Table in Table 2 above. The other piece of information you need is the level of significance or degree of confidence you want to have in your conclusion. The typical standard is to use a level of significance (= level of confidence) of 95%, meaning that you would expect to make an error in your conclusion 5% of the time, just by chance. For our purposes, we will use a significant level of 0.05 all the time, but it could be a different value.
Find the row with df = 1, and the column for significance level of 0.05. The intersection of this row and column give you the table Chi Square value for this experiment of 3.84. We compare our calculated Chi Square value of 2.88 against this table value of 3.84 to find our p value. Since our calculated X^2 value of 2.88 is less than (<) our table X^2 value, our p > 0.05. Therefore, we would fail to reject our null hypothesis.
Does this mean that there is positively no attraction on the part of the slugs in response to the sugar? Certainly, not! From looking at the data, it sure looks like they might be moving towards the sugar, doesn’t it? Our data, however, were not different enough from random movement to reject our null hypothesis. Remember too, that we know that we will be making an incorrect conclusion from our X^2 one in twenty times. What can be done about this? Repeating the experiment would be a good idea, perhaps using more slugs, perhaps giving them more time to move. With repetition and other alterations to the experimental protocol, it should become clear if this was just ‘one of those twenty times’ or slugs really do not show any preference towards sugar.
Protocol:
PPE MUST be worn at all times when handling the live organisms (gloves, goggles, lab coat).
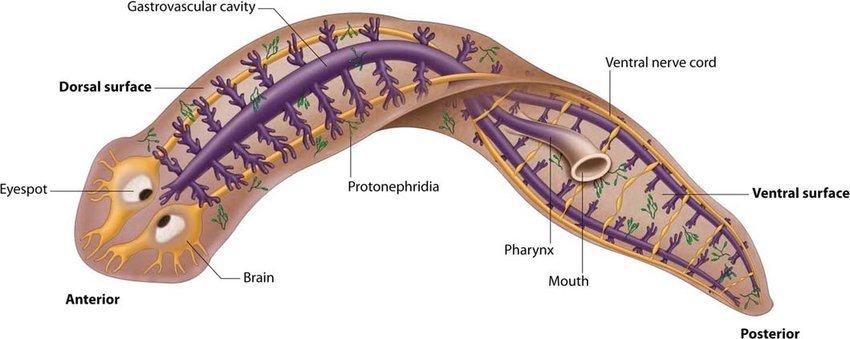
Figure 3. Planaria, a member of the phylum Platyhelminthes (flatworms), is an aquatic carnivore that preys on smaller animals, single celled protists, and sometimes even dead animals. Make note of the organism’s internal and external structures. Which might be relevant for successfully executing behaviors?
Activity 1: Response to gravity in Planaria - How do Planaria (Figure 3 above) respond to the force of gravity? In other words, do they exhibit positive or negative geotaxis, or do they move randomly with respect to gravity? Given the question above and the protocol below, write a null and alternative for this question in your lab notebook. Note if the worms are negatively geotaxic (move against the force of gravity), you would expect them to all travel up into the top half of the tube. If they are positively geotaxic (move with the force of gravity), you would expect them to travel into the bottom half of the tube. If they do not react at all to the stimulus of gravity, you would expect them to be randomly distributed in the test tube. Since you are using a simple Chi-Square test to analyze this data, how precisely would you word the null and alternative hypotheses (hint: think about what you would need the “expected” value for the statistical test to be)?
Obtain a glass test tube and stopper (marked for fresh water with tape). Draw a line around the tube at its middle with a permanent marker. Fill the tube halfway with distilled water.
Transfer 6 Planaria from the culture bottle (or culture dish) into the tube using a 3mL transfer pipette (the tip may need to be cut off depending on the size of the Planaria). Fill the tube the rest of the way with spring water, leaving a little air space at the top (approx 2 cm). Seal the test tube with the stopper.
Rest the test tube horizontally on the lab bench for two minutes until the worms have recovered from the transfer. At this point they usually will have attached to the sides of the tube and begun to crawl around. BE CERTAIN to prevent it rolling around or off the table… the goal is not let the tube move at all while resting.
After the rest period, observe the Planaria for 5 minutes while the tube remains resting horizontally. In your lab notebook, take notes on their general appearance, movements about the tube, and interactions with each other. Note if they seem to prefer one area over another, if they move continuously, settle down, or move sporadically. Note any behaviors that involve two or more Planaria. Do they tend to congregate together? Do not interfere with the specimen in any way.
If you have not already done so, write your null and alternative hypotheses addressing the central question for this activity in your lab notebook.
Place the tube in the wooden test tube rack so it’s vertical and start a timer (you may watch the clock in the room, use your phone, or one of the provided stop watches). Put a piece of paper behind the tubes so that you can see the worms better. DO NOT SHINE A LIGHT ON THE TUBE. In fact, if there is a lot of light coming through the window, it would be best to hold the paper between the window and the tube. Experimentally speaking, what might this action accomplish in this protocol?
Count the number of worms in the top and bottom halves of the tube every minute for six minutes. Enter this data into the data table you’ve made in your lab notebook. Use the table below as a template:
Number of worms in each part of the tube over time | ||
|---|---|---|
Time | Top Half | Bottom Half |
1 minute | ||
2 minutes | ||
3 minutes | ||
4 minutes | ||
5 minutes | ||
6 minutes | ||
When you have completed your experiment, report your data to your lab instructor who will enter it into the class data sheet, which will be projected on the screen.
When everyone in class has completed the experiment, your lab instructor will sum the class data and assign each group Chi Square tests to perform. Each one-minute time period will be tested with a separate Chi Square test to determine approximately how long it takes for the worms to respond to the stimulus (if they do, that is). If you see a significant difference between the top and bottom half of the tube in the first couple of minutes then you know the behavior occurs relatively rapidly. If you do not see a significant difference by the 6th minute (or at all) you can conclude that Planaria respond to gravity slowly or not at all.
While you are waiting to be assigned a Chi Square test, continue collecting observations and data for the next protocol below.
Once the class has reconvened and shared the results for each one-minute period, discuss as a class A) if the Planaria exhibit geotaxis, B) if so, is it positive or negative, and C) if so, do they respond to gravity rapidly or slowly.
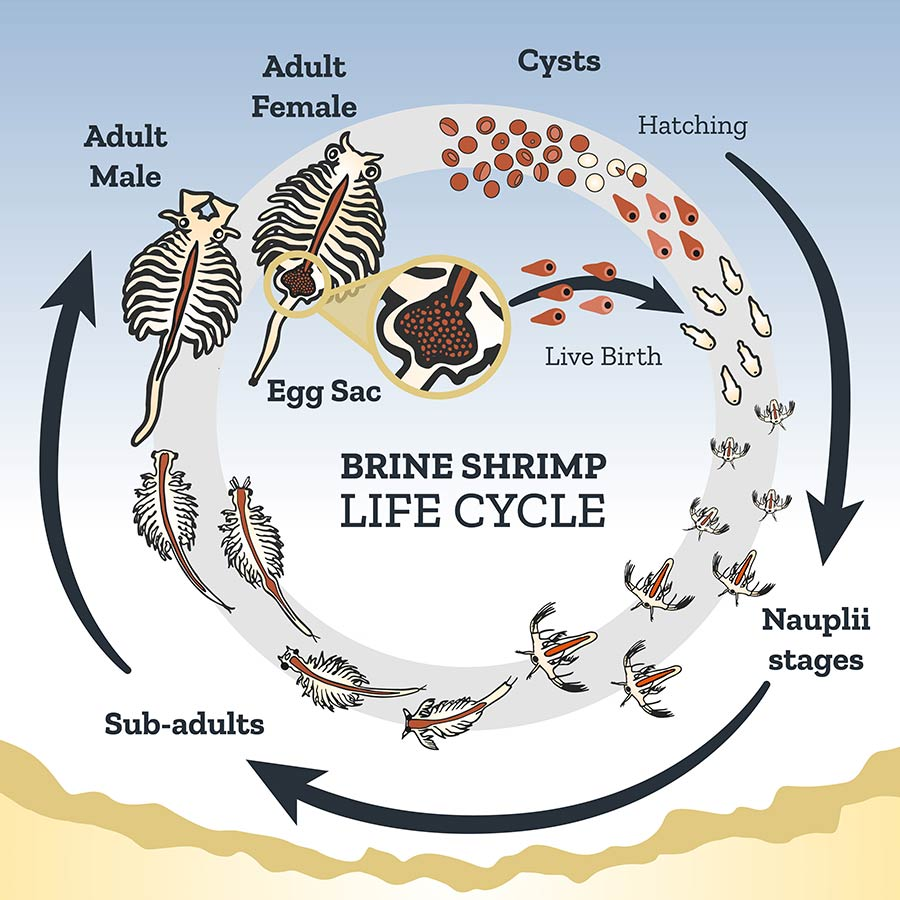
Figure 4. The complex life cycle of brine shrimp in the genus Artemia. Note the adaptations for live birth in ideal conditions vs the use of cysts (eggs with a VERY long shelf life) when conditions are not ideal. Note sexual dimorphism between the female (larger, and often with egg sac) and the male (smaller, with large claspers used in mating behaviors). (Image Credit: Utah Division of Wildlife Resources)
Activity 2: Response to light in brine shrimp - How do brine shrimp (Artemia sp., see Figure 4 above) respond to light - are they positively or negatively phototaxic (toward light or away from light respectively), or do they move randomly with respect to light? Given the question above and the protocol below, write a null and alternative hypothesis for this question in your lab notebook. Note you would expect the brine shrimp to collect in the bottom half of the test tube where the light is shining if they exhibit positive phototaxis, and they would cluster in the top half of the tube if they exhibit negative phototaxis. You would expect equal numbers in each half of the tube if they do not respond to light due to random movement.
Obtain a test tube (NOT marked for fresh water… the shrimp need very salty water to live) and a stopper. Draw a line around the tube at its middle with a permanent marker.
Place six brine shrimp in the test tube filled 2/3rds full with salt water using a 3mL transfer pipette (the tip may need to be cut off depending on the size of the brine shrimp). Place the stopper on the tube and place the tube vertically in the test tube rack. Wait 3 minutes for the shrimp to settle into their new enclosure.
In your lab notebook, describe the behavior of the brine shrimp in your own words. Are they randomly distributed in the tube water column or are they clustered? Are they constantly moving or are they stationary? Do they interact with each other or avoid one another? By describing the behavior of the brine shrimp after they’ve settled down in their new enclosure with relatively few stimuli, what component of experimental design are you establishing? You may need to use black construction paper as a background (oriented to block light from the windows) for observation to see the shrimp.
Obtain a UV flashlight and turn it on (if it has multiple settings, we just want the constant UV light setting… no strobing!). Hold the light perpendicular to the test tube so that the “bulb” end is resting directly against the bottom end of the test tube.
Observe the shrimp for 2 minutes. Do they appear to be doing anything differently now that a UV light is shining on the bottom end of the test tube (relative to when there was no UV light)? Are they consistently moving toward or away from the light source? What would either finding tell you about phototaxis in brine shrimp?
If you have not already done so, write null and alternative hypotheses in your lab notebook addressing the central question.
Make a simple table in your lab notebook and populate it with the number of shrimp exhibiting positive phototaxis, or negative phototaxis. Note the third column in your table should be for a count of shrimp who are exhibiting behavior that you are uncertain about. Note there is no time component for these data, so you are simply noting the number of shrimp in the bottom or the top of the tube at the end of the 2 minute observation period. If they are in the middle, count them as “uncertain.” See below for a table example
Number of Brine Shrimp Exhibiting Light Sensitivity for Each Group | |||
|---|---|---|---|
Group Number | Positive Phototaxis (shrimp in the bottom of the test tube near the light) | Negative Phototaxis (shrimp at the top of the test tube far from the light) | Uncertain (shrimp that seem neither attracted nor repulsed by light) |
1 | |||
2 | |||
3 | |||
4 | |||
5 | |||
6 | |||
Totals | |||
Your group data will be reported to the lab instructor and added to the class level data across all groups, and you will record it in your own table in your lab notebook like the one shown above.
Once you have the class level data, do you notice any trends in the data across groups? Even without analyzing the data, can you make any very obvious statements about phototaxis in brine shrimp? Consider with your group what type of statistical analyses you could with these data you collected in order to see if the data are statistically significant given your hypotheses. What types of alterations could be made to the protocol to determine if the shrimp are in fact responding to light and not some other stimulus?
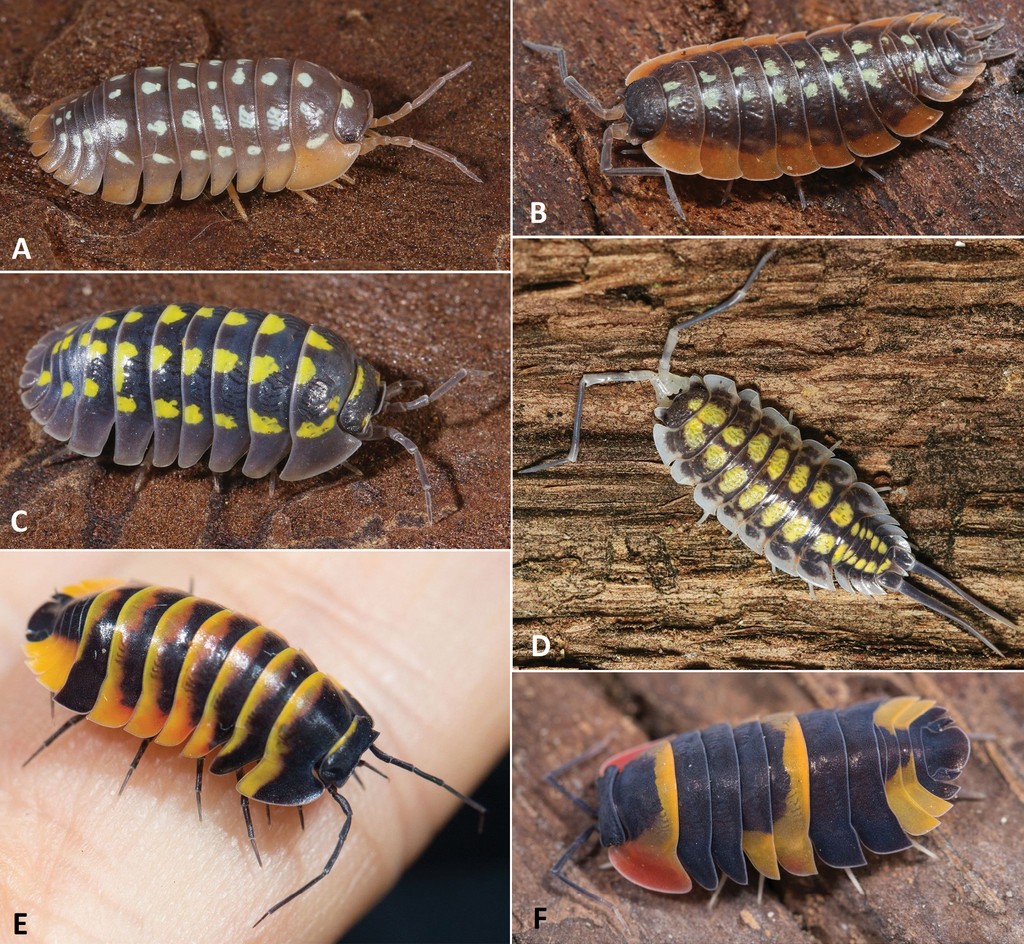
Figure 5. The pill bugs are truly terrestrial arthropods in the suborder Oniscidea consisting of roughly 4,000 identified species and perhaps as many as 10,000 yet to be described by science. The above image is just a small sub sample of that massive diversity. These images show aposematic coloration displaying “distastefulness” is common across the group, which helps their predators learn not to eat them. (Photo Credit: Tuf & Ďurajková, ZooKeys, 2022).
Activity 3: Kinesis in pill bugs - Kinesis can be studied using a crustacean in the order Isopoda (called isopods, Figure 5. above). You might know these organisms colloquially as “pill bugs, “sow bugs,” “wood-lice,” or “roly-polies.” Although most crustaceans are marine or aquatic, isopods in the suborder Oniscidea are truly terrestrial, and much of their behavior is predicated upon their need to avoid desiccation (drying out). They can be easily collected during warm months in the year under flower pots, in leaf litter, or in wood piles. Some species, like the ones we have today, even respond to mechanical stimuli by rolling up into a ball. The overarching question for this activity is “How does pill bug behavior change in wet vs dry environments?” In other words, do pill bugs exhibit hydrokinesis?
Students will be investigating pill bug behavior in dry and wet environments by observing their degree of activity, specifically the number of times they circle and change directions in their respective arenas. In your lab notebook, write what possible stimuli might modify these behaviors.
In your lab notebook, write a null and alternative hypothesis addressing the degree of activity in dry vs wet environments. Given the behavioral metrics we are assessing, what specific predictions can be made regarding your hypotheses (i.e. If the environment is wet, pill bugs will complete more circles around their arena and change directions less frequently). Justify why you think your predictions are accurate.
Your lab instructor will assign your group to either the “wet” or the “dry” treatment.
Both types of groups will obtain a single large petri dish, and a single piece of filter paper. Each group will place their filter paper into the lid of the petri dish so it is flush with the bottom. The filter paper should cover the entire bottom of the petri dish lid.
The “wet” treatment groups ONLY will place ~1 mL of fresh, DI water in the dish with a transfer pipette. The “dry” treatment groups WILL NOT DO THIS.
Each group will place 5 pill bugs in each petri dish (brush them from the culture jar into your petri dish using a paintbrush OR pick them up GENTLY with a gloved hand).
All petri dishes will be placed on the bench top and covered in black construction paper such that light is not directly shining on the pill bugs for 5 minutes. This will “settle” the pill bugs and stop them from stressing too much about being in a bright environment.
While your 5 minutes of waiting elapses, assign each member of your group one of the following tasks: 1. Person responsible for counting the number of MOVING pill bugs in each group, 2. Two people responsible for choosing the 2 most active pill bugs and determining their rate of locomotion in rotations per minute (rpm), and 3. Person responsible for determining the rate of turning in one pill bug in the dish by counting the number of direction reversals per minute (in other words, how many times does the pill bug switch moving directions?). A table like the one below should be ready for filling out in your lab notebook:
Individual Group Data for Kinesis in Pill Bugs: Responses to Wet and Dry conditions | ||||
|---|---|---|---|---|
Environmental Condition | Number Moving | Rate of Locomotion (rpm) Individual 1 | Rate of Locomotion (rpm) Individual 2 | Rate of turning (turns/minute) Individual 3 |
Wet | ||||
Dry | ||||
After the five minutes has elapsed, remove the black construction paper and each assigned group member observes the pill bugs for a total of two minutes to record their data and observations.
Pair up with a group who collected data for the other environmental treatment (“wets” with “drys”) and record their data in your lab notebook in the same table. Do you notice any differences or trends in the data sets? Consider with your group what type of statistical analyses you could with all these different types of data you collected in order to see if there is a significant difference between treatments.
Discuss with your group what each metric (moving number, rate of locomotion, and rate of turning) might contribute to your understanding of behavior related to environmental moisture levels in pill bugs. There will be no formal data analysis for this section, but you need to discuss with your group or with the class what is different about this data set and how you would analyze it.
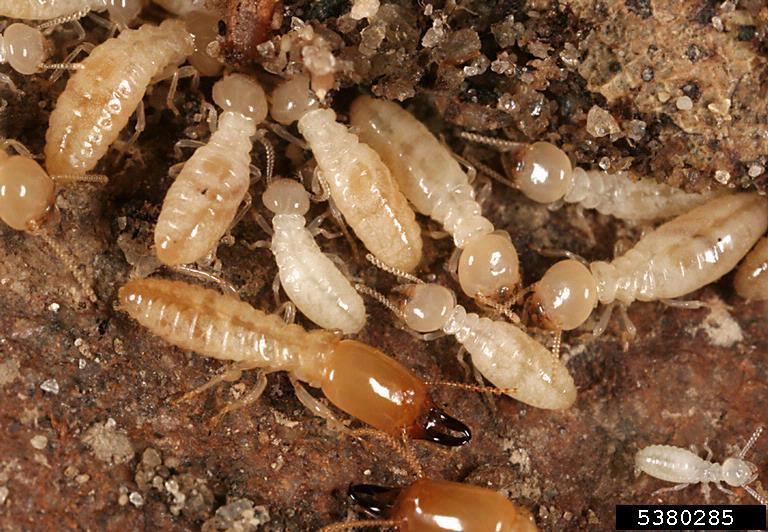
Figure 6. Reticulitermes flavipes photograph showing a soldier caste (large head and mandibles in the foreground) and worker castes at various life stages (youngest being the very small, translucent white individual in the lower right corner of the image). The soldier caste has morphological and behavioral adaptations for colony defense, often wedging itself into a tunnel with its powerful jaws facing outward, ready to snap at any intruders. The workers of this species actually retain the ability to differentiate into reproductive or soldier castes throughout their lives. (Photo Credit: Gary Alpert, Harvard University)
Activity 4: Trail following in termites - Reticulitermes flavipes (Figure 6 above), also known as the eastern subterranean termite, is the most commonly found termite in North America. This genus of termite alone is responsible for tens of billions of dollars a year in structural and timber damage, not to mention the $2.2 billion spent annually in the USA on termite pest control.
Importantly for our behavioral activities today, worker and soldier termites are completely blind. They use the senses of touch and “smell” to identify one another, their enemies, and to find food. When a termite locates food, it releases pheromones from its abdomen as it returns to the colony. The pheromones leave an invisible chemical trail other termites can smell to follow. The pheromone is volatile, meaning it is present in the air above the trail, so termites that get close to the trail without actually touching it can find their way.
Termites also follow trails produced by chemicals that mimic pheromones. These include alcohols and fatty acids. The blue and black ink in ballpoint pens contain the alcohol 2-phenoxyethanol (PE). PE is a volatile solvent that helps blue ink flow smoothly and dry quickly. However, the solvent doesn’t evaporate completely. In short, when a termite encounters an ink trail from certain types of pens, it thinks it has found a path to food and will generally follow it if the compound concentration is strong enough. The following activity requires no hypothesis testing or quantitative data collection, but students should be taking careful observations/notes on termite behavior when exposed to different inks with the intention of figuring out which types of pens contain 2-phenoxyethanol.
Each group must obtain a piece of white printer paper to draw on, a selection of different colors and styles of pens, a paint brush, and about 5 termites.
Draw a simple line or shape with each of the pens on your piece of paper. Common choices are straight or zigzag lines, circles, triangles, squares, or figure eights. Do not use a light touch here, you want the ink to have as strong a signal to the termites as possible… so no light or wispy lines. Label each shape with the brand/type of pen used to draw it. You have a whole 8.5” x 11” sheet of paper to work with, so do not crowd your drawings. Draw the same shape for each pen type to not add a confounding variable!
GENTLY, pick up a termite from the culture container using a paint brush and place it GENTLY on one of your drawn shapes. Worker termite bodies are extremely fragile, so even poking them too hard with the paint brush will result in their death.
Observe the termite’s behaviors for 2 minutes on the ink type you placed it on, and record your observations in your notebook. Pay special attention to how it interacts with the ink lines relative to the blank paper. Does it wander aimlessly around the paper or does it generally follow the lines of the shape drawn? How much or how fast do the antennae move around when on and off the ink trail? Does the termite seem to be activity running away from the ink trail (avoidance behaviors)? Etc….
Try to not shake the table or paper too much as termites are incredibly sensitive to vibrations, which may skew your observations of the trail following behaviors.
Once your observation time has elapsed, GENTLY place your termite into the termite terraria on the instructor bench. Repeat steps 3-6 with a fresh termite from the culture container for each of your ink drawings.
Once you’ve tested all available inks and made your observations, record in your lab notebook which pens you think contain chemicals which mimic termite pheromones. Referring to your observation notes, rank what you think the concentration of pheromone in your pens from greatest to least, assuming that a “stronger” termite response correlates with higher pheromone concentrations.
For fun, before you add your termites back to their home terrarium, you may wish to write your name or something silly in cursive with the “strongest” ink to see if you can get the termites to follow the ink trail.