Chapter 5
Standardize - We ___________ to eliminate units. ____________ values can be compared and combined even if the original variables had different units and magnitudes.
Standardized value - A value found by subtracting the mean and dividing by the standard deviation.
Shifting - Adding a constant to each data value adds the same constant to the mean, the median, and the quartiles, but does not change the standard deviation or IQR.
Rescaling - Multiplying each data value by a constant multiplies both the measures of position (mean, median, and quartiles) and the measures of spread (standard deviation and IQR) by that constant.
Normal (or Gaussian) model - A useful family of models for unimodal, symmetric distributions.
Parameter - A numerically valued attribute of a model. For example, the values of μ and σ in a N(μ, σ) model are parameters.
Statistic - A value calculated from data to summarize aspects of the data. For example, the mean, y, and standard deviation, s, are __________.
68-95-99.7 Rule - In a Normal model, about % of values fall within 1 standard deviation of the mean, about % fall within 2 standard deviations of the mean, and about ____% fall within 3 standard deviations of the mean.
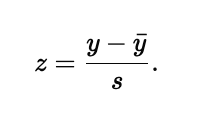
z-score - A _______ tells how many standard deviations a value is from the mean; ________ have a mean of 0 and a standard deviation of 1.
When working with data, use the statistics y and s:
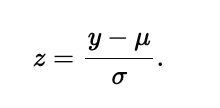
When working with models, use the parameters μ and σ:
Standard Normal model (or Standard Normal Distribution) - A ________ ______ _____, N(μ, σ) with mean μ = 0 and standard deviation σ = 1.
Nearly Normal Condition - A distribution is in ______ ______ _________ if it is unimodal and symmetric. We can check by looking at a histogram or a Normal probability plot.
Sampling distribution - The ________ ____________ of a statistic is the distribution of all values of the statistic if it was computed for every possible sample (of a given size). We can approximate it by drawing many samples and making a histogram of the resulting statistic values.
Normal percentile - The ______ __________ corresponding to a z-score gives the percentage of values in a standard. Normal distribution found at that z-score or below.
Normal probability plot - A display to help assess whether a distribution of data is approximately Normal. If the plot is nearly straight, the data satisfy the Nearly Normal Condition.