Flow cytometry
Flow cytometry
FLOW is STREAM OF LIQUID
- in a flowing heterogeneous suspension
CYTO is CELL
- individual cells
METRY is MEASUREMENT
- and their characteristics (number, size, complexity, presence and amount of special markers) can be measured based on optical signals (light scattering, fluorescence)
SORTING is SEPARATION
- on the basis of the measured parameters subsets of cells can be physically separated from each other for further purposes (morphological, biochemical analysis, cell culturing).
==Flow cytometry allows that in a flowing heterogeneous suspension of cells, individual cells and their characteristics can be measured. On the basis of measured parameters cells subsets can be separated for further purposes.==
Application
• Medical biology • Clinical practice
Components
- Fluidics: aligns cells by hydrodynamic focusing to present at interrogation point.
- Optics: consist of light sources to illuminate sample.
- Electronics, data analysis: convert light from detectors to digital data.
- Sorting: physically separates interesting subsets of cells based on parameters of others.
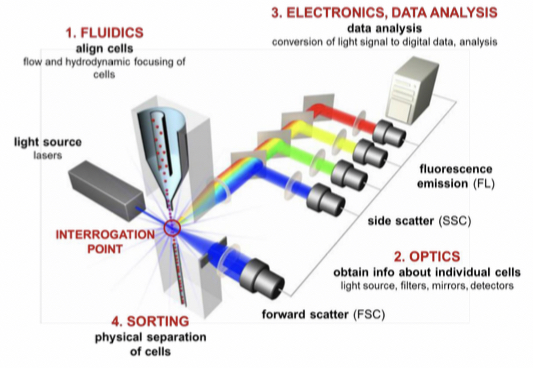
Operation
The sample fluid consists of the cell suspension and is injected into a flowing stream of sheath fluid surrounding the sample to protect the cells from damage that can be caused by the flow.
As light passes the laser beam it scatters light, forward scattered light is collected by a detector in front of the light source and side scattered light is collected by the detector 90° from the laser's path. Fluorescent signal is detected in same direction as side scatter and directed through optical filters to chose range to deliver to detector.
Application
It can be used in HIV screening because there is a decline in T-helper lymphocytes so we need to count the number of T-helper cells during screening. The cytometer is used to:
• identify lymphocytes
• identify T-helper cells
• quantify the number of T-helper cells
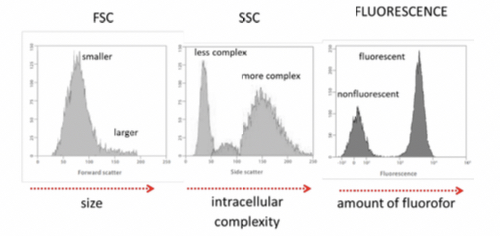
Detected parameters
- Light scattering: can either be;
a) Forward Scatter, ==smaller angles and to quantify the size of the cell.==
b) Side scatter, ==larger angles and to quantify intercellular structural complexity.==

- Fluorescence emission: informs about specific parameters, fluorophore specifically bound to cells and cellular components
Data representation and analysis
A flow cytometer is relatively fast with an acquisition rate of 10000 events per second. It can be equipped with several detection channels so we end up with a huge dataset.
Data can be represented in:
A) List mode - presentation of measured data in all cells, raw data stored on computer.
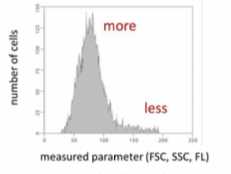
B) Single parametric representation(Histogram)- plot of number cells characterised by a given parameter. Horizontal axis shows the measured parameter and vertical axis shows number of cells characterised by a given value.
Higher the peak, the more cellscharacterised by a given parameter.
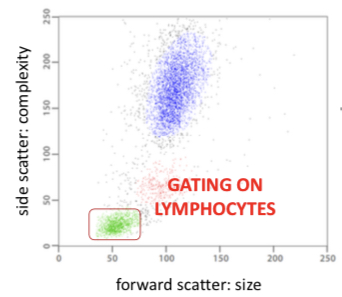
C) Multiparametric representation(Dot plot) - applies the correlation method, corresponding values of two measured parameters for each cell (x, y axis) are displayed as dots, each dot corresponds to a single particle.
Gating - definition of subpopulation of cells in one-, or multiparametric representation for detailed investigation or separation.
Principles of cell sorting
physical separation of cell populations characterized by a given parameter (FSC, SSC, FL) for further investigation(biochemical analysis, cell culturing).
Steps
- Data collection
- Decision: based on gating, the cell population to be sorted is defined.
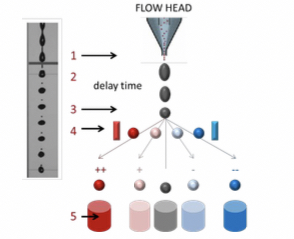
- Drop formation: the flow head is shaken by a piezoelectric vibrator (30-40 kHz) to decompose the fluid that leaves the head into droplets (1 droplet = 1 cell).
- Electrostatic separation: the droplet to be separated is charged at the place of droplet formation and deflected by an electric field.
- Separation: 3000 - 5000 cell/s