Economics HL
Green = new unit, Yellow = new topic, Underline = new section
Real world examples at the end → demand + supply side policies (WIP)
Unit 1: What is economics?
Factors of Production
Land
natural resources
Labour
human resources
Capital
production of goods
Entrepreneurship
management, ideas
Scarcity - limited availability of economic resources relative to society’s unlimited demand for goods and services
Efficiency - maximized production using supply and based off of individual choices (demand) or making the best possible use of scarce resources
Choice - not all needs and wants can be satisfied, so choices have to be made → opp. cost
Oppurtunity cost - what you give up to have something else
Economic cost - accounting/financial cost + oppurtunity cost
Sustainability - ability of the present generation to meet its needs without compromising the ability of the future generation(s) to meet their own needs
Margin - theory of how prices are derived, derived from consuming something, not total utility but extra utility of consuming
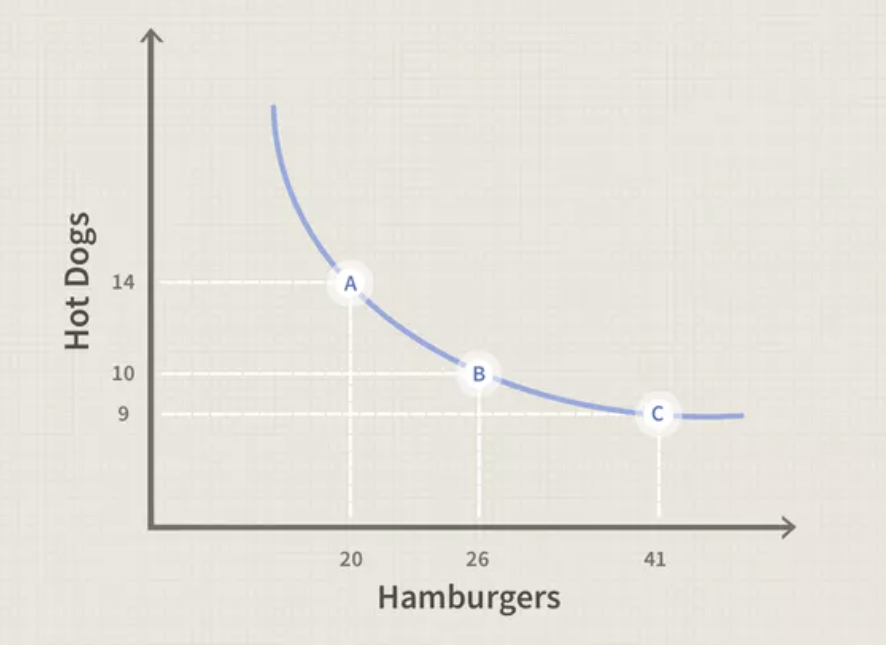
Production Possibilities Curve (PPC)
a graph which indicates the different possible choices a firm can make to maximize profit while maintaining maximum efficiency
difference between Price 1 and Price 2 is not the same as the difference between Price 2 and Price 3 (opp. cost is not equal in all scenarios)
curve is named PPF (production possibility frontier)
assumptions
technology, time and FOP are constant
only two goods are produced in this market
all of society’s income goes toward these two goods
Circular Flow Diagram
GDP = C + I + G + (X-M)
Consumption, Investment, Government, eXports, iMports
simplification of reality that takes out certain factors and makes them constant
Methodology
Positive
scientific perspective on economics (hypothesis + data/evidence)
verifiable in principle
all other things remain equal (ceteris paribus)
Normative
subjective value judgement
cannot be objectively verified/measured
nonquantifiable adjectives (important, ought to, must, etc.)
Economists
Adam Smith
the “invisible hand” is a metaphor for efficient allocation of resources by society
laissaz faire - policy of letting things run their own course
Karl Marx
labour theory of value
decreasing rates of profit and increasing concentration of wealth
more caring toward the masses
Keynes
counter-cyclical government and multiplier
argued that governments had an important management role in macroeconomics
provided a foundation for modern macroeconomics
full employment is a special case and is not frequently occuring
incentive to invest is too weak and the urge to hoard cash is too strong
without necessary investment, the economy maximizes the unfull employment which increases productivity
19th Century Classical Economic Ideas
Bentham
utilitarianism - most happiness among greatest number of people
utilty - property in any object tends to produce
benefits/advantages/pleasure/good/happiness or to prevent the opposite
Jevon
Jevon’s paradox - as technological advancements increase efficiency of labour, demand will increase thus not changing efficiency and waste
Say
Say’s Law - unemployment cannot exist for long periods because production would create its own demand
Carl Menger
subjective theory of value - in an exchange, both parties always profit as they trade something they think is less valuable for something they think is more valuable
Leon Walras
Walras’ Law - the existence of excess supply in one market must be matched by excess demand in another market so that both factors are balanced out
Milton Friedman
economic theory should be subject to empirical corroboration to test its relevance to the real world
prediction is a key factor
not the realism of the assumptions but the accuracy
Robert Lucas Jr.
individual’s rational expectations of inflation and government policies
Friedman + Lucas
the role of markets is bringing the economy back to a situation where there is full employment without any government intervention
Free Sector Diagram
Injections - investment (I), government spending (G), exports (X)
Leakages - savings (S), tax (T), imports (M)
If injections = leakages, the economy is in equilbrium/static
Behavioural Economics
Assumptions made in behavioural economic graphs
people are rational/consistent
utility is maximized
people have access to all information at all times
Thinking Fast/Slow
heurisitcs where people use rule of thumb to make quick decisions
Present Bias
people under-invest because the benefits come in the future, and people generally would want benefits in the present
Representative Individual
one person is recorded/measured and “cloned” to create a larger demographic
Nudging
preserving freedom but helping people make decisions when they cannot / don’t (default)
Hot-hand fallacy
belief that a winning streak leads to further success
Biases
overconfidence
a belief that one’s skill or judgement is better than they truly are, or that probability of success is higher than it actually is (ex: health club membership)
hyperbolic discounting
tendency of people to make the present much more important than even the near future while making economic decisions (ex: credit cards)
framing effects
endowment effect - possessing a good makes it more valuable
loss aversion - a framing bias in which consumers choose a reference point around which losses hurt more than gains feel good
anchoring - a framing bias in which a person’s decision is influenced by specific pieces of information given
sunk cost fallacy
the mistake of a sunk cost to affect decisions (ex: Robert Griffin III)
Degrowth communism
the economy is big enough already, when is the stopping point for growth?
focus growth on more important aspects such as healthcare and not consumption as it raises healthcare costs
example of Japan
Interdependence
a consideration of possible economic consequences of interdependences is essential when conducting economic anaylsis
nothing in the economy is self-sufficient, so they interact with one another (the greater the scale of interaction, the greater the interdependence)
Linear economy
take → make → waste
resource extraction → production → distribution → consumption → disposal
Circular economy
take → make/remake → distribute → use/repair/reuse → selectively dispose → enrich/recycle → take → …
aims to minimize waste and promote a sustainable use of natural resources
problems
no clear definition (too vague)
ignores scientific principles (matter/energy cannot be created or destroyed)
lack of scale (hard to scale up to global level)
Systems perspective
taking into account all of the behaviours of a system as a whole in the context of its environment
Economic efficiency
socially constructed concept with its politics and its political implications
public goal, competing with other public priorities
to improve the state of one party, you must hurt another
soceity gets maximum net benefits
Eco-efficiency
production of goods and services while using fewer resources and creating less waste/pollution
creating more value through an increase in resource productivity and a decrease in resource intensity
leads to less resource consumption
Economic Well-Being
refers to levels of prosperity, economics satisfaction and standards of living among the members of a society
Unit 2: Microeconomics
Marginal rate of substitution
MRSxy = oppurtunity cost, slope of indifference curve
A series of optimal consumer choices provides the theoretical basis for an individual demand curve
Diminishing marginal utility
as we consume more of a good, the satisfaction we derive from 1 additional unit decreases
rate of satisfaction diminishes with every 1 unit
examples: food, cars
Indifference curves
IC always has a negative slope if consumer likes both goods
IC cannot intersect
Every good can lie on one IC
ICs are not thick
Demand Theory
Substitute effect
Measures of consumer MRSxy, before and after the price change
Amount of additional food the consumer would buy to achieve the same level of utility (assuming a price decrease in one good)
Moving from one optimal curve to another
Steps:
Identify initial optimum basket of goods
Identify final optimum basket of goods, after the price change
Identify the decomposition optimum basket (DOB), attributed to the substitution effect
DOB must be on a BL that is parallel to BL2 following the price change
Assume that consumer retains same level of utility after the price change
Income effect
Accounts for price change by holding the consumer’s purchasing power (following price change) constant and finding an optimum bundle on a new (higher/lower) utility function
Purchasing power - number of goods/services that can be purchased with a unit of currency (falls when price increases)
Measured from the DOB (B and Xb) to the final optimum bundle, following price change (C and Xc)
Both effects move in the same direction
Law of Demand
At a higher price, consumers will demand a lower quantity of a good (vice versa)
Relates to diminishing marginal utility by compensating (off-set) DMU must be negatively related to quantity
Inverse relationship of price and quantity
Given the presence of diminishing marginal utility, in order to promote increased consumption, prices must fall
For a “normal good,” the increase in consumption results from a fall in price - this is driven by:
a lower MRSxy, while remaining on the same IC generates increased consumption of good X (substitute effect)
the theoretical increase in income necessary to lift the consumer to the higher IC, while keeping the ratio of prices at the new level (income effect)
Economic theory of demand always starts at the individual level. A horizontal summation of many individual demand curves provides a market demand curve. Market demand curves are always less steep than individual demand curves
Determinants of Demand
Income
Price of substitutes/complements
Number of consumers
Preference or tastes
These factors cause a market demand curve to shift (change in demand)
Individual Demand Curve
a series of optimal choice bundles across different price levels (shown on price-quantity graphs)
Inferior Good
whether the substitution effect or income effect dominates in an empirical not theoretical question
Opposite of a normal good, demand falls when income rises
Non-price determinants of demand
income (normal good)
income (inferior good)
preferences/tastes
price of substitute/complement goods
number of consumers
Perfect Competition
Economic profit maximization is the assumed goal of private firms
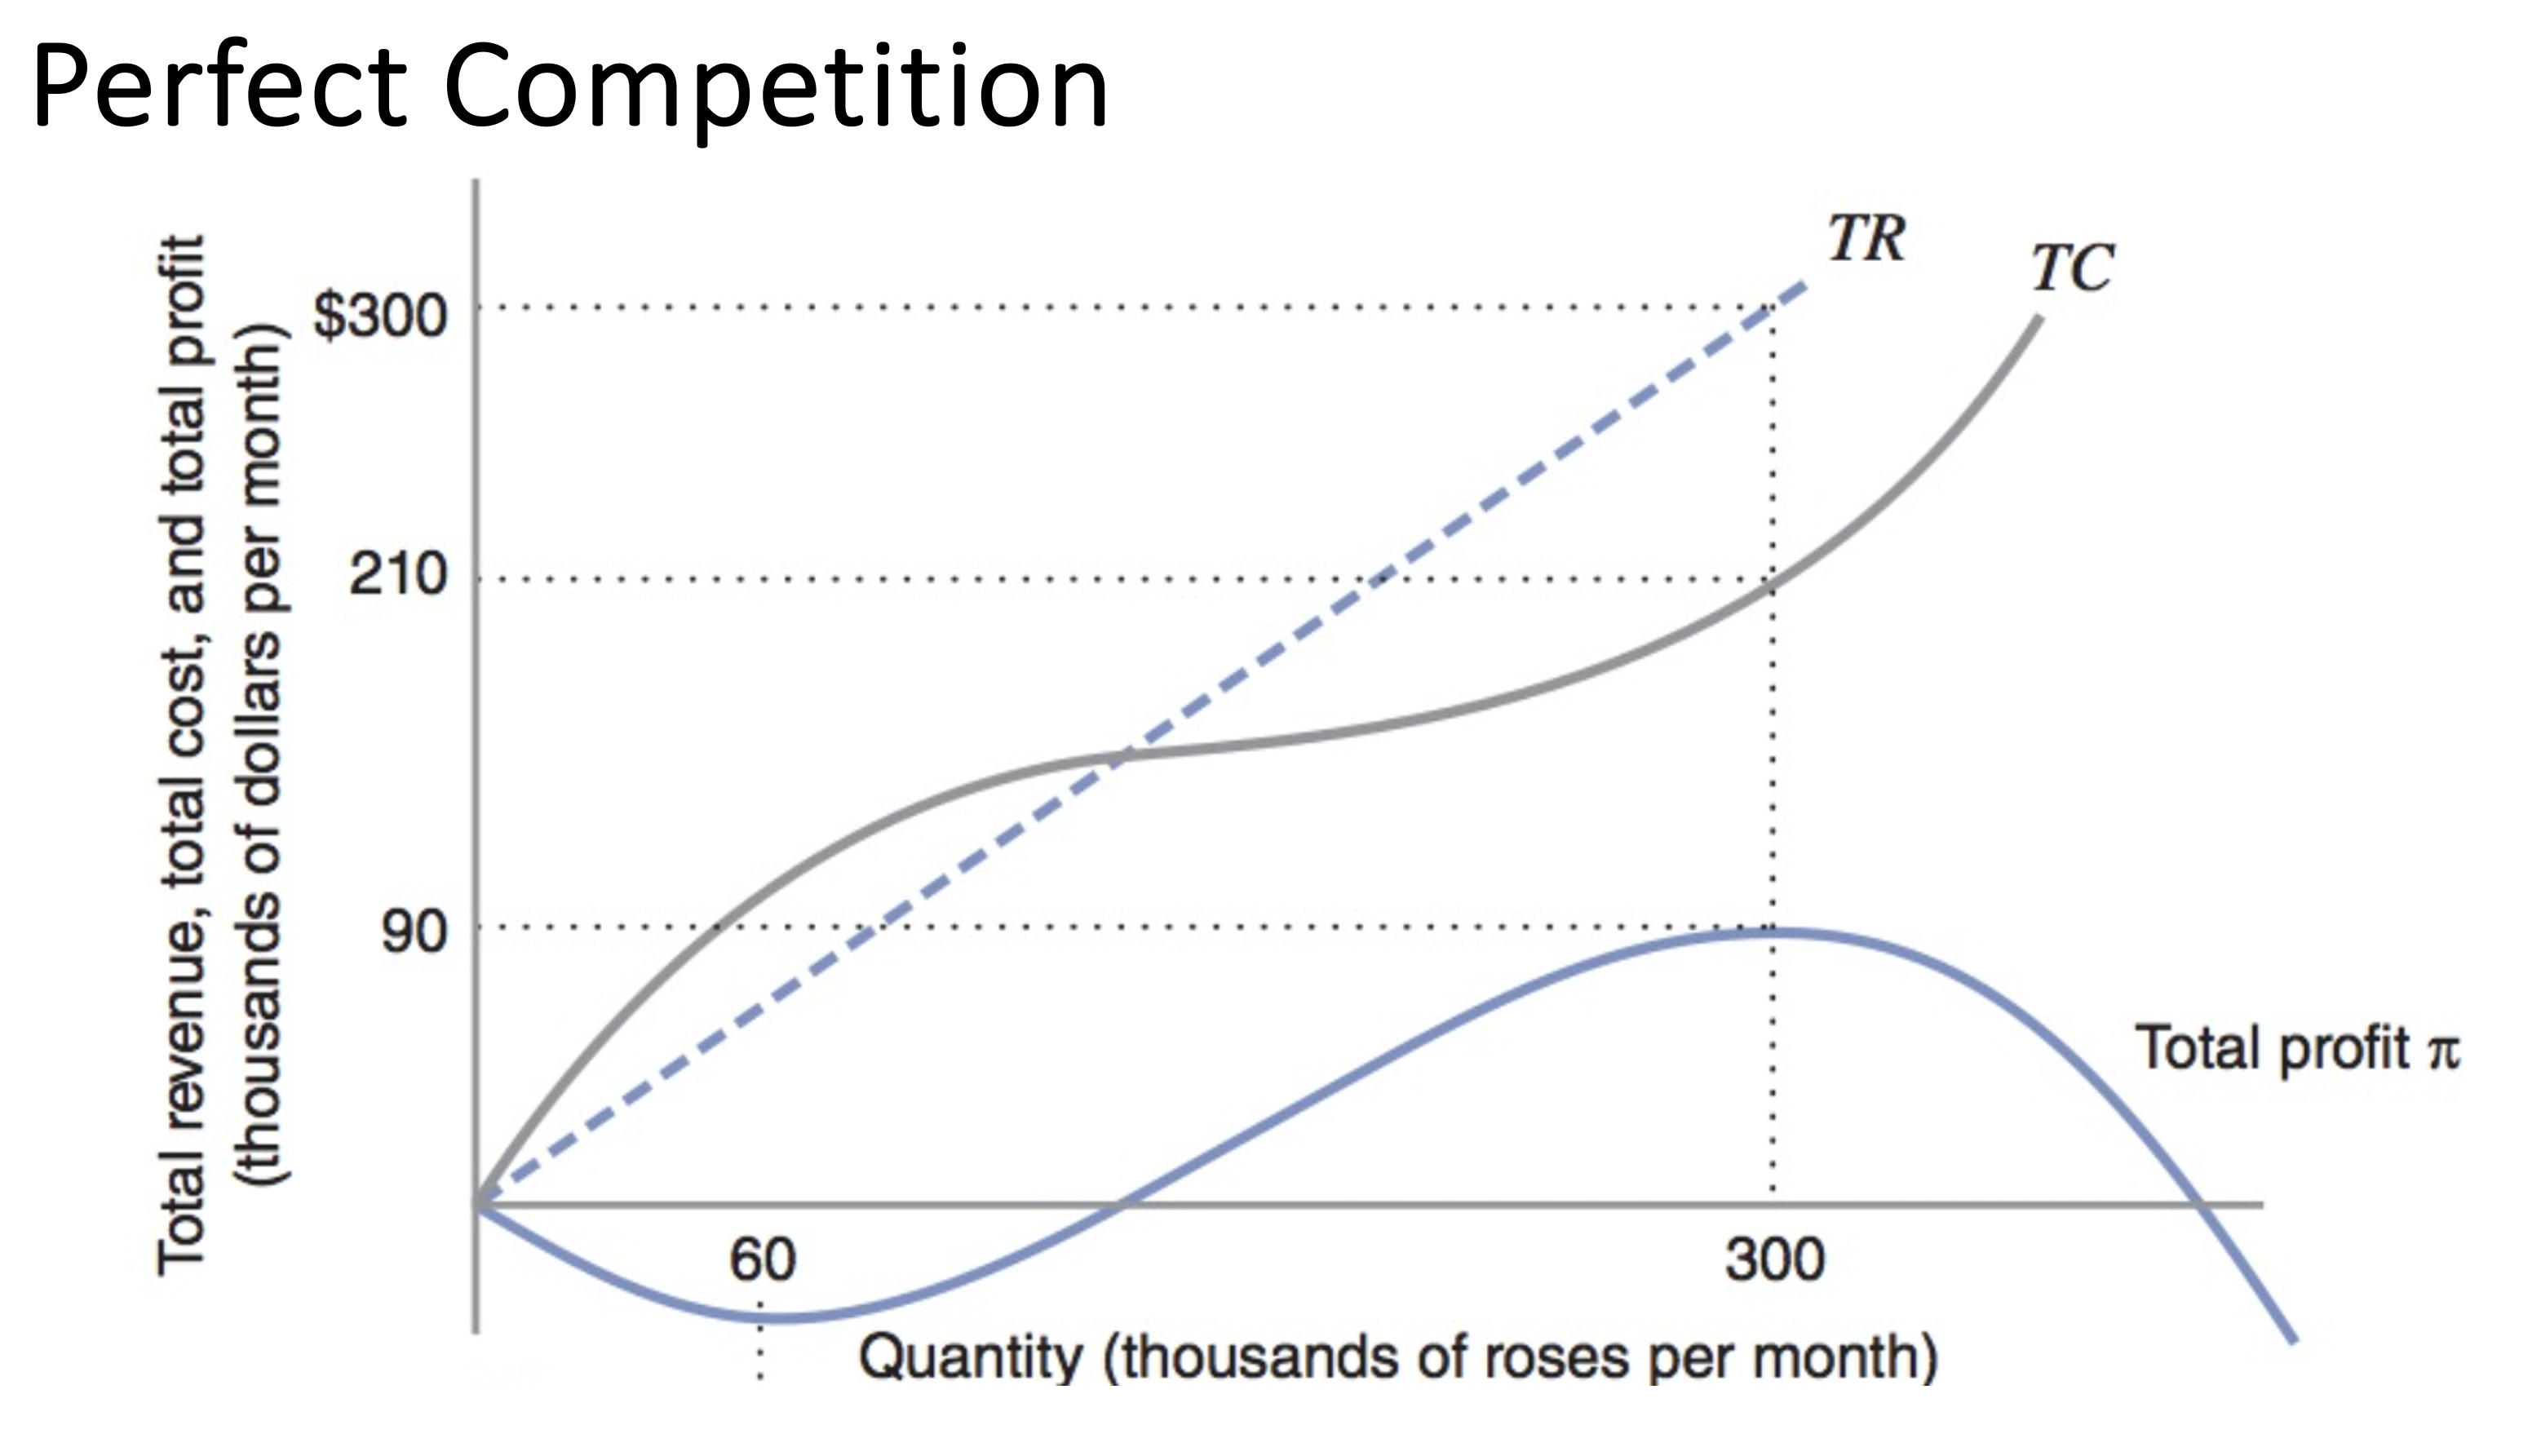
Total cost represents the most efficient combination of inputs for a given level of output
The rate at which total revenue (TR) changes with respect to change in output (Q) is marginal revenue (MR)
MR = TR/Q = (Q*P)/Q = P
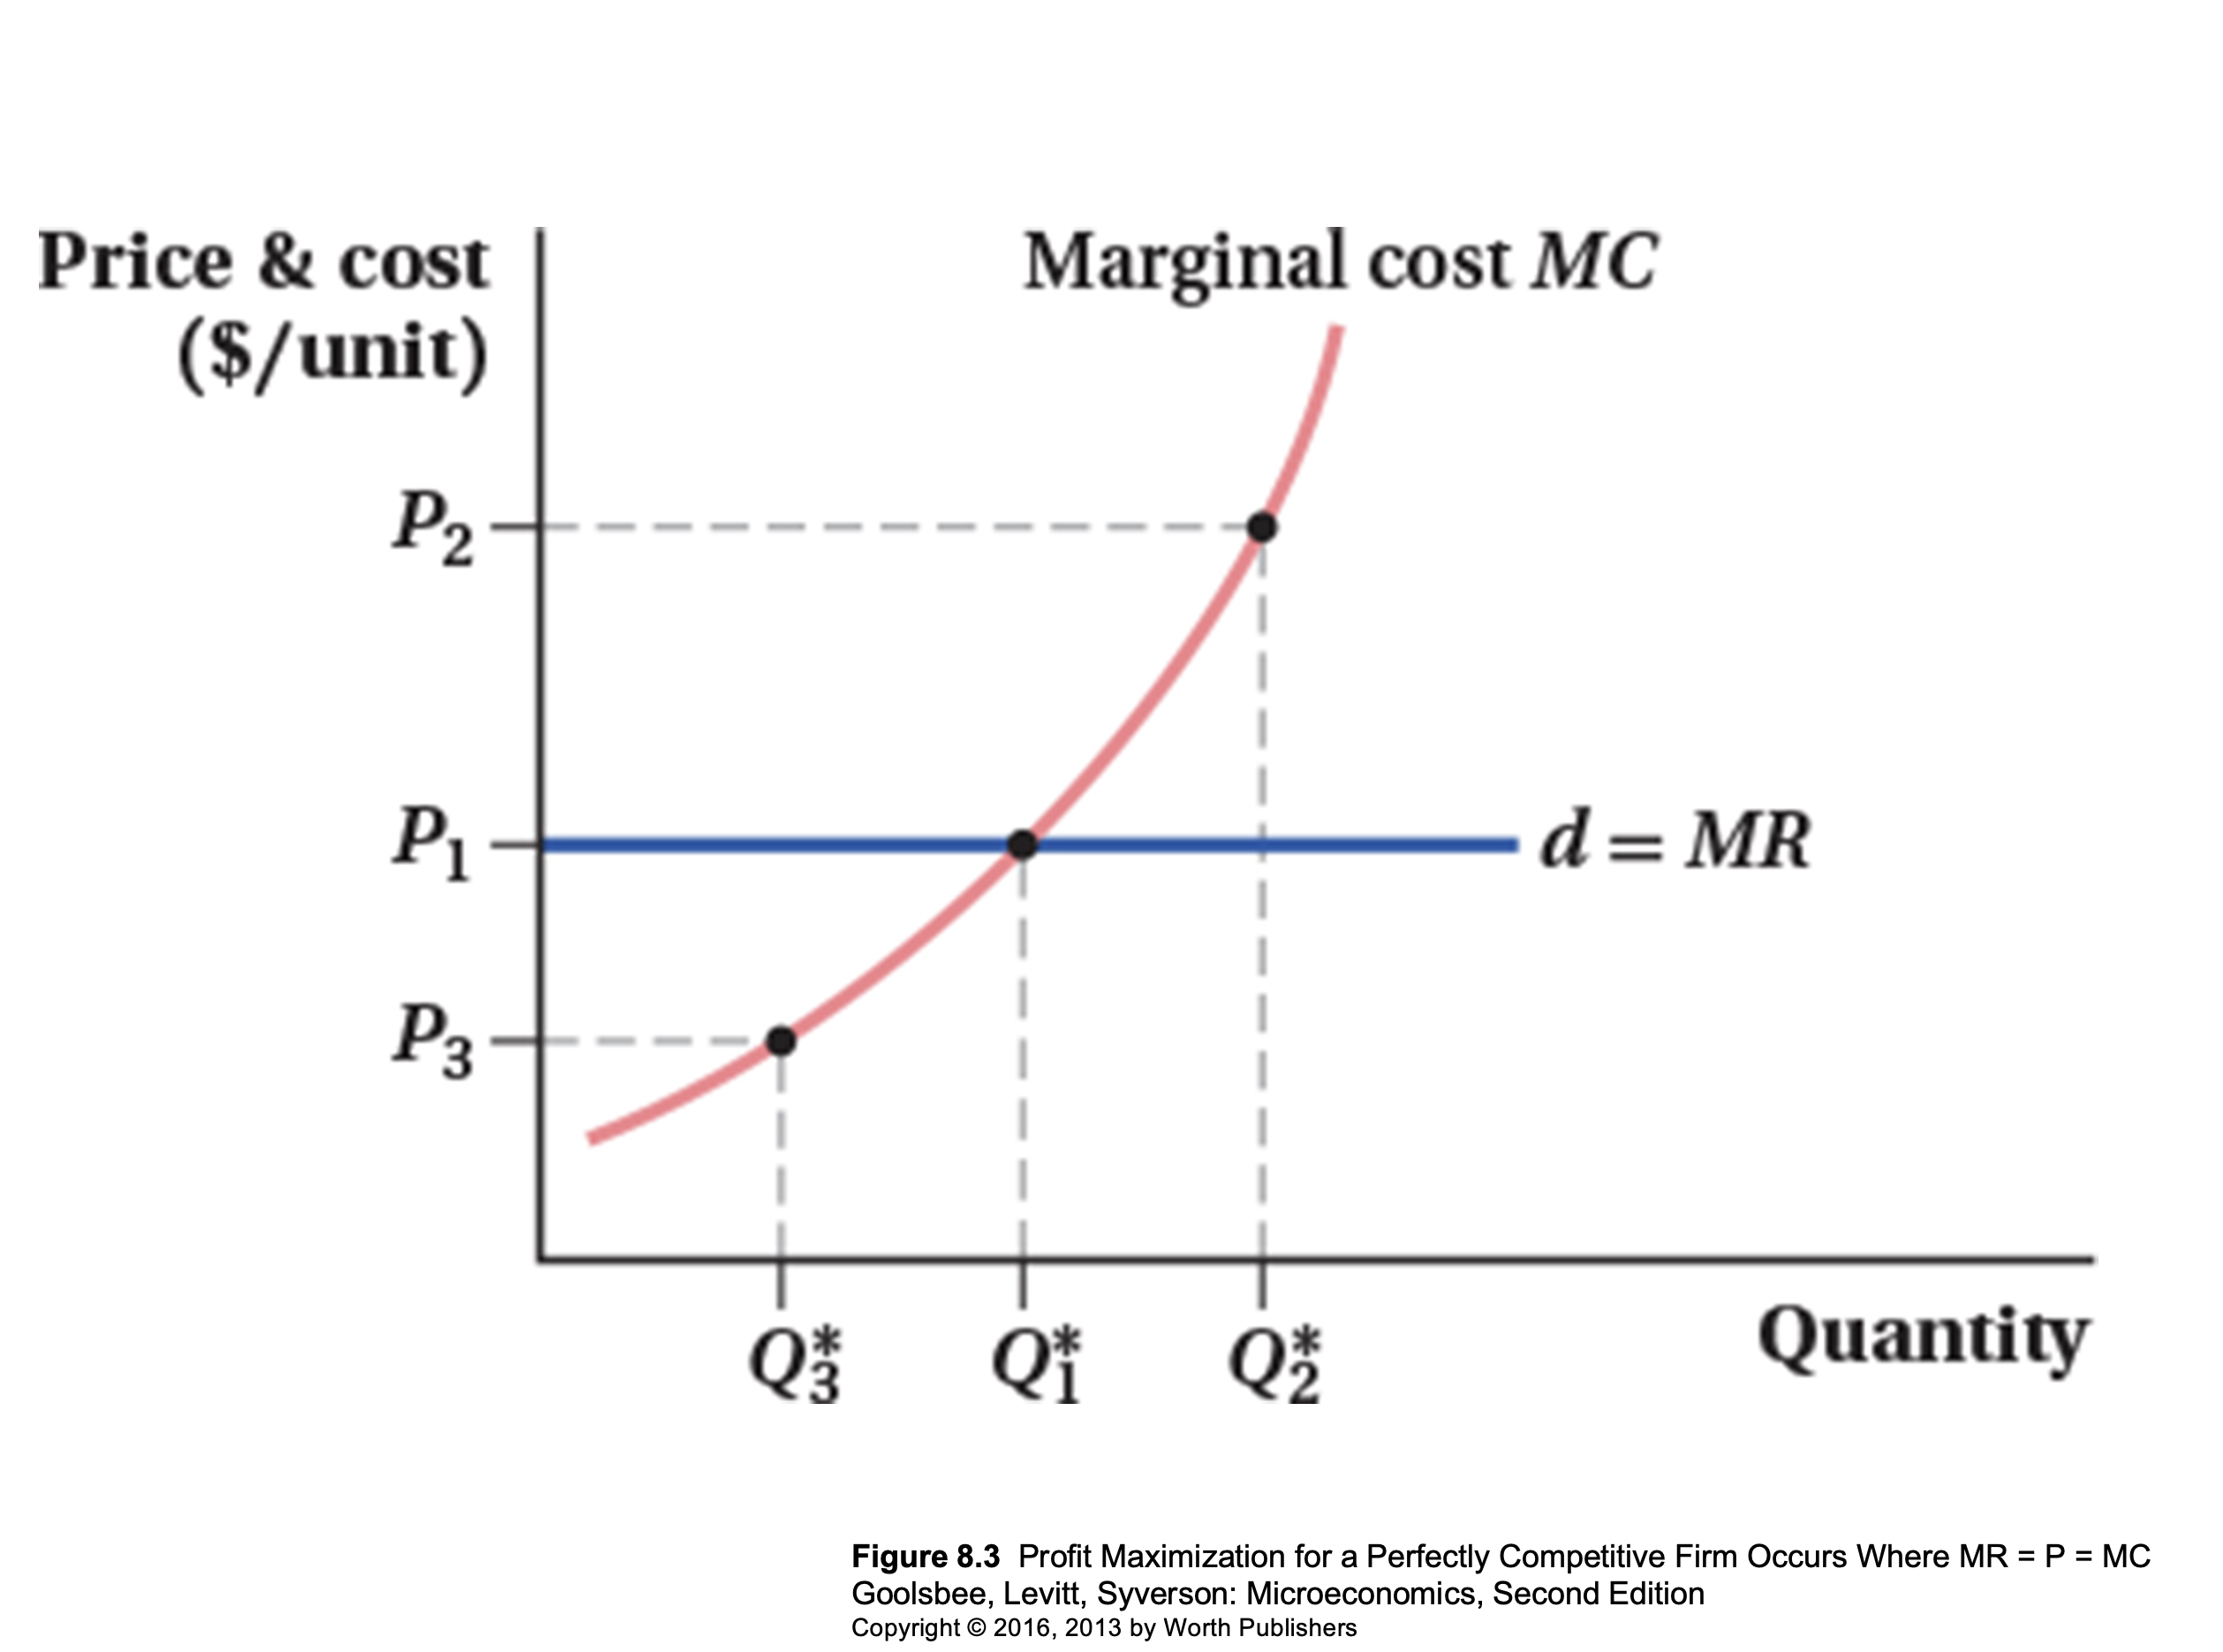
Profits are maximized when marginal revenue = marginal cost
After the point where MR=MC, your profits will be negative
Supply = MC, total cost optimized
Market Equilibrium
the intersection of the demand and supply curves
total cost is important as it is the basis of an individual firm’s supply curve
upward sloping section of the marginal cost curve is the supply curve
Efficiency of demand/supply curves
Supply curves
Optimal combination of cost-minimizing inputs for each level of output
Demand curves
Optimal combination of utility-maximizing goods for a given level of income
Market supply curve
Horizontal summation of a series of individual supply curves
Supply Theory
Supply - total amount of goods and services that producers are willing and able to purchase at a given price in a given time period
Law of Supply
as the price of a product rises, the quantity supplied of the product will usually increase (ceteris paribus)
firms attempt to maximize product by increasing quantity supplied when the price is higher (and vice versa)
Non-price determinants of supply
Changes in costs of factors of production
Prices of related goods
Indirect taxes and subsidies
Future price expectations (producer)
Changes in technology
Number of firms
Shocks
Markets only work when there is strong competition
Market Equilibrium Graphs (supply + demand)
Consumer Surplus (C.S.) - willingness to pay and what they did pay
Producer Surplus (P.S.) - difference between market price and lowest price a producer uses to produce
Assumptions of perfectly competitive markets
all actions (consumers/producers) have access and fully process all relevant information
there are many small buyers and producers - all with equally negligible market power
all actors are rationally self-interested
Welfare - theoretical surplus value left with different economic agents (consumers, firms, governments)
Production - market clearings
Optimal Allocation
MR = MB (marginal benefit)
Social surplus = consumer + producer surplus
In a perfectly competitive market, social surplus is at its largest
Analysis of surpluses are called “welfare analysis”
Price Mechanism Functions
A - allocation (resources are allocated to those who need it most)
R - rationing (not everyone in the market gets what they want, only those who have the same valuation of the product as the firms)
S - signaling (communication of information that drives other factors)
I - incentive (capitalist system is driven by incentives)
2 Demand Curves
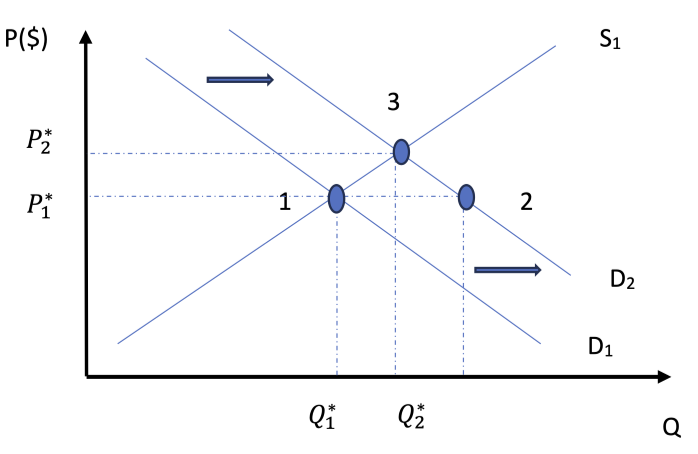
2 Supply Curves
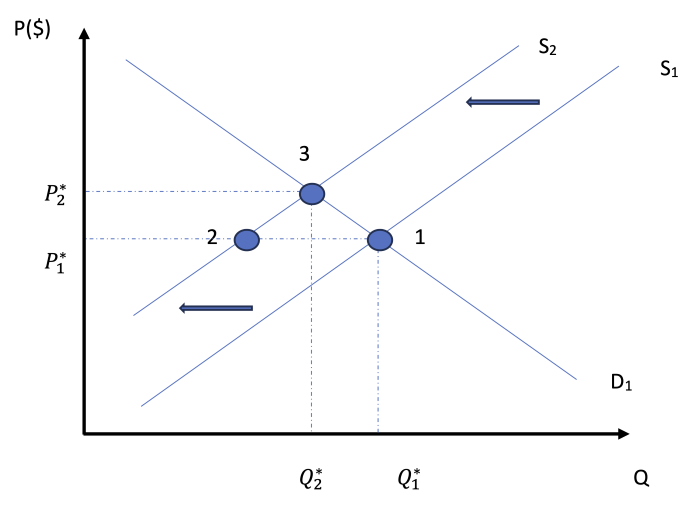
Moving from point 1 to point 3 on both graphs
Point 2 has excess supply/demand
ARSI to move to the new equilibrium point
At both equilibriums, there is optimal allocation
Structure of Microeconomics
How do consumers and producers make choices in trying to meet their economic objectives?
Demand
Supply
Competitive market equilibrium
Elasticities of Demand
Elasticities of Supply
Critique of the maximizing behavior of consumers and producers
interaction between consumers and producers determine where resources are directed
welfare is maximized if allocative efficiency is achieved
constant change produces dynamic markets
consumer and producer choices are the outcome of complex decision making
When are markets unable to satisfy important economic objectives - and does government interaction help?
Role of government in microeconomics
Market failure
externalities and common pool or common access resources
public good
asymmetric information (imbalanced information held by consumers and/or consumers)
market power (single/small number of suppliers)
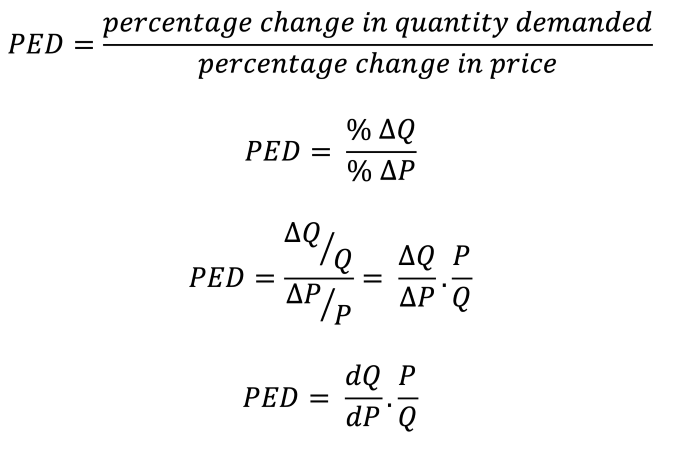
Price Elasticity of Demand (PED)
measure of the responsiveness of the quantity demanded of a good subject to the change in price
Percentage change and differentiation to calculate
the greater the PED, the more sensitive the quantity demanded is to changes in price
PED = percentage change in quantity demanded / percentage change in price
|PED| > 1 demand is relatively elastic
|PED| < 1 demand is relatively inelastic
|PED| = 0 demand is unitary
PED = ∞ perfectly elastic (horizontal demand curve)
quantity demanded responds infinitely to changes price
PED = 0 perfectly inelastic (vertical demand curve)
fixed price: quantity demanded does not change at all when price changes
How can PED change along a straight line?
as you move along the x-axis, it gets less elastic
as quantity increases, elasticity decreases
Determinants of Price Elasticity of Demand (PED)
number of close substitutes
more subtitutes = increased price sensitivity
substitution effect
luxuries VS staples
higher proportion of income spent on the good = increased price sensitivity
expensive good alerts the consumer more when price changes
necessity
if consumers really need the product (ex: food), then they will not change their quantity demanded when price changes therefore inelastic
time
purchases made with longer time periods are generally more elastic
short-run → less elastic, long-run → more elastic
How does PED change across income levels?
more elastic for lower income groups
increased necessity and proportion of income for each good
elasticity depends on the good (price-quantity relationship)
quantity demanded changes, but not the demand curve
“staples” are essential, less elastic
necessity, not many close substitutes, cheap
Applications of PED
pricing decisions by firms regarding price changes and effects of a change of price on total revenue (TR) → price * quantity
inelastic → % change in Q < % change in P
when TR rises, P rises and vice versa
government decisions regarding indirect taxes
elastic → % Q > % P
if an indirect tax is applied, unemployment could increase due to the decreased revenue for firms when they change the price with the tax
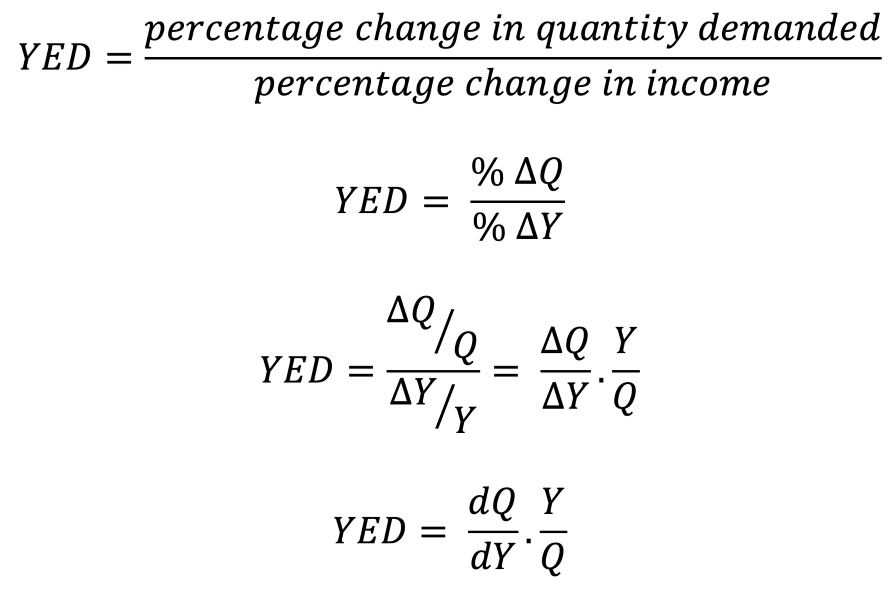
Income Elasticity of Demand (YED)
measure of how much demand for a product changes when there is a change in the consumer’s income
YED = percentage change in quantity demanded / percentage change in income
|YED| > 1
income-elastic
luxury goods
% change in D > % change in income
|YED| < 1
income-inelastic
necessity goods
% change in D < % change in income
YED to categorize inferior and normal goods
normal good → when income increases, demand increases
positive YED value
inferior goods → when income increases, demand decreases
negative YED value
Engel Curve
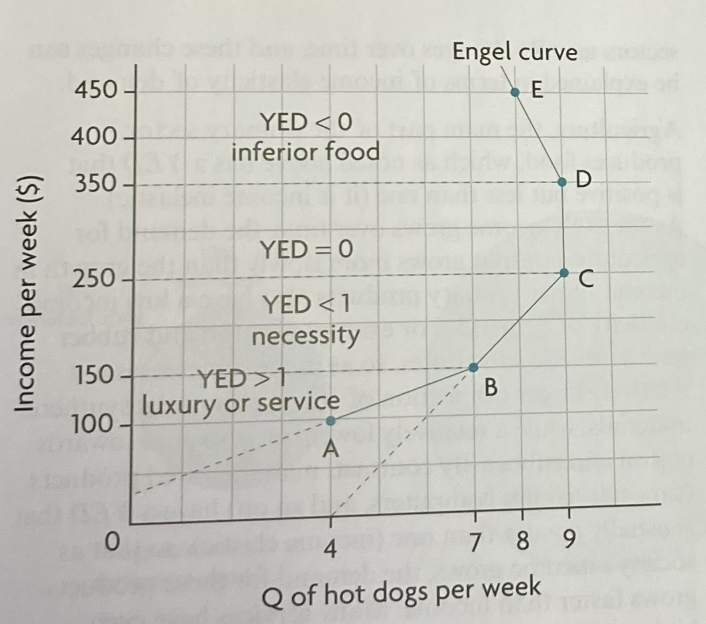
axes → income and quantity
|YED| > 1 luxury/service, |YED| < 1 necessity
YED > 0 normal good
YED < 0 inferior good
quantity demanded when income increases also increases then diminishes and goes backwards
if you continue a segment AB with the same slope and that line cuts the y-axis, then it is a luxury
if it cuts the x-axis, it is a necessity
only works on income = y and quantity = x
Primary Commodities
raw materials (cotton, coffee)
inelastic demand (they are necessities)
consumers are not everyday households, but manufacturers
Manufactured Goods
made from primary commodities
more elastic, as there are more substitutes
Why is YED important?
For firms:
products with a high YED will see a demand increase when income increases (used to see maximum profit based off changes in income)
allocation of resources to fit income groups in products
if income falls, production of inferior goods increase because of YED rules
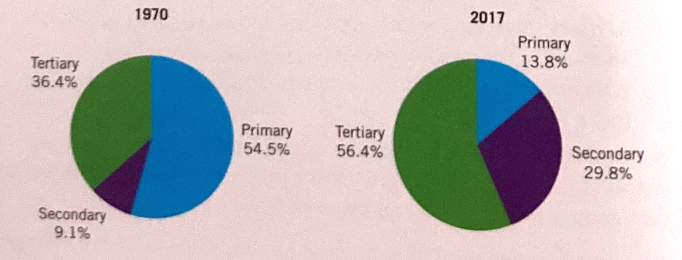
Sectoral changes
primary sector: agriculture, fishing, extraction (forestry, mining)
secondary sector: manufacturing, takes primary products and uses them to manufacture producer goods (machinery, consumer goods) also includes construction
tertiary sector: service, produces services or intangible products (financial, education, information, technology)
shifts in the relative share of national output and employment
as countries grow and living standards improve, there is a change in proportion of the economy that is produced
extra income is spent on manufactured goods as the demand is more elastic than the primary products (using YED to measure/verify) ← same goes for the service sector
Price Elasticity of Supply (PES)
sensitivity/responsiveness of quantity supplied to changes in price
PES = percentage change in quantity supplied / percentage change in price
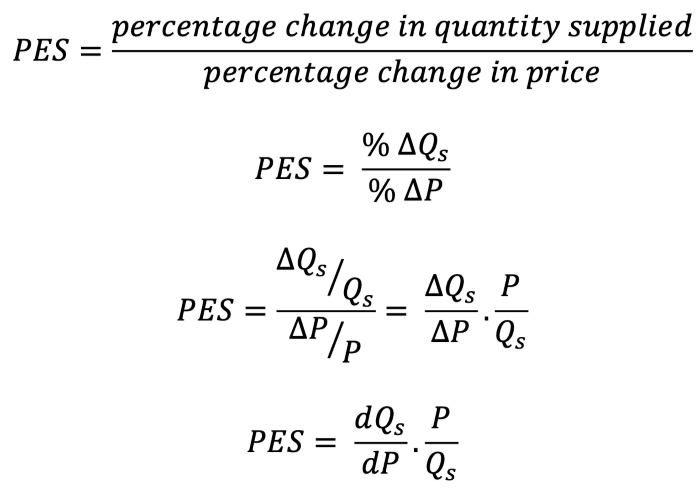
PES > 1 relatively elastic
PES < 1 relatively inelastic
same rules as per PED except no absolute value because of positive relationship between price and quantity supplied
Determinants of F
time
producers cannot adjust quantity supplied quickly
short-run → inelastic, long-run → elastic
mobility of factors of production
easy to swich between production → more elastic and vice versa
unused capacity
if there is a sudden increase in quantity demanded, then firms can use unused capacity to increase production
more unused capacity → more elastic
inventory/ability to store stocks
the more there is in stock, the easier it is to distribute a product if demand increases
more inventory → more elastic
Primary commodities → relatively inelastic
takes time to grow/extract which makes it more difficult to increase production
not always easy to store → time
Manufacture products → relatively elastic
easier to increase production and/or keep inventory
2.4 - Behavioural Economics
Assumptions of Rational Consumer Choice
free markets are built on the assumptions of rational decision making
in classical economic theory, rational means economics agents are able to consider the outcome of their choices and recognise the net benefits of each one
rational agents - will select the choice that reaps highest benefit/utility
Rational choice theory - individuals use logic and sensible reasons to determine the correct choice (connected to an individual’s self-interest)
Consumer Rationality
assumption that individuals use rational calculations to make choices which are within their own best interest (using all information available to them)
Utility Maximization
economic agents select choices that maximize their utility to the highest level
Perfect Information
information is easily accessible about all goods/services on the market
individuals have access to all information available at all times in order to make the best possible decision
Limitations of Assumptions of Rational Consumer Choice
behavioural economics recognizes that human decision-making is influenced by cognitive biases, emotions, social, and other psychological factors that can lead to deviations from rational behaviour
individuals are unlikely to always make rational decisions
5 limitations are shown below:
Biases
biases influence how we process information when making decisions = influence the process of rational decision making
example: common sense, intuition, emotions, personal/social norms
Types of Bias
Rule of Thumb - individuals make choices based on their default choice gained from experience (ex: same product from same company, but not the best possible choice)
Anchoring and Framing - individuals rely too heavily on an initial piece of information (anchor) when making subsequent judgements or decisions (ex: car dealer says car is worth $10,000 and you know it’s worth less, but this anchor of information causes you to purchase the car for a higher price)
Availability - individuals rely on immediate examples of information that come to mind easily when making judgements/decisions (causes individuals to overestimate the likelihood/importance of events/situations based on how readily available they are in their memory)
Bounded Rationality
people make decisions without gathering all necessary information to make a rational decision within a given time period
rational decision making is limited because of
thinking capacity
availability of information
lack of time available to gather information
too many choices also cause people to make irrational decisions
example: in a supermarket, there are too many choices of products of the same good, making it difficult to reach a decision
Bounded Self-Control
individuals have a limited capcity to regulate their behaviour and make decisions in the face of conflicting desires or impulses
self-control is not an unlimited resource
because humans are influenced by family, friends, or social settings, it causes social norms to interfere in decision making (does not result in the maximization of consumer utility)
decision making based on emotions → does not yield the best outcome
businesses capitalize on the lack of bounded self-control of individuals when appealing to their target audience to maximize sales
Bounded Selfishness
economics agents do not always act within their own self interest
individuals do things for others without a direct reward
ex: altruism - selflessness without expecting anything in return
Imperfect Information
information is not perfectly accessible due to:
intelluctual property rights
cost of accessing information
amount of information and options available
people make decisions based on limited information
asymmetric information may also lead to decisions based on limited information
when one party has more information than another
Choice Architecture
intentional design of how choices are presented so as to influence decision making
simplifies the decision making process
3 types, as shown below:
Default Choice
individual is automatically signed up to a particular choice
decision is already made even when no action has been taken
individuals rarely change from the default change
Restricted Choice
choices available to individuals are limited which helps individuals make more rational decisions
Mandated Choices
requires individuals to make a specific decision or take a particular action by imposing a requirement or obligation
mandated choices can be used to ensure compliance with regulations or societal norms, making it necessary for individuals to make certain decisions
Nudge Theory
practice of influencing choices that economic agents make, using small prompts to influence their behaviour
firms should use nudges in a responsible way to guide and influence decision making
designed to guide people toward certain decisions or actions while still allowing them to have freedom of choice
consumer nudges should be designed with transparancy, respect for individual autonomy, and clear societal benefits in mind
Profit Maximization
most firms have the rational business objectiveof profit maximization
profits benefit shareholders as they receive dividends and also increase the underlying share price
an increase in the underlying share price increases the wealth of the shareholder
profit maximization rule
when MC=MR, then no additional profit can be extracted from producing another unit of output
when MC<MR, additional profit can still be extracted by producing another unit of output
when MC>MR, the firm has gone beyond the profit maximization level of output and starts making a marginal loss on each unit produced (beyond MR=MC)
in reality, firms find it difficult to produce at the profit maximization level of output
the level may be unknown
in the short term, they may not adjust their prices if the marginal cost changes
MC changes regularly and regular price changes would be disruptive
in the long-term, firms will seek to adjust prices to the profit maximization level of output
firms may be forced to change prices by the competition regulators in their country
profit maximization level of output often results in high prices for consumers
changing prices changes the marginal revenue
Growth
increasing sales revenue/market share
maximize revenue to increase output and benefit from economies of scale
a growing firms is less likely to fail
Revenue Maximization as a Sign of Growth
in the short-term, firms may use this strategy to eliminate the competition as the price is lower than when focusing on profit maximization
firms produce up to the level of output where MR=0
when MR>0, producing another unit of output will increase total revenue
Market Share as a Sign of Growth
sales maximzation which further lowers prices and has the potential to increase market share
occurs at the level of output where AC=AR (normal profit/breakeven)
firms may use this strategy to clear stock during a sale to increase market share
firms sell remaining stock without making a loss per unit
Satisficing
pursuit of satisfactory/acceptable outcomes rather than profit maximization
decision-making approaach where businesses aim to meet a minimum threshold or standard of performance rather than striving for the absolute best outcome
small firms may satisfice around the desires of the business owner
many large firms often end up satisficing as a result of the principal agent problem
when one group (the agent) makes decisions on behalf of another group (the Principal), often placing their priorities above the Principal’s
Corporate Social Responsibility (CSR)
conducting business activity in an ethical way and balancing the interests of shareholders with those of the wider community
extra costs are involved in operating in a socially responsible way and these costs must be passed on to consumers
2.7 - Government Intervention
Why do governments intervene in markets?
Influence (increase/decrease) household consumption
decrease consumption of demerit goods
provide support to firms
earn revenue
influence the level of production of firms
provide support to low-income households
correct market failure
promote equity
Microeconomic forms of government intervention
price controls
indirect taxes
subsidies
direct provision of services
command and control regulation and legislation
consumer nudges
Price controls
price ceiling + price floor
Price Ceiling
maximum price
below equilibrium point
the point where the price ceiling is set is Pmax
at Pmax, firms are willing to supply Qmax but the consumers demand a quantity above Q*
shaded area - 2 triangles, a and b
a = amount by which consumer surplus is reduced
b = amount by which produer surplus is reduced
excess demand shown by the values Qmax - Q1
managed through subsidies and tax breaks → costs
Price Floor
minimum price
above equilibrium point (Pmin)
common in agriculture
areas c, e, f, g, h are government expenditure → excess supply
producer surplus is increased (d+e → b, c, d, e, f)
f = directly from the government to the producers
a price floor creates welfare loss, indicating allocative inefficiency due to an overallocation of resources to the production of goods
society is getting too much of the good
Indirect taxes
imposed on spending to buy goods and services
both consumers and producers pay a share of the tax
firms practically pay the tax
excise taxes - imposed on particular goods/services (ex: imports)
taxes on spending - value added tax (VAT) or goods/services tax (GST)
direct taxes are those directly paid to the government by taxpayers
an indirect tax creates a tax wedge
consumers face a higher price, while producers receive a lower price
Qt - Q* → lost sales (potential sales but they are lost/didn’t happen because of the tax)
Pp - price for producers, marginal cost
area of rectangle = government revenue
Pc - price for consumers
Pc>Pp, so demand decreases
shifts from S → S1
new equilibrium point formed at (Qt, Pc)
2 triangles, a and b
a + b - welfare loss, Dead Weight Loss (DWL)
both disappear, allocative inefficiency
a - consumer surplus loss
b - producer surplus loss
2 prices, C.S. and P.S. at different equilibriums
Subsidies
assistance by the government to individuals (firms, consumers, industries)
results in greater consumer and producer surplus
society loss as government spending on subsidy
loss from government spending is greater than the gain in surplus
welfare loss (allocative inefficiency) due to overallocation of resources to the production of goods (overproduction)
Pp and Pc switched (from indirect taxes), as consumers pay less and producers receive more
a = dead weight loss (DWL) due to overproduction
supply curve shifts (S → S1) because of one of the non-price determinants of supply (subsidies)
S1 = S + subsidy
2.8 - Market Failures
externalities are market failures, both positive and negative
also known as spillover effects
positive externalities: MS > MP at all levels of output up to the socially optimal level
negative externalities: MS < MP at al levels of output up to the socially optimal level
Merit Goods
goods that are beneficial to consumers but people do not consume enough
people underestimate/ignore potential benefits, caused by imperfect access to information
causes the demand to be lower than it should be
rivalrous and excludable
rivalrous → consumption of a merit good reduces amount available to others
excludable → possible for suppliers to prevent non-payers from benefitting from them
examples: healthcare, education
Positive externality of consumption
goods that when consumed, both the consumer and third parties benefit from it (external benefits)
ex: healthcare
MSC - marginal social cost
MPB - marginal private benefit
MSB - marginal social benefit
in a free market, people would consume where MPB=MSC (Q1, P1)
(Q*, P*) where MSB=MSC is the socially optimal level (potential welfare gain) because from Q1-Q*, MSB>MSC
if MPB shifts from Q1-Q* (toward MSB), then the welfare loss is gained (potential welfare gain = welfare loss)
MPB<MSB because there is an underconsumption of the merit good, and therrefore the shaded area above (potential welfare gain) is not gained by the society indicating a market failure
can be regarded as a welfare loss
underallocation of resources to this market (underproduction)
Government “fix”to positive externality of consumption
increasing consumption of merit goods
subsidies/direct provision
shifts the MSC curve rightwards
new socially efficient level at Q* but at a lower price (P2)
P2 < P1 < P*
improving information (merit goods)
legislation: government passing laws that force citizens to consume the good
Positive externality of production
production of a good creates external benefits for third parties
ex: human capital: training employees
MPC - marginal private cost
produces where MPC=MSB, where Q1 is located (Q1 < Q*)
if production increases to Q*, there is a welfare gain (welfare loss turned into welfare gain)
since MSC>MPC, there is an underconsumption of the merit good
underallocation of resources → market failure, allocative inefficiency
Government “fix” to positive externality of production
subsidies
causes MPC to be shifted downwards
full subsidy causes MPC=MSC when shifted
direct provision
high cost
offering training through the state for firms causes MPC=MSC
Demerit Goods
goods that are harmful to the consumer but people still consume either because they are unaware of or ignore the potential harm
caused by imperfect information
demand is higher than it should be
creates negative externalities when consumed
example: cigarettes, alcohol, gambling, junk food, drugs, prostitution
Negative externality of consumption
consumption of a demerit good causes adverse effects to third parties
ex: second hand smoking
in a free market, people maximize their private utility so they consume at MPB=MSC
there is a welfare loss as MSC>MSB from Q*-Q1
overconsumption of demerit goods
too many resources allocated to this market (demerit)
Government “fix” to negative externality of consumption
indirect taxes
taxes reduce consumption (DIAGRAM INCORRECT, CHECK TEXTBOOK)
legislation/regulation
making laws against the overconsumption of demerit goods
education/raising awareness
Negative externality of production
production of a good negatively impacts third parties
example: fumes from a factory
MSC<MPC so MPC=MSC+costs
MPC is below MSC, because there is an external cost added to society
producers produce at Q1
from Q1-Q*, MSC>MSB
welfare loss → market failure
Government “fix” to negative externality of production
indirect taxes
closes gap between MSC and MPC (MPC shifts leftward toward MSC to reduce level of consumption of demerit good)
Common Pool Resources
rivalrous and non-excludable (linked to negative externalities)
rivalrous: if one person uses, others cannot at the same level of utility
non-excluable: very difficult to exclude people/groups of people from using
typically natural resources
examples: fishing grounds, forests, atmosphere, etc.
Government “fix” to negative externality of production
international agreements
tradable permits
carbon taxes
legislations/regulations
subsidies
Consequences for Stakeholders
Ronald Coase → transaction costs are a way of attempting to measure the impossible, to measure the charges for externalities
externality = transaction cost; there is a threshold where the transaction cost is too high so it is considered an externality
sometimes when transaction cost is low, government intervention is not needed
Collective self-governance
a solution to the over-use of common pool resources
users take control of the resource and use them in a sustainable way
applies at a local level (small communities)
pressure in small communities to operate within social norms
Ostom’s theories → no authority needed
Carbon Tax VS Tradable Permits
carbon taxes are easier than tradable permits (design + implementation)
carbon taxes are more difficult to manipulate for/against certain groups
carbon taxes do not require as much monitoring
carbon taxes are regressive
affects low-income groups more than high-income groups
tradable permits more easily control the level of carbon reduction
carbon taxes are easier to predict
businesses need certainty to plan for the future
rivalrous → one person consuming the good prevents another from consuming it
excludable → able to stop other people from consuming it once it has been provided
Common Pool Resource - rivalrous and non-excludable
no price signals
Tragedy of the Commons
overuse/over-consumption of the resource which may lead to depletion
Private Good - rivalrous and excludable
Public Good - non-rivalrous and non-excludable
free-rider problem → other people benefit from the good without paying for it
Quasi-public Good - non-rivalrous and excludable
Asymmetric information
when one party has more information than the other
buyers and sellers do not have equal access to information
either the buyer or seller has more information
Adverse Selection
when one party in a transaction has more information on the quality of the good than the other party
Moral Hazard
one party takes risks but does not face the full costs of these risks because the full costs of the risks are borne by another party
Perfect Competition / Rational Producer Behaviour
Suppliers and consumers are made up of equally small individuals
No barriers to market entry or exit
Firms are profit maximizing
Consumers are fully rational and consistent
Products sold are homogenous
Full information throughout the market
cannot set the price:
Imperfect competition - monopolies
monopoly market - where only one supply operates
the assumption of many small suppliers does not hold
1 supplier with absolute control over the market price
monopolist sets price at maximum total revenue
as quantity increases, total cost increases, total revenue increases then decreases
Monopoly
single seller facing many buyers
profit maximization condition: ΔTR(Q)/ΔQ = ΔTC(Q)/ΔQ
MR(Q) = MC(Q)
MR>MC → firm increases Q
MR<MC → firm decreases Q
MR=MC → maximizes profit, cannot increase
to sell more units, a monopolist lowers price
increase in profit = III while revenue sacrificed = I
change in TR = III-I
Area III = P * ΔQ
Area I = -Q * ΔP
change in monopolist profit: P(ΔQ) + Q(ΔP)
MR = ΔTR/ΔQ = (PΔQ + QΔP)/ΔQ = P+Q(ΔP/ΔQ)
MR → P=increase in revenue due to higher volume - marginal units = Q(ΔP/ΔQ): decrease in revenue due to reduced price
AR = TR/Q = PQ/Q = P
price a monopolist can change to sell quantity Q is determined by the market demand curve (the AR curve = market demand curve)
AR(Q) = P(Q)
if Q>0, MR<P and MR<AC (MR lies below demand curve)
firms produce at MR=MC to maximize profits
TR = B+E+F
Profit = B + E
L.S. = A
PED impacts the revenue
inelastic = more revenue
margin drives the average
P=a-bQ TR=P*Q
TR=(a-bQ)Q=aQ-bQ²
dTR/dQ = a-2bQCharacteristics of a monopoly market
single firm in the market
no close substitutes - monopolist’s good or service is unique
high barriers to entry
Long Run - factors of production are constant
Short Run - only labour can change (not land or capital)
Economies of Scale
LRAC = Long Run Average Cost
considered a barrier to entry
as the monopolist increases production, their costs go down as output goes up
if new firms try to compete, they are unable to keep up with the costs of the large firm
Profits
normal (π=0) → 0 profit
entrepreneurship is factored into the costs, so the wages are added into TC
abnormal (π>0)
loss (π<0)
π = TR-TC = (PQ) - (CQ)
π/Q = AR-AC = PQ/Q - CQ/Q = P-C
AR = P, AC = Cnormal profits are defined by the minimum revenue a firm must make to keep the business from shutting down (covers implicit and explicit costs)
in a perfectly competitive market:
there are no profits in the long run
due to free entry + full information
there are economic profits in the short run
P*=AR=MR, all horizontal lines
in a monopoly market:
can change the price but are still bounded by the demand, so AR and MR are no longer horizontal lines as they are in perfectly competitive markets
Perfectly Competitive Profits
for a single firm
normal profits (P*=AC)
MC cuts AC at its minimum
P* = AR = AC (when AR=AC, π=0)
abnormal profits (P*>AC)
AR>AC, so profits are positive (π>0)
sells at Q*
shaded area = profit
loss (P*<AC)
AR<AC, so profits are negative (π<0), so there is a loss
shaded area = loss
Rules for a single firm in a perfectly competitive market
cannot determine price, so they determine the quantity at MR=MC due to the profit maximizing rule
they also determine profit when AR=AC (AR=AC=π=0)
Monopolist Profits
normal profit (π=0)
higher price, lower quantity
profit = difference between AR and AC
Q*=P*=AR=AC, so there is no profits
abnormal profit (π>0)
AR>AC
shaded area = profit
Q* determined where MR=MC, then find AR/D when it is equal to Q*
AC1 determined where AC is when it is at Q*
loss (π<0)
same as abnormal profit, Q*, MR=MC, but AC>AR
shaded area = negative profit = loss because cost > revenue
Unit 3: Macroeconomics
Equality and Equity
Equity → income inequalities are needed to create incentive
Equality → equal distribution of income (minimizing income gap)
Market is unable to achieve equity
Equity → concept/idea of fairness; normative, means different things to different people
inequity is not inequality → distribution of wealth, income, or human opportunity
National Income Accounting
used to measure amount of economic activity in a country
money value of all goods and services produced in a year
can be measured through things like GDP
output method
actual value of all finished goods and services produced each year
prevents double counting
measures level of economic activity
income method
calculates the value of all factor incomes earned in the economy
sum of wages and salaries (labour), rent (land), interest (capital), profits (enterprise) → factors of production
national income (Y) → households receive factor incomes for output produced
expenditure method
total value of all spending
total spending on all newly produced goods and services
comprising C, I, G, and (X-M)
C → spending by individuals and households (largest component)
I → spending by all firms (gross fixed capital formation)
G → spending of the public sector
(X-M) → import expenditure
Circular flow of income
injections → add money to increase size (inc. in G, I, X)
leakages → remove money to reduce size (inc. in savings, tax, import)
Gross National Income (GNI)
GNI = GDP + (income earned abroad) - (income sent abroad)
Aggregate Demand (AD)
AD is the total demand for all goods and services in an economy at any given average price level
value often calculated using expenditure approach
AD = C+I+G+(X-M)
if AD has increased, economic growth has occured (and vice versa)
a 1% increase in C or G is much more significant than a 1% increase in (X-M)
AD curve is downward sloping
whenever there is a change in average price level, there is movement along the AD curve
if there is a change in any non-price determinants of AD, the AD curve shifts
increase in the non-price determinants results in a rightward shift
at every price level, real GDP has increased
Factors of Aggregate Demand
consumption (C)
consumer confidence →
interest rates ←
wealth →
income taxes ←
level of household debt ←
expectations of future price levels →
investment (I)
interest rates ←
business confidence →
technology →
business taxes ←
level of corporate debt ←
government spending (G)
political priorities
economic priorities
net exports (X-M)
income of trading partners →
exchange rates ←
trade policies
Real GDP and GNI
adjusted for inflation
calculated using a price deflator (GDP deflator)
converts current prices to constant prices
Real GDP = (nominal GDP / GDP deflator) * 100
Real GNI = Real GDP + net income earned abroad
Real GDP per capita = Real GDP / population
Real GNI per capita = Real GNI / population
purchasing power parity (ppp)
used to calculate relative purchasing power of different currencies
shows number of units of a country’s currency that are required to buy a product in the local economy, as $1 would buy the same product in the USA
Business Cycle
Recession
two or more consecutive quarters (6 months) of negative economic growth
increasing/high unemployment
increasing negative output gap and spare production capacity
low confidence for firms and households
low inflation
increase in government expenditure (great budget deficit)
Boom
increasing/high rates of economic growth
decreasing unemployment, increasing job vacancies
reduction of negative output gap or creation of positive output gap
spare capacity reduced/eliminated
high confidence = riskier decisions
increasing rates of inflation → usually demand-pull
Alternative Measures of Well-being
OECD Better Life Index → 11 factors
Housing
Jobs
Income
community
education
environment
civil engagement
health
life satisfaction
safety
work-life balance
The Happiness Index → 14 factors (scale from 0-10)
business and economic
citizen engagement
communications and technology
diversity (social issues)
education and families
emotional well-being
environment and energy
food and shelter
government and politics
law and order (safety)
health
religion and ethics
transportation
work (employment)
The Happy Planet Index → 4 factors
well-being → how citizens feel about their life overall (0-10)
life-expectancy → number of years a person is expected to live
inequality of outcomes → inequalities of people in a country (well-being, etc.)
ecological footprint → impact a person has on an environment
Aggregate Demand (AD) Curve
negative relationship between price levels and real GDP
wealth effect
when price levels increase, real value of wealth decreases, decreasing consumer confidence thus reducing demand/output
interest rate effect
increase in price levels leads to a fall in output demanded due to interest rates increasing because of an increased need for money
international trade effect
rising price level causes a fall in exports and a rise in imports due to domestic price increasing but others stay the same
Short Run (SR) and Long Run (LR)
SR in macroeconomics in the period of time when prices of resources are rougly constant/inflexible, in spite of changes in the price level
LR in macroeconomics is the period of time where prices of all resources (labour/wages) are flexible and change with changes in the price level
wages account for the largest part of the firm’s costs of production
SRAS - short run aggregate supply
profitability causes positive relationship between price levels and real GDP (increase in price = increase in output) and with unchanging resource prices, profits increase
Determinants of SRAS:
costs of factors of production
indirect taxes/potential subsidies/supply shocks
LRAS - long run aggregate supply
Monetarist/Neoclassical model
price mechanism
competitive market equilibrium
economy as a harmonious system (automatically tends to full employment)
LRAS is vertical due to changing resource prices
located at Yp (potential GDP) at the full employment level of real GDP
in the LR, economy produces potential GDP, which is independant of the price level
inflationary/deflationary gap - difference between SR and LR equilibrium
inflationary → SR>LR
deflationary → SR<LR
market corrections → either SRAS or AD curve shifts (different price levels, same GDP)
inflationary gap:
deflationary gap:
Keynesian model
equilibrium at different sections means different things (where AD=AS)
Ymax is where there is full employment
economy can be below full employment level, even in the long run
section 1 → AS is perfectly elastic as there is spare capacity (any increase in demand has no direct impact on general price levels)
section 2 → AS is relatively price elastic (upward sloping) as there is pressure of scarce resources as the economy grows
section 3 → AS is perfectly inelastic as there is no longer any spare capacity (all factor resources are fully employed)
any increase in AD beyond full employment level is inflationary
Shifts of the AS curve
Short run
costs of factors of production / indirect taxes
labour costs - wages/salaries account for a significant portion
raw material costs - increase means increase in costs of production
exchange rate - rise means domestic firms can buy imports at a lower price
interest rates - borrowing
bureaucracy and administration - legal procedures and policies
Long run
changes in economy’s quantity of factors of production
improvements in technology
increases in efficiency
changes in institutions
reductions in natural rate of employment
Long Run Equilibria
full employment is not zero unemployment (unemployment always exists)
frictional → certain number of people are in between jobs
seasonal → redundancies are caused by cyclical factors in the year
structural → skills mismatch in certain industries
Monetarist/Neoclassical model
occurs at full employment level of output (potential output)
Keynesian model
increase in AD increases national output without changing the general price level
increased demand for scarce resources and labour shortages cause general price levels to rise as national output increases
full employment level of output
firms compete for highly limited resources
general price increases but GDP is at its max
Macroeconomic objectives
economic growth
low unemployment
inflation
Economic Growth
maximization of the factors of production → quality + quantity
long-term economic growth
above potential level → something is wrong
short-term economic growth
actual output → current level fo real GDP
represented by any point on PPF diagram
actual growth → rate at which actual moves towards potential
short-term → below full level of unemployment
annual percentage change of a country’s output
short-run economic growth
increase in AD (rightrward shift) → Keynesian + Monetarist
increase in SRAS (rightward shift) → Monetarist
long-run economic growth
increase in potential output
achieves both economic growth and full employment
shift of the AS → monetarist + Keynesian
measurements of economic growth
nominal: rate of change in monetary value of GDP
real: accounts for inflation
Consequences of economic growth
living standards
generally leads to higher living standards
higher real income per capita
reduction/elimination of absolute poverty (not able to purchase essential goods)
raises consumption → encourages investment in capital → sustains growth
increased tax revenues (for taxes on expenditure/income) enable government to fund more merit goods
increased consumer spending → higher sales revenue (firms) → greater profits
spending on demerit goods increase → in long run, causes social welfare loss
risk of inflation increases → excessive aggregate demand → negative consequences
environment
creates negative externalities that cause problems to the environment
creates market failures caused by resource depletion
damages social and economic well-being in the long run
resource depletion not always sustainable → intergenerational equities
green GDP → adjustment of a country’s GDP to take into account environment degradation
income distribution
often generates greater disparities in distribution of income/wealth
not everyone benefits from economic growth
example: rich get richer, poor get relatively poorer
greater tax revenues = government redistribution of income/wealth in the economy
Low Unemployment
employment - use of factors of production in the production process
use of labour resources
governments want all available and willing to be employed
formal sector employment → officially recorded employment → workers paying income taxes and contributing to the country’s official GDP
unemployment → exists when forces of demand and supply are in disequilibrium
people are available and willing, seeking work but cannot find a job
inefficiency, non-use of scarce resources in the production process
ADL → aggregate demand for labour
ASL → aggregate supply for labour
those who are able and willing to work at the prevailing market equilibrium wage rate (Wc)
A = employer surplus, B+C = employee surplus, D+E = welfare loss, F = welfare supply
complements economic growth → higher employment = greater national expenditure
raises economic well-being and living standards
increases tax revenues for government expenditure on education/healthcare/infrastructure
prevents workers from leaving the country to find better opportunities (brain drain)
Measuring unemployment and unemployment rate
using number of people officialy unemployed as a percentage of the workforce per time period
unemployment rate = (number of employed / labour force) * 100
labour force - employed + self-employed + unemployed
difficulties of measuring unemployment
hidden unemployment / disguised unemployment → not included in the calculation
discouraged workers → unwilling to work but able to
voluntarily unemployed → not actively searching for work
Underemployment
people are inadequately employed → underutilization of labour force
although technically employed, the underemployed are not at their most efficient
cannot fully use their skills/abilities
Disparities
measure of unemployment ignores disparities such as:
regional → different regions have different rates of unemployment
ethnic → ethnic minority groups struggle more to find a job (higher unemployment)
age → unemployment rates are higher for the young/old
gender → females face a higher rate of unemployment
Cyclical Unemployment
unemployment derived from a downturn in the business cycle (recession)
lack of aggregate demand → fall in national real output → job losses
also referred to as demand deficient unemployment
most severe type of unemployment
results in mass job losses
firms try to control costs, protect profitability, and prevent business failure
represented through a deflationary gap / recessionary gap / negative output gap
difference between full employment and actual level of output (short-run)
closing the gap reduces cyclical unemployment
Natural Rate of Unemployment
equilibrium rate of unemployment
calculating level of unemployment when labour market is in equilibrium
NRU: no involuntary unemployment
some voluntary → some poeple remain out of a job
NRU = structural + seasonal + frictional
Costs of unemployment
personal costs
stress (depression, suicide)
low self-esteem
poverty
family breakdowns
social costs
crime / anti-social behaviour
indebtedness
social deprivation
economic costs
loss of GDP → negative economic growth
loss of tax revenues
increased cost of unemployment benefits
loss of income for individuals
greater disparities in distribution of income and wealth
Low and Stable rate of Inflation
inflation → sustained rise in general price level over time
people spend more to get the same amount
reduces purchasing power and country’s international competitiveness
price stability → general price levels remain broadly constant
net zero inflation, but a low and stable rate
Measuring rate of inflation
consumer price index (CPI) - change in average consumer prices over time
measured on a monthly basis but reported for a twelve month period
collects price data from a range of retail locations
assigns statistical weights (volume + value of quantities purchased)
(total cost of year T / total cost of base year) * 100
Limitations of the CPI
atypical households → CPI measures the ‘average’ household
regional/international disparities → prices vary between countries + average household
different income earners → CPI measures average; high income less affected by inflation
changes in product quality → CPI ignores quality
different patterns of consumption → difficult to apply statistical weights in historical data
time lags → due to huge amount of data needed to construct the CPI
volume / value of quantities purchased → uses quantities purchased instead of percentage of income
Causes of inflation
Keynesian - increase in aggregate demand
Monetarist - money supply
demand-pull → AD must be controlled
example: deflationary fiscal policy → prevents rise in consumption and investment
higher levels of AD
drives up general price levels
excessive aggregate demand (AD increases faster than AS)
might be due to higher GDP per capita, lower unemployment, increase in exports, lower interest rates, cuts in income tax
shown by AD1 → AD2
cost-push → rise in general price level
higher costs of production
shift from SRAS1 → SRAS2
increase in general price levels
reduces national output
higher production costs = raised prices
Costs of a high inflation rate
diminishes ability of money to function as a medium of exchange
uncertainty → reducing consumer and business confidence levels (lowers long run economic growth)
redistributive effects → costs are not equally distributed (ex: people with fixed income)
savings → real value of savings decrease over time (borrowers, lenders)
export competitiveness → exports become more expensive
economic growth → lowers expected real rates of return on capital investments
inefficient resource allocation → higher costs of production
shoe leather costs → customers spend more time looking for the best deals
REUSER → redistributive effects, export competitiveness, uncertainty, savings, economic growth, resource allocation
Causes of deflation
deflation → persistent fall in general price levels over time (inflation rate is negative)
either continual decline in AD or increase in SRAS
Benign deflation → positive effect as economy can produce more (rightwards shift of the SRAS curve) → boosts rational output + employment without raising general price level
deflation can be caused by lower production costs, higher productivity, or higher efficiency
Benign deflation - SRAS1 → SRAS2
also called non-threatening deflation
greater number and variety of goods and services
malign deflation → negative effect (leftwards shift of AD)
AD1 → AD2
associated with recessions and unemployment
harmful to the economy as there is a fall in real GDP
Disinflation
fall in the rate of inflation but prices are still rising
occurs when inflation rate is negative
leads to deflation if not controlled
shown by smaller proportional increase in average prices
Costs of deflation (malign)
uncertainty → increase in value of debts reduces confidence levels
redistributive effects → fall in value of assets and wealth
deferred consumption → postpones consumption (deflationary spiral)
cyclical unemployment / bankruptedness → falling prices/wages = falling AD/confidence
increase in real value of debt
inefficient resource allocation
policy ineffectiveness
Sustainable level of government (national) debt
budget deficit → value of government spending exceeds its revenue (G>T) per time period
government debt = accumulated budget deficits over the years
sustainable level - debt is affordable → paid in the long term
Measurement of government debt
uses percentage of GDP (debt to GDP ratio)
different from nominal/absolute value of debt
Costs of government debt
debt servicing costs - loan repayment plus interest rates incurred in the debt
credit ratings - measure of borrower’s ability to repay a loan
future taxation / government spending - austerity measures
budget deficits are not sustainable in the long run, there must be budget surpluses (G<T) to balance it out
Potential conflict between macroeconomic objectives
low unemployment and low inflatioon
high economic growth and low inflation
high economic growth and environmental sustainability
high economic growth and equity in income distribution
Low unemployment and low inflation
more employment = inflationary pressures
low unemployment creates demand-pull inflation due to increase in AD
full employment creates cost-push inflation due to wage inflation
short run Philips curve (SRPC) shows relationship between inflation and unemployment
demonstrates opportunity cost, either low unemployment or low inflation
trade-off only exists in the short run
stagflation → employment / GDP falls as there is inflation
stagflation and short run Philips curve
increased natural rate of unemployment
stagflation creates a worse trade-off between low unemployment and low inflation
long-run Philips curve (LRPC) is vertical at the natural rate of unemployment (NRU) → no trade-off
attempts to reduce NRU will be inflationary in the long run ((A→B) will cause (B→C))
the increase in costs of production shifts SRPC reverting the unemployment rate back to NRU
High economic growth and low inflation
economic growth → increase in AD in a country
if AD rises faster than AS, there is demand-pull inflation
increase in price levels caused by increase in AD
graph also represents trade-off between low unemployment and low inflation
cost-push inflation can also occur due to the full employment level being reached
firms try to attract the more scarce skilled labour, leading to wage inflation
monetary policy → reduces inflation by raising interest rates or increasing economic growth by cutting interest rates
conflict in use of interest rates, therefore conflict in objectives
sustainable economic growth can exist with low/stable rate of inflation
AS increases with AD
when inflation rises too quickly, it harms consumption and investment
controlled inflation can be helpful for economic growth (increases certainty)
high economic growth leads to an inflationary gap
High economic growth and environmental sustainability
as an economy grows, increased levels of production and consumption can create negative externalities that harm the environment
increased consumption of demerit goods (ex: cigarettes)
increased carbon footprint from increased income because of economic growth
environmentally sustainable economic growth is possible
use of green technologies and renewable energy sources
High economic growth and equity in income distribution
rapid economic growth leads to greater disparities in the distribution of the wealth/income in a country
widening the gap between the rich and the poor
although everyone in the country benefits from economic growth, not everyone benefits in the same way
minimum wage builds less wealth than billionaires
economic growth increases tax revenues, allowing the government to use the revenues to re-distribute income
so long as the tax system is progressive and equitable, there is not necessarily a conflict between economic growth and distribution of wealth
Unequal distribution of income/wealth
income
imbalances of income distributions → very few members of the society enjoying a high concentration of the nation’s income
to compare nations → GDP per capita or GDP in terms of purchasing power parity
wealth
imbalances in the spread of a country’s wealth → very few members account for a disproportionately large proportion of the wealth in a society
wealth → accumulation of assets with a monetary value
Factors that influence difference in wealth
economic factors → high national debt
natural resources → increases GDP per capita
environment → reduces wealth (ex: floods, droughts, etc.)
physical factors → reduces wealth (ex: hot/dry climates)
social factors → limits ability to produce wealth (ex: education)
political factors → determines economic prosperity (ex: war)
Measuring economic inequality
income inequality → relative share of national income earned by given percentages of a population (deciles / quintiles)
uses Lorenz curve and Gini coefficient
Lorenz curve
graphical representation of income/wealth distribution in a country
shows proportion of overall income/wealth accounted by each quintile or decile
this example shows that the bottom 60% of the population holds 20% of the wealth (B)
means the top 40% holds 80% of the wealth
data is cumulative → adds up to 1/100%
Gini coefficient
measures income/wealth inequality by calculating a numerical value of the Lorenz curve
G is between 0 and 1
the higher the value, the greater inequality
A = shaded area, B = area under Lorenz curve
Gini coefficient = A/(A+B)
line of equality has a 45° angle
Poverty
condition of an individual, household, or community/country being extremely poor
not having money to meet basic human needs
food, clothing, shelter, healthcare, education
absolute poverty → unable to afford basic needs for survival
relative poverty → income/consumption level below social norm within a country
differs from country to country
Measuring poverty
international poverty lines (poverty threshold) → minimum level of income to afford basic needs for human survival (below $1.90 a day)
does not take into account access to sanitation/water/electricity
a more accurate measure would be a national poverty line
line value depends on the country (higher national income = higher poverty line)
multidimensional poverty index (MPI)
uses health, education, adn standards of living
considers multiple factors that reduce quality of life
ex: sanitation, child mortality rate, average years of school
Minimum Income Standards (MIS)
lowest amount of income needed for an acceptable standard of living
varies by a country’s people’s standards and economic state
helps people live in a socially acceptable way
in the UK, MIS is used for:
calculating the living wage (minimum wage)
quantitative benchmark for NGO/charities to determine who is in need
calculating costs of bearing/raising a child
helps governments determine level of social security and transfer payments
Difficulties in measuring poverty
how would the national poverty line of very poor countries translate to the IPL?
relative poverty is highly subjective
a permanently low income creates a poverty trap
PPP highly differs with location
Causes of economic inequality and poverty
inequality of opportunity
different levels of resource ownership
different levels of human capital
discrimination (gender, race, etc.)
unequal status and power
government tax and benefit policies
globalization and technological change
market-based supply-side policies
Impact of high income/wealth inequality
brings possibility of higher income for those who work hard which creates incentives for people to work harder → improving labour effort
prospect of earning higher incomes encourages people to invest in education and skill development → imporves labour productivity
entrepreneurial instincts are encouraged as a result of potential to earn higher profits
greater incentives and wealth creation can lead to a higher savings ratio
can be used to fund investments which creates an increase in the economy’s long-term growth and development
creates more social tensions in the form of demonstrations, protests, political unrest, and crime which leads to less investment and labour participation rates
more government spending on transfer payments to sustain the economy
adds to government debt, not directly to the national income
discourages workers from joining labour foce and entrepreneurs from investing
increases voluntary unemployment
affects standard of living
affects social stability
Taxation
progressive tax → higher incomes = higher percentage of tax paid
tax threshold → workers earn a certain amount of income per year before they can be taxed
proportional taxes → percentage of tax paid stays the same irrespective of taxpayer’s income
also called flat rate taxes
regressive taxes → those with a higher ability to pay are charged a lower rate of tax
used to combat inequality in wealth and income
Monetary policy
control and use of interest rates and money supply to influence level of AD and economic activity
overseen by the central bank or designated money authority
interest rates → price of money
Functions of a central bank
executor of monetary policy
government’s bank
banker’s bank
sole issue of legal tender (bank notes or coins)
lender of last resort
credit control
Goals of monetary policy
low and stable rate of inflation (inflation targeting)
inflation target rate → transparent goal to help control inflation
low unemployment
lower interest rates = economic activity increases = increase in AD
reduces borrowing costs so consumer confidence increases
reduce business cycle fluctuations
lower interest rates in a downturn and higher interest rates in booms
promote a stable economic environment for long-term growth
greater degree of certainty and confidence
external balance (imports = exports)
influence the exchange rate
lower interest rates = reducing exchange rate
Money creation
credit creation → banks create money from deposits of savers and borrowers
minimum reserve ratio → limit on amount commercial banks can lend
to limit growth in money supply
money multiplier = 1/reserve ratio (how much deposit increases money supply)
if the central bank wants to limit economic activity and suppress inflationary pressures, the minimum reserve ratio is increased to limit growth in money supply
Tools of monetary policy
Open Market Operations (OMO)
buying/selling of government securities by a country’s central bank
government securities - type of public sector debt to finance government
sale of bonds with promise to repay borrowed money with fixed rate of interest
government securities sold when money supply needs to fall
increased interest (return) rate attracts buyers/investors
contractionary monetary policy → withdraws money from economy
opposite is true (not sold but purchased by central banks)
Minimum Reserve Requirements (MRR)
commerical banks generally want to lend more to profit more, but the central banks require them to keep a certain percentage of their deposits at the central bank
called the minimum reserve ratio or minimum reserve requirement (MRR)
ensures the commercial banks have enough cash for their daily transactions
bank run → most customers withdraw all their cash deposits on any given day
raising MRR limits growth → 1/MRR = money multiplier
Changes in central bank Minimum Lending Rate (MLR)
official rate of interest charged by central bank or loans to commercial banks
also known as base rate, discount rate, and refinancing rate
influences interest rates from commerical banks for lending
if MLR increases, the lending rates increase too → contractionary
Quantitative Easing (QE)
central banks purchase corporate bonds to directly inject money into the economy
the institutions have “new” money and see an increase in liquidity
boosts money supply and promotes lending (increase in AD)
central bank creates money
central bank buys bonds from financial institutions
interest rates reduced
businesses/people borrow more money
businesses/people spend more and create jobs
boosts the eocnomy
Demand and Supply of money
interest rate → return for lenders or price for borrowing (price of money)
Dm → desire to hold money rather than saving it
Sm → total amount of money in the economy
supply is vertical because supply of money is fixed at any given time by central banks
opportunity cost of holding money varies directly with interest rate → fall in interest rates = reduction in opportunity cost of holding money
central banks consider these when deciding supply of money:
state of economy (ex: deflationary gap = reduction in interest rates)
rate of growth of nominal wages (ex: higher labour cost = higher prices = inflation)
business confidence levels (lower interest rates = more incentive for investment)
house prices (most valuable asset)
exchange rate
Real VS Nominal interest rates
interest rate → price of money (cost of credit or return on savings)
nominal interest rate → actual rate agreed on between bank and customer
real interest rate → accounts for inflation
real IR = nominal IR - inflation rate
IR = interest rate
Expansionary monetary policy (loose/easy)
lower interest rates → shifts AD rightwards to close a deflationary gap
AD = C+I+G+(X-M)
C, I, G rise due to cheaper borrowing cost
(X-M) rise due to fall in exchange rate
Contractionary monetary policy (tight)
closes an inflationary gap by increasing interest rates
opposite of expansionary
Effectiveness of monetary policy
limited scope of reducing interest rates when close to zero
low consumer and business confidence
incremental + flexible + easily revertible
short time lags
Fiscal policy
use of taxation and government expenditure strategies to influence level of economic activity
to achieve low unemployment, sustainable economic growth, and low inflation
promotes long-term economic growth and low unemployment through:
government spending on physical capital goods (ex: machinery, buildings, vehicles)
government spending on human capital formation (ex: education, training)
provision of incentives for firms to invest (ex: tax breaks, tax incentives)
Sources of government revenue
taxation → direct and indirect
sale of goods/services from state-owned enterprises
privitization proceeds from sale of government assets
Taxation
government levy on income or expenditure
direct → imposed on income, wealth, or pfoits of individuals/firms
ex: on wages/salaries, inheritance, and company profits
indirect → expenditure taxes on spending of goods/serivces in economy
ex: GST/VAT
Sale of goods and services from state-owned enterprises
state-owned enterprises/nationalized industries → postal, airports, broadcasting
government odes not aim to earn profits so revenue sources go toward paying the costs of providing the good or service
Sale of government assets
selling government-owned assets/enterprises to shareholders in the private sector
hence the alternate name privitization
short-lived policy → limited amount of assets to be sold
Government expenditures
current → spending on goods and services consumed within the current year
also called consumption expenditure
for immediate operations and benefits
ex: wages/salaries, healthcare/education, subsidies, interest repayments
capital → long-term items of spending (public sector investments) that boosts eocnomy’s productivity
spending large amount of money to increase nation’s capital stock
also called fixed capital formation
intended to create future benefits for all members of society
ex: physical infrastructure: roads, tunnels, harbours, airports, schools, hospitals
ideally, the government would borrow money only to fund capital expenditure
fund investment expenditure in the economy
transfer payments → welfare expenses from government to redistribute income
done through funding essential public services
ex: state education, housing, healthcare, social housing, postal services
no corresponding exchange of goods and services (unlike current/capital)
ex: unemployment benefits, state pensions, housing benefits, disability allowances
Goals of fiscal policy
low and stable rate of inflation
using taxation policies to promote price stability
ex: higher tax rates + running a budget surplus = reduction in C+I+G
low unemployment
prevents cyclical unemployment during recessions
reduction in tax rates and/or increasing government expenditure (G)
promote a stable economic environment for long-term growth
promotes long-term economic growth by enabling low taxation
reduce business cycle fluctuations
to reduce impacts of a recession, a budget deficit can be run (expenditure > revenue)
opposite is true with a budget surplus and higher tax rates for a boom
equitable income distribution
done by using high marginal tax rates in a progressive tax system
also can use transfer payments
external balance
X=M
ex: indirect taxers imposed on imports and/or government subsidies for domestic exporters will generally increase external balance: (X-M) → positive, increases GDP
opposite is true creating less external balance
Expansionary/reflationary fiscal policy
used to stimulate economy during a recession
by increasing government expenditure and/or lowering taxes
boosts consumption and investment → rightward shift in AD
Keynesian → no LRAS, believes government intervention is effective and needed
Monetarist → LRAS shows no change in real GDP but increase in price levels (vertical)
Contractionary fiscal policy
reduces economic activity by decreasing government spending and/or raising taxes
limits consumption (C) and investment (I)
used to reduce inflationary pressures during a boom → closes inflationary gap
austerity measures
used to reduce a government’s budget deficit
reductions in government spending and increased taxes
Keynesian multiplier
shows any increase in value of injections results in proportionally larger increase in AD
any increase in any of the injections will increase value of the Keynesian multiplier
injections → stimulates further rounds of spending (spending → income for another person)
ex: government spends money on social housing, leads to many other industries benefitting
the initial money generates a far greater value of final output
leakages → reduce value of Keynesian multiplier: takes money out of the economy
negative multiplier effect → initial leakage leads to greater than proportionate fall in GDP
derterminants of Keynesian multiplier: MPC, MPM, MPS, MPT
marginal propensity to consume (MPC) → proportion of increase in household income that is spent on goods and services rather than saved (MPC = ∆C + ∆Y)
marginal propensity to import (MPM) → proportion of increase in household income that is spent on imports rather than on domestically produced goods/services (MPM = ∆M + ∆Y)
marginal propensity to save (MPS) → proportion of increase in household income saved rather than spent on consumption or imports (MPS = ∆S + ∆Y)
marginal propensity to tax (MPT) → proportion of each extra dollar of income earned that is taxed by the government (MPT = ∆T + ∆Y)
Keynesian multiplier = 1/(1-MPC)
Keynesian multiplier = 1/(MPS+MPT+MPM)
MPC + MPS + MPT + MPM = 1
Effectiveness of fiscal policy
constriants on fiscal policy
political pressures
time lags
sustainable debt
crowding out
when increased government borrowing increases interest rates and creates a reduction in the private sector investment expenditure
G increases but I decreases
strengths of fiscal policy
targeting of specific economic sectors
government spending effective in deep recession
automatic stabilizers
progressive taxes and unemployment benefits
Supply-side policies
long-term government
REAL WORLD EXAMPLES
Policies
Monetary
Expansionary
1990s-2024 Japan implements negative interest rates (near-zero) in response to stagflation and deflation partly due to the aging of the population
Contractionary
1970 United States' Federal Reserve (central bank) and the Great Inflation -> raised inflation rates to 20% to control demand-pull inflation
Fiscal
Expansionary
2009 American Recovery and Reinvestment Act (ARRA) -> during a large demand-deficient recession (The Financial Crisis of 2008), government expenditure was boosted $831 billion dollars to boost aggregate demand which increased employment and the economic growth rate but also increased level of government debt
Contractionary
2008 United Kingdom using austerity measures to combat a budget deficit and stabilize public finances -> cutting public spending (G) and increasing taxes
Supply-side
Market-side
Competition
Deregulation
1978 United States airline industry -> increased competition and boosted market's growth but caused the quality of airlines to deteriorate decreasing safety
Privatization
1972 Singapore Airlines was privatized from the government-owned Malayan Airways and is now one of the world's top airlines
Trade liberalization
NOW Japan imposes up to 778% import taxes on rice to protect agriculture in the country
Anti-monopoly regulation
2019 UK's Competition and Markets Authority (CMA) blocked merging of Sainsbury's and Asda (two largest supermarkets) to prevent forming a monopoly / collusive oligopoly
Labor-side
Reducing the power of labor unions
Reducing unemployment benefits
Abolishment of minimum wages
2024 Turkey increases minimum wage by 49% to reduce inflation rates of 51%
Incentive-related
Personal income tax cuts
NOW Hong Kong personal income tax rates range from 2-17% which provide greater incentives for people to work
Cuts in business tax and capital gains tax (CGT)
NOW Hong Kong business tax rates range from 7-16.5% and there is no CGT which makes Hong Kong attractive to businesses
Interventionist
1960-1980 South Korea's government implemented plans focusing on education, infrastructure, and technological advancements and now they are a leading industrial power
The Global Economy
Gains from trade (5/8/24)
international trade → buying and selling goods/services across international borders
impacts GDP calculations (exports → X, imports → M)
GDP=C+I+G+X-M
countries export products when the domestic price is lower than the world price (Pd<Pw)

30 = quantity demanded domestically
50 = quantity supplied domestically
there is a surplus as quantity supplied exceeds quantity demanded (at the world price) which causes the country to export the surplus (20)
countries import products when the domestic price is higher than the world price (Pd>Pw)

90 = quantity demanded domestically
20 = quantity supplied domestically
there is a shortage as quantity demanded exceeds quantity supplied (at the world price) which causes the country to import the shortage (70)
free international trade (free trade) → trade without any restrictions
no government intervention
effects:
maximizes competition
provides most benefits
benefits from international trade
producers
greater efficiency
access to capital
access to more/better resources
access to larger markets
economies of scale
consumers
lower prices
competition increases supply and incentivizes efficiency
greater choice
access to more/better products (not always better)
countries
foreign exchange
efficiency in resource allocation
specialization
do what you do best and trade for the rest
increased economic growth
access to technology, skills, ideas
peace
Absolute and Comparative advantage (6/8/24)
absolute advantage → ability of one country to produce a good using fewer resources than another country
that country can produce more of a good than another country when given the same resources
theory of absolute advantage (Adam Smith) → specialization and trade make countries better off
allows for increased competition in both countries
point E and point F → with trade
both countries consume more than they would have been able to produce
comparative advantage → ability of one country to produce a good at a lower opportunity cost than another country
lower relative cost
theory of comparative advantage (David Ricardo) → all countries can benefit from specialization and trade
allows for increased consumption in both countries
applicable even when one country has absolute advantage in both goods
limitations: (7/8/24)
interferes with necessary structural changes over time
developing countries need to transition out of the primary sector
primary sector → low value added so low income (ex: agriculture)
excessive specialization is risky
overspecialized countries are vulnerable to unforeseen changes
depends upon unrealistic assumptions
factors of production are assumed to be fixed
labour and capital are mobile
education and training affects quality
technology is assumed to be fixed
employment of resources is assumed to be full
free trade is assumed
products are assumed to be homogenous
transportation costs are ignored
law of comparative advantage → results in greater global output and consumption beyond the PPC
only works when either one country has one absolute advantage and/or countries face different opportunity costs
both countries consume more than they could have produced (cottonia at B, microchippia at A)
case of parallel PPCs
one country has absolute advantage in the production of both goods
both countries face equal opportunity costs in the production of both goods
comparative advantage does not exist → no benefit to specialization and trade
very unusual
sources of comparative advantage (7/8/24)
differences in factor endowments (factors of production)
used in manufacturing
helps determine what a country should specialize in
differences in levels of technology
impacts efficiency and productivity
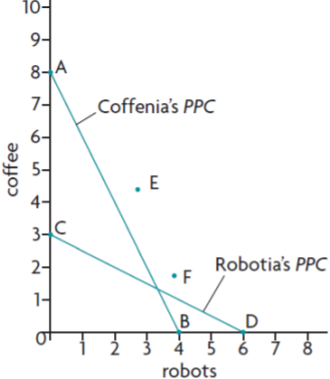

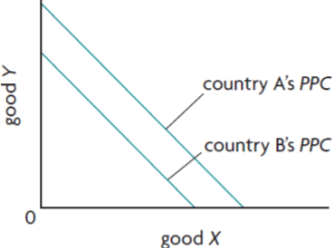
Tariffs (12/8/24)
trade protection → government intervention in international trade
use of trade restrictions (trade barriers)
prevention of imports (despite comparative disadvantage)
tariff → tax on imported goods (customs duties)
most common form of trade restriction
protects domestic industries from foreign competition → inefficiency
generates tax revenue (government)
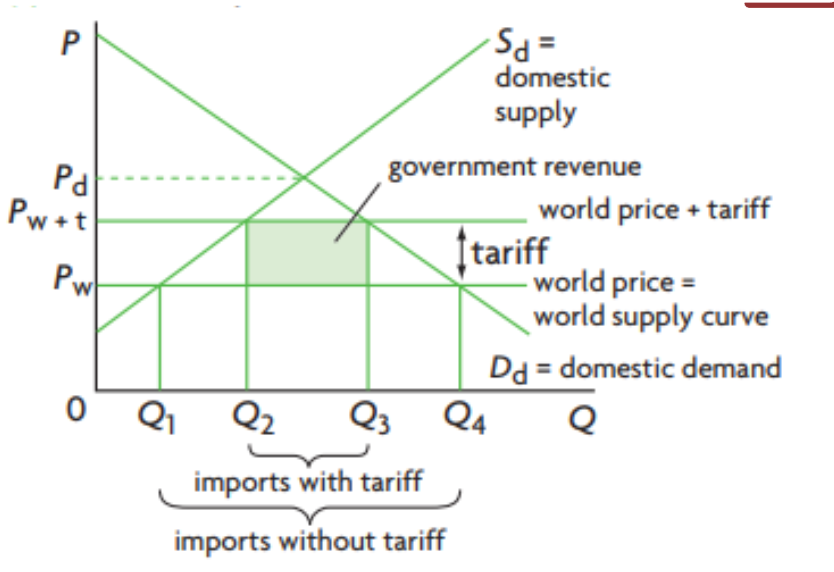
winners → less efficient domestic producers, efficient domestic producers, domestic employment, foreign producers, domestic income
losers → domestic consumers, foreign producers, domestic income distribution (regressive tax), global efficiency, resource allocation
regressive tax → same % tax but greater % of income depending on income level
ex: $100 tax is different %income for different people
welfare effects (economic well-being)
consumer surplus (CS) → reduced
transferred to government, producers, or just lost due to inefficiency and reduced consumption
producer surplus (PS) → increased
taken from consumers
social surplus is reduced (total)
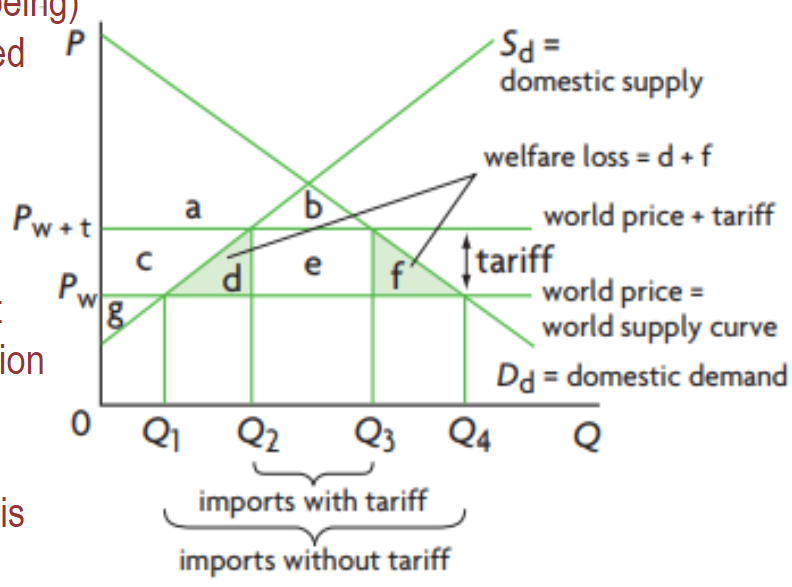
was → CS=a+b+c+d+e+f, PS=g
now → CS=a+b, PS=c+g. DWL (deadweight loss)=d+f, government revenue=e
Import Quotas (13/8/24)
legal limit on imports
limits quantity of a certain good over a particular period of time (ex: 1 year)
limits foreign competition for domestic industries
government issues a limited amount of “import licenses”
not license like driving license, more like tickets
recipients gain quota revenues (quota rents)
importers buy at Pw and sell at Pd (Pd>Pw) OR were selling at Pw and are now selling at Pd (foreign producers)
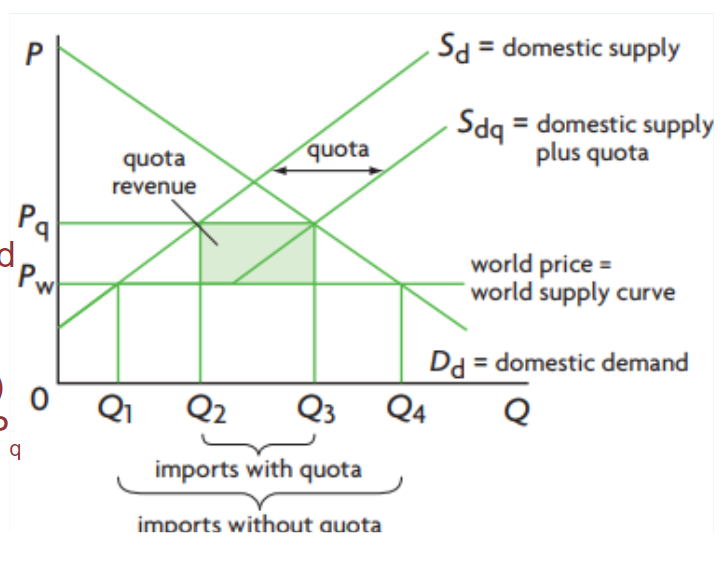
winners → efficient domestic producers, less efficient domestic producers, domestic employment, holders of licenses
losers → domestic consumers, domestic income distribution, global efficiency, resource allocation
neutral → government
no revenue generated, unlike tariffs
uncertain: foreign producers
might balance out (wins and losses)
Pd>Pw, but less quantity can be imported → depends if they have a license
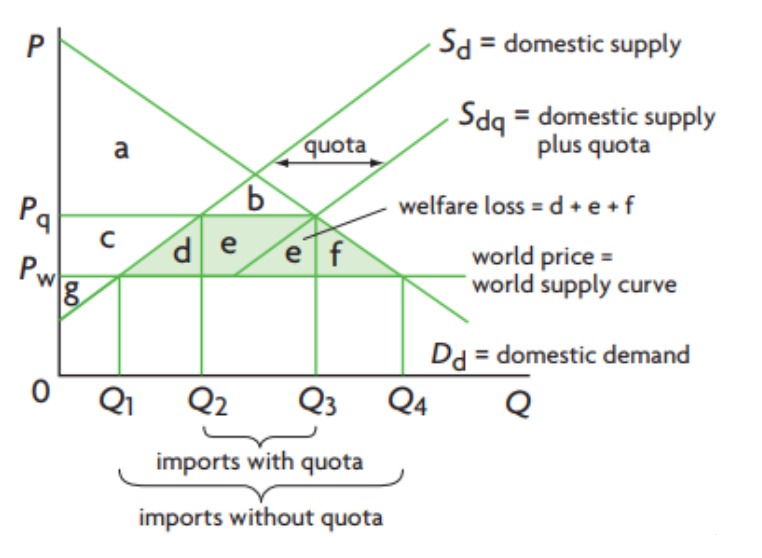
welfare effects (economic well-being)
CS is reduced
PS increases
was → CS=a+b+c+d+e+f, PS=g
now → CS=a+b, PS=c+g, DWL=d+e+f
DWL comes from inefficiency and reduced consumption
social surplus is reduced
Tariffs and Quotas (14/8/24)
tariff VS quota
same but tariffs generate tax revenues (less DWL)
therefore tariff > quota
tariffs
domestic consumers: higher price, lower quantity (-)
domestic producers: higher price, increased quantity (+)
government: increased revenue (+)
foreign producers: decreased quantity sold (-)
welfare loss: inefficiency and reduced consumption (-)
import quotas
domestic consumers: higher price, lower quantity (-)
domestic producers: higher price, increased quantity (+)
government: no impact (…)
foreign producers: higher price (?), decreased quantity (?)
welfare loss: inefficiency and reduced consumption and reduced CS (-)
same as tariff but it moves the supply curve, not the price (price moves with supply)
Production Subsidies (15/8/24)
subsidy → payment by the government to a firm for each unit of output produced
production subsidy → protects domestic firms from foreign competition
export subsidy → protects domestic firms that export to foreign countries
subsidy is the effect of production, not the cause (incentivizes)
production subsidy → protectionist measure that pays domestic firms for each unit of output produced
allows firms to remain competitive against imports
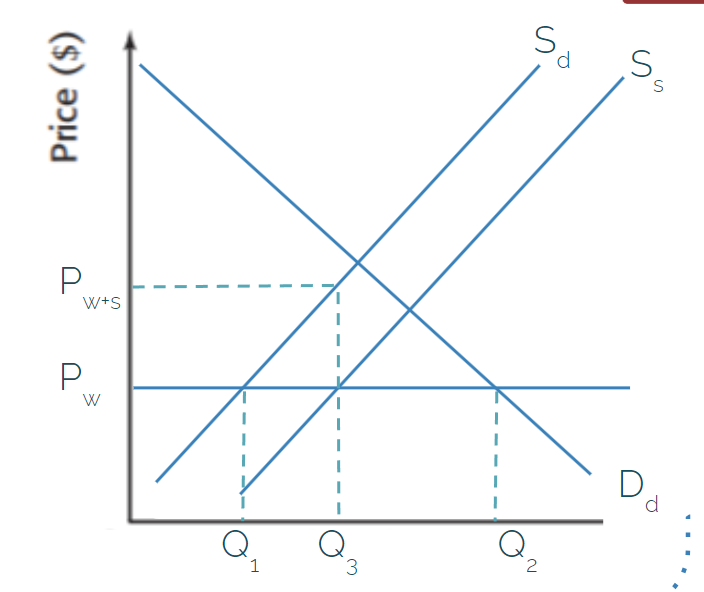
domestic consumers pay Pw, domestic firms receive Pw+s
shifts the product supply curve
by the amount per unit subsidy
all output for domestic market only
winners: efficient domestic producers, less efficient domestic producers, domestic employment
losers: foreign producers, government budget, taxpayers, global efficiency, resource allocation
neutral: domestic consumers
face the same price regardless
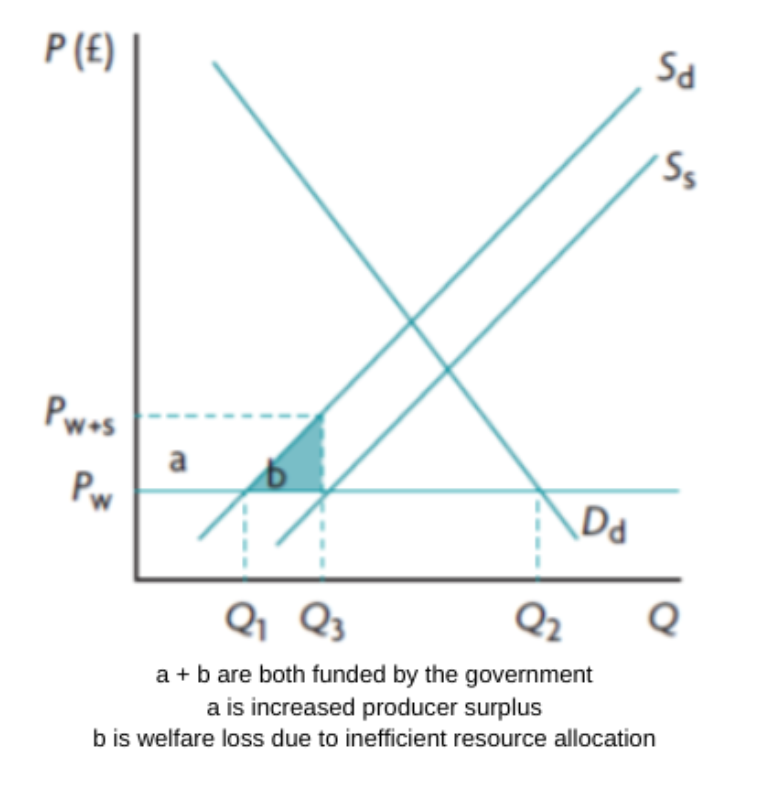
welfare effects
CS is not affected
PS increases at the expense of the government
DWL from inefficient production
Export Subsidies (19/8/24)
protectionist measure that pays domestic firms for each unit of output produced and exported
allows exporting firms to compete in foreign markets (Pw>Pd)
the world price stays the same, domestic supply curve shifts
increases domestic price to Pw+s
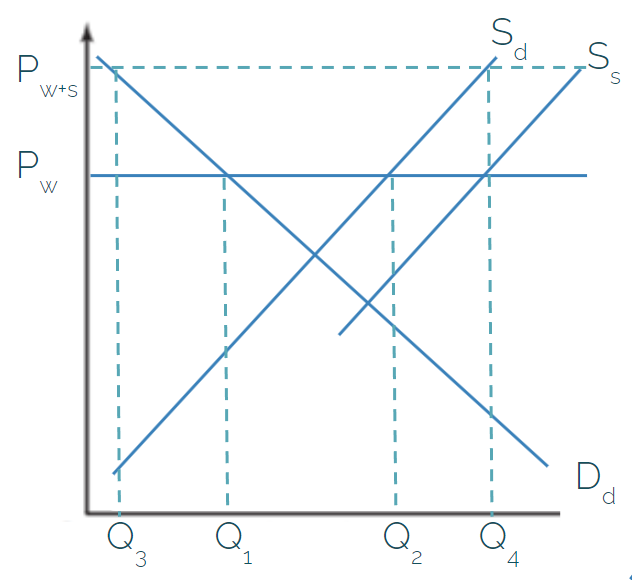
winners: efficient domestic producers, less efficient domestic producers, domestic employment
losers; domestic consumers, government budget, taxpayers, domestic income distribution, foreign producers, global efficiency, resource allocation
domestic producers face two prices when the export subsidy is implemented
foreign market → Pw + subsidy (Pw+s)
domestic market → Pw
domestic < foreign, so they choose the foreign market
forces domestic producers to match the foreign price, which increases price (Pw → Pw+s)
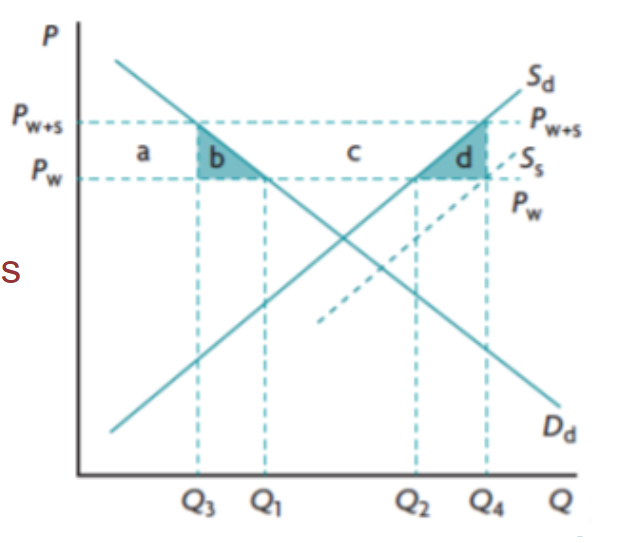
welfare effects
CS is reduced
higher price lower quantity
all transferred to firms (domestic producers)
PS is increased
at the expense of domestic consumers and government
social surplus is reduced
DWL → b+d
Exchange Rates (20/8/24)
the rate at which one currency can be exchanged for another (price of a currency)
number of units of a foreign currency that correspond to the domestic currency
necessary mechanism for international trade to exist
foreign exchange market (FOREX) → global marketplace that allows for the trading of one currency for another
necessary for international transactions
supports the continuous flow of money in and out of countries
individuals, firms, banks, governments, etc.
demand creates supply (only in FOREX)
foreign demand = domestic supply since it is exchanging, not buying
if I buy 10 USD for 150k IDR, the demand for USD increases as I am requesting USD in exchange for 150K IDR. at the same time, the supply for IDR increases as I am supplying IDR into the market in exchange for USD.
consequences of currency appreciation (increasing value of particular currency)
imports become cheaper and exports more expensive (decreased net exports)
worsening trade balance (increasing trade deficit)
decreasing cost-push and demand-pull inflationary pressure
cyclical unemployment
indeterminate impact on economic growth
indeterminate impact on living standards
consequences of currency depreciation (decreasing value of particular currency)
imports become more expensive and exports cheaper (increased net expors)
improving trade balance (decreasing trade deficit)
increasing cost-push and demand-pull inflationary pressure (factors of production)
job growth
indeterminate impact on economic growth
indeterminate impact on living standards
The Trade Protection Debate (22/8/24)
arguments for trade protection (trade restrictions) → despite known inefficiencies / misallocation of resources
infant industries → new domestic industry that is without economies of scale (in a developing country)
ex: pharmaceuticals
may disincentivize efficiency (-)
national security → some industries are essential for national defense
not an economic argument, but political/military
ex: aircraft, weapons
may be overextended (ex: steel) (-)
health and safety standards
imported goods might fall short (ex: food, medicine, etc.)
may actually be an administrative barrier (-)
LEDC (least economically developed country) diversification
opposite of specialization
LEDCs are often dependent on a limited number of commodities
difficult to identify (-)
anti-dumping
dumping: selling a good in an international market below the cost of production
due to export subsidies
difficult to justify → may actually be administrative barriers (-)
balance of payments correction
outflow of money > inflow of money
imports > exports
risk of retalliation (-)
arguments against trade protection
misallocation of resources
less efficient markets
retalliation
potential for trade war
increased costs
raw materials and capital are more costly
higher prices
true for tariffs, quotas, and administrative barriers
less Qd
less choice
fewer options to satisfy needs/wants
result of decreased competition
domestic firms lack incentive to become more efficient
lack of competition permits inefficiencies
reduced export competitiveness
inefficient firms must charge more than foreign competition
foreign demand for products is typically greater than domestic
Preferential Trade Agreements (PTA) (26/8/24)
form of economic integration (trade policies that increase interdependence)
agreement to lower/remove trade barriers
ensures easier access to specific markets in 2+ member countries
may include cooperation on additional issues (ex: labor/environmental standards)
promotes trade liberalization
bilateral trade agreement (mutual agreement between 2 countries)
regional trade agreement (according to geographic region)
multilateral trade agreement (legally binding agreement between 3+ countries)
accomplished through the World Trade Organization (WTO)
Administrative Barriers (27/8/24)
protectionist measures that impose bureaucratic standards and regulations on foreign firms
‘red tape’ checks and procedures that create obstacles for imports
overly concerned with procedure at the cost of efficiency/common sense
costly → both time and money
ex: customs inspections/valuations, packaging requirements, strict health/safety/environmental
winners: efficient domestic producers, less efficient domestic producers, domestic employment
losers: domestic consumers, foreign producers, global efficiency, resource allocation
Trading Blocs (2/9/24)
group of countries that have agreed to reduce barriers to trade to encourage free/freer trade
amongst those in the bloc
includes free trade areas, customs unions, and common markets
free trade area (FTA)
group of countries agree to eliminate trade barriers among members
most common intergration → relatively low degree
members can pursue their own policies with non-member countries
creates dependence upon the country with the lowest non-member barriers to trade (-)
I don’t like country O but country A does and I’m in a FTA with A so I’ll get O’s products from A
ex: USMCA, CAFTA, ANZFTA, EFTA
customs union
group of countries agree to eliminate trade barriers among members AND adopt a common policy towards all non-member countries (FTA+)
members act together in all negotiations with non-members
no need for ‘rules of origin’
more complicated (-)
ex: Mercosur, GCC, ECOWAS
common market
group of countries agree to eliminate trade barriers among members AND adopt a common policy towards all non-member countries AND agree to eliminate all restrictions on movement of the factors of production (FTA++)
labour and capital can move freely across borders
most efficient allocation of factors of production
extremely complicated → countries lose autonomy (-)
ex: EU, SACU
possible advantages
increased competition
expansion into larger markets
economies of scale
lower prices and greater choice
increased investment
improved resource allocation
productive efficiency and economic growth
stronger bargaining power (with non-member countries)
peace and political stability
possible limitations
inferior to WTO’s multilateral approach
aims for free trade for all
unequal distribution of gains and some losses
loss of sovereignty
Trade Creation and Trade Diversion (2/9/24)
trading blocs change patterns of trade → through reduced trade barriers
trade between non-member nations is discouraged → through trade barriers
trade creation → higher cost products are replaced low cost imports through a customs union
original products may have imported or domestically produced
combines comparative advantage and trade liberalization
increases consumption, greater productive efficiency, greater allocative efficiency, increases social welfare
trade diversion → lower cost imports (from non-member countries) are replaced by higher cost imports (from member countries) through a customs union
is an argument against trading blocs and for multilateral trade liberalizations (WTO)
decreases consumption, productive inefficiency, allocative inefficiency, decreases social welfare
long-term benefits still (likely) outweigh the costs
political relationships
economic integration
if I trade within my trading bloc, member countries will buy my products too
Monetary Union (3/9/24)
a common market that requires market countries to adopt a single common currency and a common central bank (FTA+++)
responsible for one monetary policy
has strict membership requirements
ex: rate of inflation, interest rate, debt to GDP ratio
many similarities to a fixed exchange system
RWE → EU (eurozone countries)
Evaluation of monetary union (5/9/24)
advantages
single currency encourages price transparency
allows consumers and firms to easily compare prices
promotes competition and efficiency
single currency eliminates transaction costs
conversion fees are always paid → not anymore
encourages trade and investment → supports allocative efficiency
single currency eliminates exchange rate risk and uncertainty
exchange rates typically fluctuate
benefits importers, exporters, consumers, and investors
encourages trade and investment → supports allocative efficiency
single currency promotes inward investment
encourages investment from outsiders → appeal of expanded market and single currency → supports economic growth
low rate of inflation give rise to low interest rates
member countries are deeply concerned with inflation (single monetary policy)
to remain competitive
encourages investment → supports economic growth
encourages consumption spending → increases output
disadvantages
loss of sovereignty
loss of domestic monetary policy
each member country is affected differently by shared monetary policy
varying positions in the business cycle
varying levels of inflation/unemployment
loss of exchange rates as a mechanism for adjustment
unable to depreciate/devalue
when seeking balance of trade / trying to counter inflation
convergence requirements constrain fiscal policy
economic/financial requirements
potentially limiting expansionary fiscal policy
ex: debt deficit limits
The World Trade Organization (WTO) (9/9/24)
the only global international organization dealing with the rules of trade between countries
responsible for WTO agreements
help producers, exporters, and importers conduct their business
negotiated and signed by the bulk of the world’s trading countries and ratified in their parliaments
objectives → lengthy and complex legal trade documents that encourage:
non-discrimination, open trade, predictability + transparency, fair competition, support for LDCs, protection of the environment, inclusion
six functions:
administrating WTO agreements
forum for trade negotiations
handling trade disputes
monitoring national trade policies
cooperation with other international organizations
technical assistance and training for developing countries
criticisms
WTO allows unfavourable treatment of LDCs
MDCs continue to subsidize agricultural products
MDC → more developed countries
MDCs receive greater tariff reductions
exposed to non-tariff barriers
protection of intellectual property increases costs of technology
MNCs not required to purchase supplies locally
MNC → multinational company
WTO fails to distinguish between developed and developing economies
only recognize/protect LDCS → LEAST
developing countries _> infant industry ptoection
developing countries may need to diversify
reduce reliance on primary commodities
WTO ignores environmental issues
encourages removal of trade barriers against countries with low standards
permits subsidies on harmful products (ex: agriculture, coal, transporation)
WTO ignores labour issues
ex: child labour
WTO members have unequal bargaining power
LDCs often silent in fear of retalliation
includes agenda setting
Floating exchange rates (18/9/24)
an exchange rate determined entirely by market forces
supply and demand determine equilibrium (Qd=Qs)
no government intervention
no central bank interaction
free float / flexible exchange rate
downward sloping demand curve
currency demand occurs when there are inflows of foreign currencies into a country
upward sloping supply curve
currency supply occurs when there are outflows of domestic currency out of a country
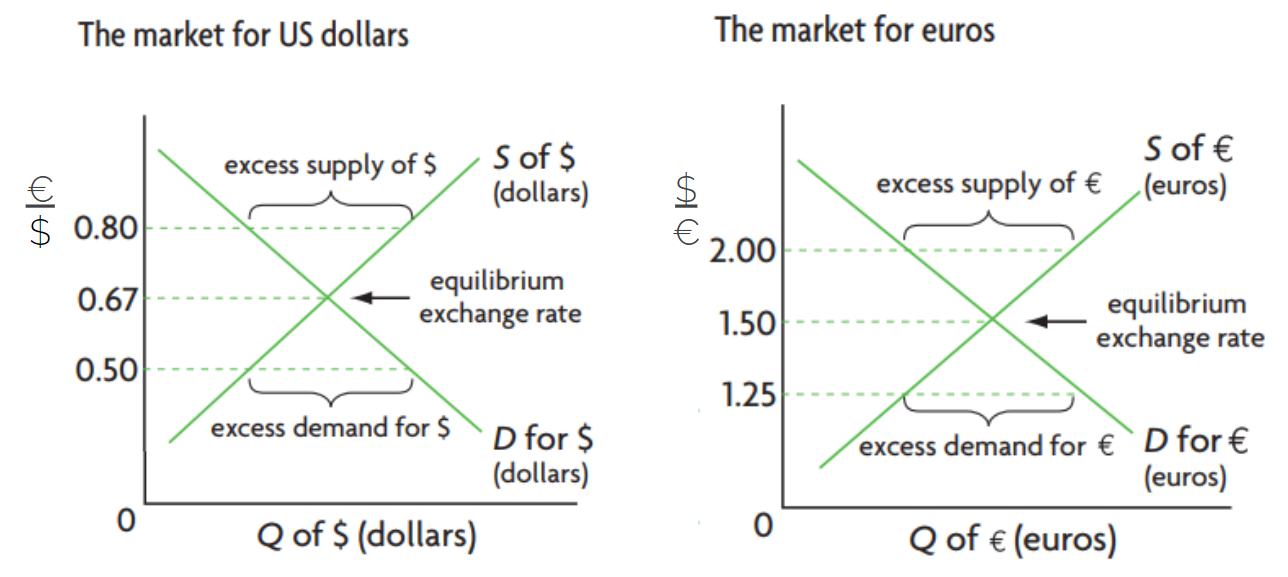
prices are reciprocals of one another
the quantity on the x axis will always be the denominator on the y axis
currency appreciation → increase in currency’s value (in relation to another)
caused by increased demand or decreased supply
increase in price (value)
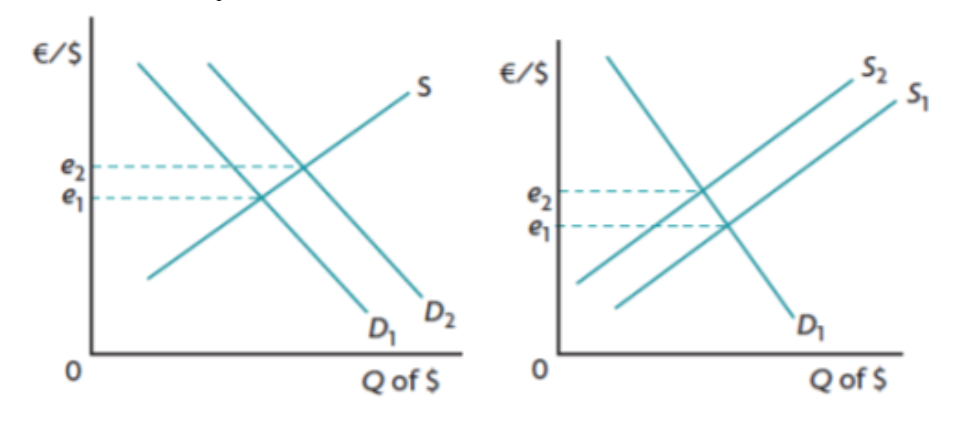
currency depreciation → decrease in currency’s value (in relation with another)
caused by decreased demand or increased supply
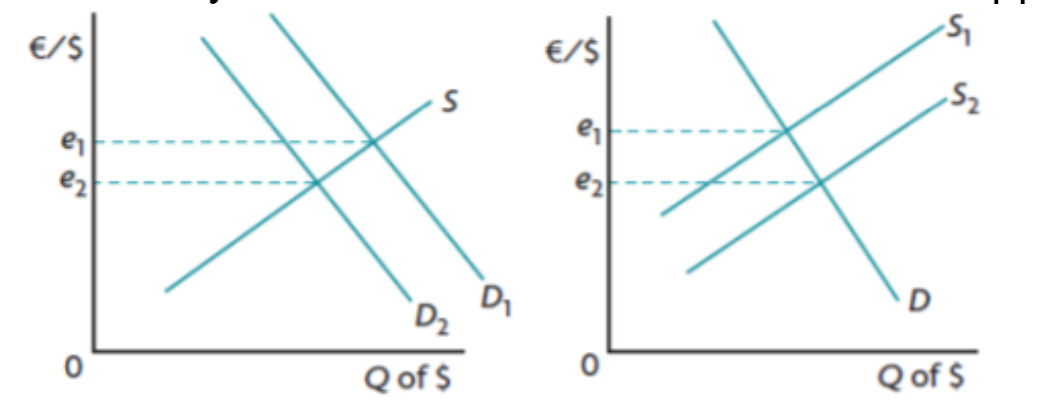
causes of change in demand and supply for a currency
foreign demand for exports
goods and services
domestic demand for imports
goods and services
inward/outward foreign direct investment
expanding operations of MNCs
inward/outward portfolio investment
financial instruments
remittances
overseas nationals send money back
speculation
currency as a financial asset
saving in hopes of appreciation
relative inflation rates
general price levels
relative interest rates
price of money
relative growth rates
increased wages and consumption
central bank intervention
reserves of FOREX currencies
strengths
policy makers have great flexibility → no need for central banks to hold foreign reserves
balance of payments is achieved automatically
automatic adjustments to excess demand or supply
naturally provides downward pressure on high inflation
limitations
uncertainty for stakeholders
currency speculation can be destabilizing
Fixed exchange rates (19/9/24)
an exchange rate that is fixed by a country’s central bank and not permitted to change freely
“pegging” → verb for definition above (relative to another country’s currency)
requires constant central bank intervention
manipulating demand/supply of currencies → mostly buying/selling reserve currencies
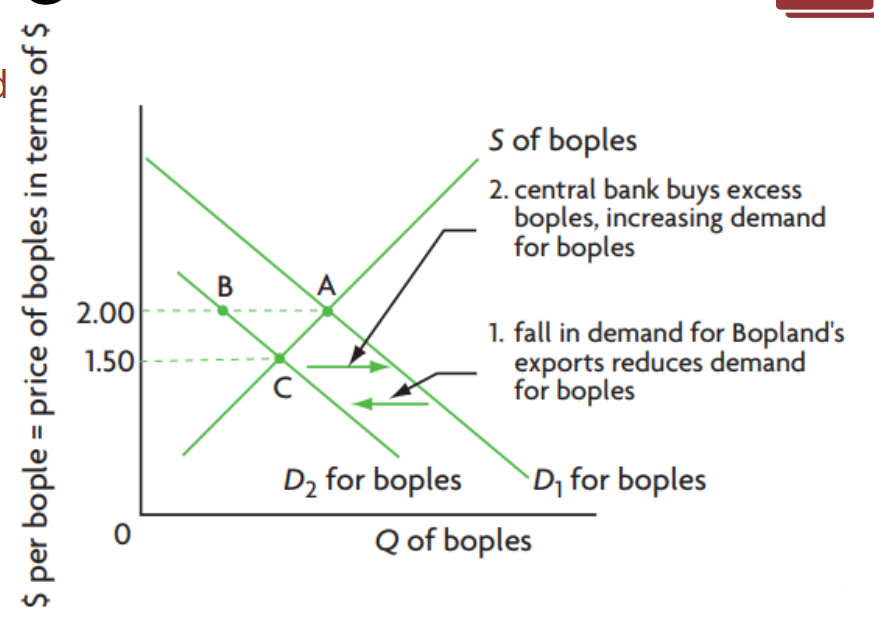
fall in demand for exports reduce demand (D1→D2)
central bank buys excess of the country’s currency, increasing demand (D2→D1)
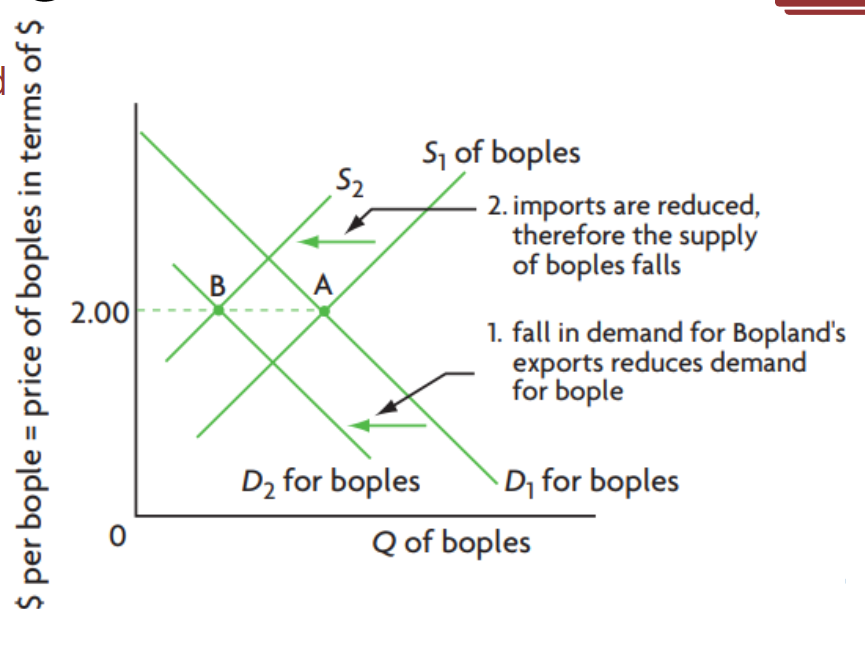
fall in demand for exports reduce demand (D1→D2)
imports are reduced, so supply of the currency falls (S1→S2)
central bank must respond to excess demand for currency
caused by increased demand or decreased supply
ex: increasing exports or decreasing imports
can buy foreign currency (domestic supply)
central bank must respond to excess supply of currency
caused by increased supply or decreased demand
ex: increasing imports or decreasing exports
can buy domestic currency (using foreign reserve supply)
until they run out of foreign currencies
additional measures to maintain a fixed rate
response to excess supply of domestic currency:
increase interest rates
attracts inflow of foreign currency
(-) contractionary monetary policy may cause recession
borrow from abroad
access to foreign currency
(-) increasing foreign debt
efforts to limit imports
decreases excess domestic supply
contractionary policy to decrease spending → (-) potential recession
trade protection policies → (-) potential retalliation by trade partners
devaluation of a currency
officially and deliberately decreasing the value of a pegged currency
looks similar to depreciation of a floating currency
results in cheaper exports and more expensive imports
revaluation of a currency
officially and deliberately increasing the value of a pegged currency
looks similar to appreciation of a floating currency
results in cheaper imports and more expensive exports
strengths
high degree of certainty for stakeholders
very little speculation activity
limitations
requires constant monitoring to eliminate disequilibrium
requires central banks to hold sufficient FOREX reserves
policy makers have little flexibility → most maintain fixed exchange rate
requires contractionary fiscal policies to keep exports competitive during inflation
imbalance of payments is not easily corrected
Managed exchange rates (26/9/24)
an exchange rate determined by market forces but periodically influenced by a country’s central bank
“managed float”
combines floating and fixed systems
closer to floating
intervention aims for short term stability
prevention of large and abrupt fluctuations
fluctuations discourage investment and spending
typically buying/selling currencies
generally done within upper and lower ‘bands’
freedom to float within a determined range
consequences of overvalued currencies (greater than equilibrium free market value)
cheaper imports → cheaper capital and raw materials
helpful for LDCs to grow manufacturing
(-) expensive exports, worsening trade balance, increased competition for domestic firms, domestic unemployment
may need to be devalued
consequences of undervalued currencies (lower than equilibrium free market value)
considered cheating (unfair competitive advantage) → “dirty float”
cheaper exports, growth of export industries, job creation
(-) expensive imports, cost-push inflation
may need to be revalued
both overvalued and undervalued currencies only occur in fixed and managed systems, not free floats
BOP accounts (14/10/24)
BOP → balance of payments
record of all transactions between a country’s residents and the rest of the world
over a defined period (ex: one quarter)
households, firms, and government
ex: imports/exports, travel, financial investments, foreign direct investment, etc.
“balance of international payments”
credits = debits
credit → inflow, debit → outflow
inflow of payments received (credits) create foreign demand for country’s currency which is the supply for foreign currency
outlfow of payments made (debits) create domestic supply of nation’s currency which is the demand for foreign currency
BOP consists of three accounts
current account (4)
balance of trade in goods (X-M)
balance of trade in services (X-M)
income (inflows - outflows)
current transfers (inflows - outflows)
capital account (2)
capital transfers (inflows - outflows)
transactions in non-produced, non-financial assets (inflows - outflows)
capital account is relatively small and unimportant
financial account (4)
(foreign) direct investment (inflows - outflows)
portfolio investment (inflows - outflows)
reserve assets (inflows - outflows)
official borrowing (inflows - outflows)
The balance of payments (15/10/24)
there is interdependence between the three accounts
a deficit in one account will be offset by a surplus in another
sum of the three accounts will always be zero (“zero balance”)
credits match the debits; surpluses match the deficits
current account = -(capital account + financial account)
current = -(capital + financial + errors and omissions)
if a country has a current account deficit (exports < imports)
inflows (credits) < outflows (debits)
financial (and capital) accounts surplus provides foreign exchange to pay for deficit
zero balance is achieved
country consumes beyond PPC (more than they can produce)
if a country has a current account surplus (exports > imports)
inflows (credits) > outflows (debits)
surplus provides foreign exchange used to pay for financial (and capital) deficit/spending
zero balance is achieved
country consumes beyond PPC
The BOP and exchange rates (17/10/24)
relationship between current account and exchange rate
floating exchange rate system
current account deficit causes downward pressure on the exchange rate
increasing debits require outflows of domestic currency (increased supply = decreased value)
current account surplus causes upward pressure on the exchange rate
inflows of foreign currency must be exchanged (increased demand = increased value)
managed exchange rate system
central bank responds to current account surplus by buying foreign currency
done to avoid appreciation
central bank responds to current account deficit by selling foreign currency
done to avoid depreciation
fixed exchange rate system
central bank responds to current account surplus by increasing debits
ex: buy foreign currency, decrease interest rates, lend abroad
done to avoid revaluation
central bank responds to current account deficit by increasing credits
ex: sell foreign currency, increase interest rates, borrow from abroad
also can increase debits by limiting imports
done to avoid devaluation
relationship between financial account and exchange rate
financial account surplus is typically caused by investment in domestic economy from outside
foreign direct investment or response to high interest rates
increased demand for currency increases its value
financial account deficit is typically caused by investment in foreign economies
foreign direct investment or response to high interest rates
increased supply for currency decreases its value
Current account deficits and surpluses (29/10/24)
consequences of persistent current account surpluses (extended trade surplus, balanced with financial account)
low domestic consumption
production > consumption → lower standard of living
upward pressure on exchange rate
damage on domestic economy
insufficient domestic investment
caused by financial account deficit
reduced export competitiveness
due to currency appreciation
unemployment
workers begin to lose jobs
(+) downward pressure on price levels
demand-pull and cost-push
consequences of current account deficits (extended trade deficit, balanced with financial account)
downward pressure on exchange rate
imported inflation (from countries with higher prices)
need for high interest rates to attract inflows
contractionary monetary policy → discourages investment
foreign ownership of domestic assets (ex: U.S.)
satisfies need for credits in financial account
increasing levels of debt
risk of default → cannot pay the debt
poor international credit rating
considered less credit-worthy
cost of paying interest on loans (debt servicing)
opportunity cost
painful demand management policies
contractionary policies to limit imports (debits)
lower economic growth
result of contractionary policies and government paying interest on loans
policies to correct persistent current account deficits
expenditure reducing policies (aims to limit AD)
contractionary policies → reduces output, income, consumption, imports
(+) lower rate of inflation → more competitive exports
(-) likely recession → higher interest rates put upward pressure on exchange rates
expenditure switching policies (from imported to domestic goods)
trade protection
(-) retalliation, higher domestic prices, lower domestic consumption, misallocation of resources
depreciation
(+) benefits export industries
(-) demand-pull, cost-push inflation
supply-side policies (increase competitiveness)
ex: limit power of trade unions, reduce minimum wage/corporate taxes, deregulation
(+) greater potential output, downward pressure on inflation
(-) requires a lot of time
Marshall-Lerner condition → measure of effectiveness of devaluation/depreciation to reduce a trade deficit
if sum of the PEDs of imports and exports is greater than 1, devaluation/depreciation will improve trade balance
if sum of the PEDs of imports and exports is less than 1, devaluation/depreciation will reduce trade balance
if sum of the PEDs of imports and exports is equal to 1, devaluation/depreciation will not affect trade balance
suggests that a devaluing/depreciating country may initially experience a worsening trade balance, followed by a shrinking deficit, then a trade surplus
“J-curve” effect
result of initially low PED (due to time lags) that increases with time

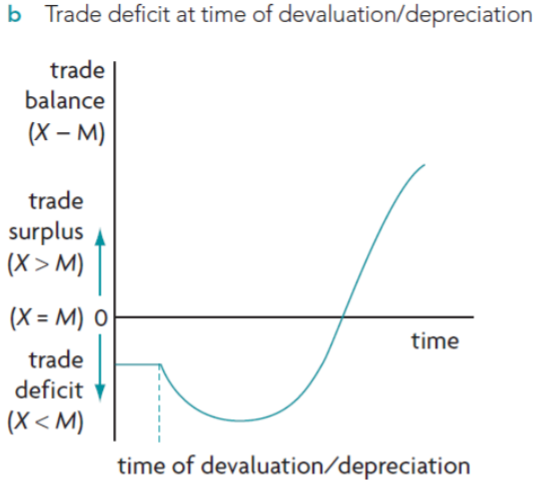
Sustainable Development
sustainable development → development that uses resources to meet present needs without compromising future needs
concerned with both depletion and degradation
both growth and development
shared concern for economy and environment
increasing production and consumption while still preserving natural world
typically in conflict (questions true needs/wants)
sustainable development goals (SDGs)
17 “universal goals that meet the urgent environmental, political, and economic challenges facing our world”
intended to be met between 2015-2030
used by international organizations and national governments
fights poverty and develops sustainably
sustainability and poverty
pollution of affulence → high income production and consumption resulting from economic growth
rising real output
requires use of fossil fuels
uses up common pool resources
results in climate change
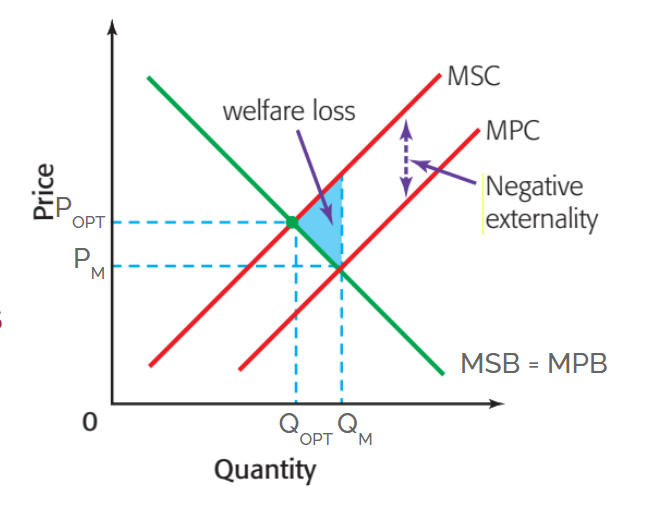
pollution of poverty → economic activity pursued by very poor people in an effort to survive
overexploitation of scarce environmental resources
overuse of common pool resources
overuse of land depletes soil’s natural minerals
overgrazing depletes pastures of nutrients
deforestation in search of farmland
higher birth rates = greater demand for resources
Economic Growth and Development
economic growth
increases in real output and income over time
allows societies to better satisfy needs/wants
potentially increases living standards
typically measured as real GDP per capita
economic development
increases in real output and income over time + improvement in living standards
+ reduced poverty, increased access to goods/services that satisfy needs/wants (healthcare, education, sanitation), improved gender equality, improved employment opportunities, reduced income/wealth inequalities
not so easily measured
growth VS development
growth can occur without development
development unlikely without growth (but possible)
reallocation of resources
development will eventually require growth (+)
reallocation will eventually be exhausted
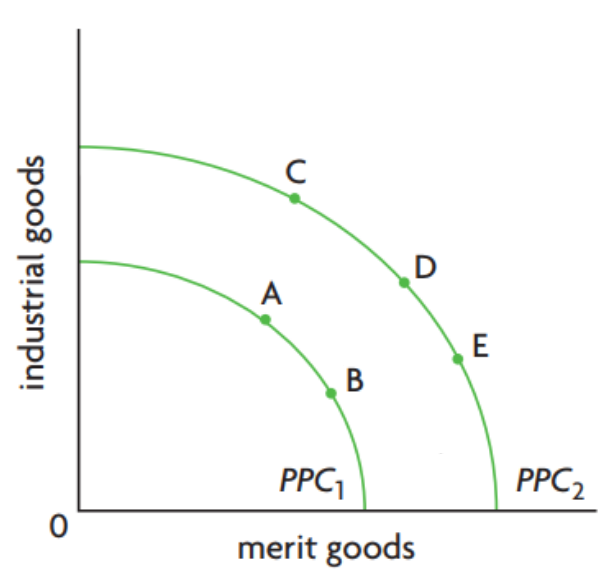
development without growth: A→B
growth without development: B→C
growth with development: A→E
Measuring Economic Development
requires economic indicators
data that describes performance
captures attributes (specific + measurable)
captures characteristics (general + descriptive)
purpose:
monitoring development
comparing countries
assessing progress
devising policies
single indicators
GDP per capita
output per person, regardless of who produces
GNI per capita (GDP + net income from abroad)
income per person, regardless of where it is earned
trends in GDP/GNI per capita
similar if inflows and outflows are similar
similar if factors of production are owned by its residents
GNI per capita better reveals living standards
GDP per capita better reveals output
purchasing power parities (PPP)
the rate at which the currency of one country would have to be converted into that of another country to buy the same amount of goods/services in each country
‘buying power equivalence’
eliminates the influence of price differences on values of output/income
typically applied to GDP/GNI
trends in PPPs
in poorest countries, PPP conversions are greater than exchange rate conversions
money in low-price countries has greater purchasing power
single health indicators
life expectancy at birth
average number of years of life
infant mortality
average number of deaths before age one per 1000 live births
maternal mortaility
average number of pregnancy related deaths per 100,000 live births
trends in health indicators
strong health indicators are linked with high GDP per capita
adequate health services with broad access
healthy environment → safe drinking water, sewage and sanitation, low levels of pollution
adequate diet
high levels of education
no serious income inequalities/poverty
exceptions:
some countries have greater inequalities in income
some countries have greater public health policies
each country allocates its resources differently
single education indicators
adult literacy rate
percent of people aged 15+ who can read + write
primary (or secondary) school enrollment
percent of school aged children enrolled in school
trends in education indicators
less developed countries typically devote more resources to primary education
strong education indicators are linked with high GDP per capita
exceptions → due to different prioritization of education amongst countries
single economic inequality indicators
Lorenz curve
diagram of cumulative % of income received by cumulative shares of population
Gini coefficient
summary measure of Lorenz curve (A/A+B)
poverty line
income level that is just enough to ensure a family of minimum necessities
single social inequality indicators (condition where people have unequal access to valued resources, services, and positions in society)
crime and homicide rates
adolescent fertility rates
infants lacking immunization
old-age pension recipients
degree of trust metrics
single energy indicators
access to electricity
share of household income spent on fuel/electricity
energy use per capita
single environmental indicators
CO2 emissions per capita
bird or fish species threatened
measures of ozone depletion
composite indicators
summary measures of multiple dimensions of development
necessary because economic development is multidimensional
produces more meaningful results
Human Development Index (HDI)
average of 3 dimensions scored from 0 (low) to 1 (high)
life expectancy at birth (long, healthy life)
mean years of schooling / expected years of schooling (access to knowledge)
GNI per capita US$ PPP (decent standard of living)
observations:
similar development can be achieved in very different ways
GNI/GDP per capita ranking may greatly differ from HDI ranking
development depends upon how countries choose to allocate their resources
has flaws → says nothing about income distribution, malnutrition, gender inequalities, etc.
Inequality-adjusted Human Development Index (IHDI)
adjusts the three HDI values for inequality
attempts to account for losses in development caused by inequality
if there were perfect equality in income, health, and education, IHDI = HDI
observations:
IHDI < HDI of all countries examined by the UN Development Programme
countries that lost the least HDI values have high HDI scores
countries that lost the greatest HDI values have relatively low HDI scores
countries that lost the least HDI values have more equal distribution of income (GINI)
Gender Inequality Index (GII)
combines 3 indicators to measure gender inequality
maternal mortality rate and adolescent birth rate (reproductive health)
share of parliamentary seats held by women and proportion of women in population with secondary education (empowerment)
proportion of women in the labour force (labour force participation)
Happy Planet Index (HPI)
combines 4 indicators to measure sustainable human well-being
life expectancy
well-being
inequality of outcomes
ecological footprint
HPI = (well-being x life expectancy x inequality) / ecological footprint
observations:
little correspondance between GNI per capita, HDI, and HPI
high income countries often have high ecological footprint
limitations of economic development indicators
provide limited information
improves with addition of more indicators
sometimes present conflicting perspectives
based on statistical information
some countries have limited capacity for collection
collection methods differ from country to country
data are not fully available in some countries
new data is not produced at the same time
The Poverty Cycle
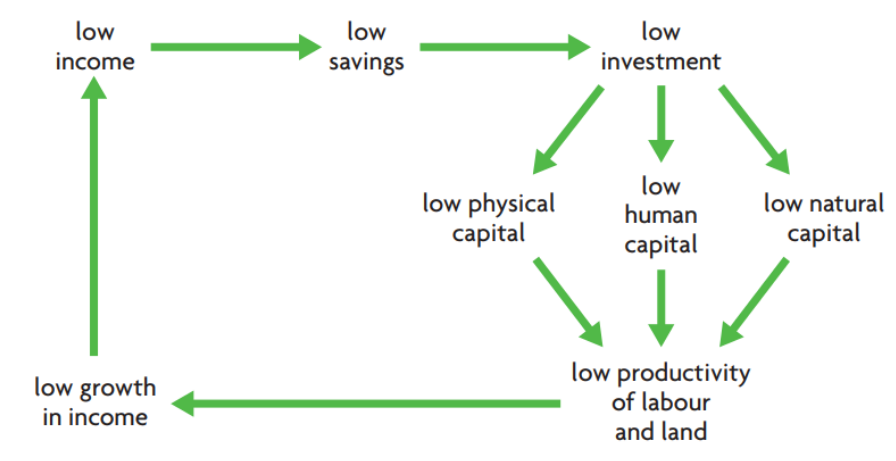
poverty
the inability to afford basic needs
individual, household, community, or country
absolute poverty
occurs when an individual/household lacks the income to meet basic needs
exists when income level is below the ‘poverty line’
unable to sustain a family in terms of food, housing, clothing, medical needs, etc.
determined by individual countries
international poverty line: $1.90 a day
identified by World Bank as ‘extreme poverty’
extreme version is concentrated in developing countries
lower-middle-income countries poverty line: $3.20 a day
upper-middle-income countries: $5.50 a day
relative poverty
occurs when an individual/household earns less than a determined percentage of a society’s median income
may be able to afford basic necessities, but unable to achieve typical lifestyle (according to society)
would not exist if income were equally distributed
low equity in income distribution → increased relative poverty
characteristics of those in poverty
tend to spend entire income acquiring needs
possibly not enough for survival
low levels of physical capital
tools, roads, water supplies, sanitation
low levels of human capital
education, skills, knowledge, healthcare
low levels of natural capital
soil, lakes, forests, etc.
the poverty cycle
‘the poverty trap’
low income = low (or zero) savings = low (or zero) investments in capital = low productivity = low income = … and so on and so forth
requires intervention
generational poverty
transmitted from one generation to the next
unable to afford quality education/healthcare
typically have large families
forced to overuse their land
unable to secure bank loans (low credit)
children are almost destined for low productivity/income
breaking the poverty cycle
requires government intervention through investment in capital
physical capital → infrastructure (sanitation, water supplies, roads, power supplies, irrigation, etc.)
human capital → health services, education, nutrition
natural capital → conservation and regulation of the environment
requires government expenditure 😭😭😭😭😭
International Trade Strategies
limited access to international markets (PROBLEM)
developed countries protect domestic producers with subsidies
developed countries impose higher tariffs on imports from developing countries
developed countries impose higher tariffs on manufactured goods (disincentivizing value added production)
developing countries impose higher tariffs on imports from other developing countries
limited access to appropriate technology (potential to increase quality of physical quality) (PROBLEM)
must be well-suited to specific conditions
economic, geographical, ecological, climate
different for developed and developing countries
(-) most technolgical advances take place in and for developed countries
labour-intensive technologies
use more labour than capital
create jobs → increased incomes, decreased poverty
increased need for local skills and inputs
capital-intensive technologies
use more capital than labour
creates unemployment → decreased incomes, increased poverty
increased need for outside skills and capital
import substitution (SOLUTION)
use of protectionist measures to promote a country’s domestic industry
manufacture of simple consumer goods orientated towards the domestic market
shoes, textiles, beverages, appliances, etc.
tarrifs and quotas discourage imports
inward looking
(+) decreased need for specific imports; development of specific manufacturing
(-) requires heavy government intervention (likely including public ownership of firms); resource misallocation; high product prices; risks growth of capital-intensive rather than labour-intensive production
export promotion (SOLUTION)
use of strong government intervention to expand exports
typically an extension of import substitution
aims for export revenues to expand GDP
transformative for China, Hong Kong, Indonesia, Malaysia, Singapore, South Korea, Taiwan, and Thailand
outward looking
(+) new markets; diversification; investments in human capital; appropriate technologies; increased employment; gives rise to secondary sector shift
(-) dependent upon healthy foreign economies; hindered by increased protectionism
economic integration (SOLUTION)
the process of being more interdependent and economically unified
requires free trade agreements
growth and development best achieved when member nations are geographically close, at similar levels of development, have similar market sizes, and committed to cooperation (regional)
(+) new markets; economies of scale; diversification; increased investment (domestic + foreign)
(-) developed countries often exploit developing country (bilateral); trade deficits and balance of payments problems for LEDCs (bilateral)
Diversification and Social Enterprise
dependence on primary sector production (PROBLEM)
ex: agriculture, fishing, mining, forestry, etc.
unsustainable
extraction of finite resources
overspecialization of few commodity exports (basic goods that are interchangeable with other goods of the same type)
vulnerable to unforeseen changes
little opportunity for value-added production
price volatility of primary products
instability impacts farmers’ incomes, agricultural investment, employment, and wages
instability impacts export earnings and balance of payments
instability impacts government revenues and development planning
diversification (SOLUTION)
reallocation of resources into new activities
ex: manufacturing
typically for export
broadens the range of products
relative share of primary sector in GDP declines
shifts to secondary then tertiary (value-added production)
challenges the theory of comparative advantage
(+) sustained increases in exports; development of technology; increases in human and physical capital; reduced vulnerability; potential use of domestic primary commodities
(-) increases in domestic prices (reduced supply); high risk of failure (lack of expertise); requires time (development of skills/knowledge)
social enterprise (SOLUTION)
‘social business’
nonprofit or for-profit (profit is not the goal)
organization that focuses on meeting specific social objectives
effort to promote social change + improve people’s well-being
becoming increasingly popular in LEDCs
poverty alleviation and other social issues
(+) encourages civic engagement; creates awareness (attracts media attention); often ecological/environmental benefits
(-) lacks funding/people to create significant change; government assistance has opportunity cost
Market-Based Policies
policies that aim to achieve economic growth and development via free market forces
focus on increasing productive capacity through the supply-side of an economy
liberate industries from rules/regulations
allow market incentives to raise productivity
incentivize investment in the economy
founded on the assumption that market forces allocate resources efficiently, leading to growth/development
trade liberalization (SOLUTION)
the reduction/removal of trade barriers
tariffs, quotas, subsidies, administrative barriers
encourages competition and efficiency in export and import markets
requires trade relationships for both trade and investment
(+) encourages free and fair trade; increases competition; increases productivity + efficiency; improves global resource allocation; FDI creates employment opportunities
(-) intense competition from larger overseas firms; closure of local businesses causes unemployment; domestic firms harmed by dumping; profit maximizing firms may compromise on ethical/environmental matters
deregulation (SOLUTION)
reduction/removal of government rules/regulations in an industry
aims to encourage competition and efficiency
product markets and labour markets
ex: financial institutions given autonomy to decide what types of products to offer
ex: reduction of labour union power, elimination of minimum wage
(+) increases efficiency in targeted markets
(-) increases deception + corruption (particularly in LEDCs)
privitization (SOLUTION)
transfer of ownership from public sector to private sector
aims to improve competition, efficiency, and productivity in economy
motivated by profit rather than survival
public sector is known for inefficiences + corruption
ex: transport oil, gas, communication, etc.
(+) reduces government expenditure; increases government revenues (from actual sale); increases competition; increases productivity/efficiency; improves allocation of resources
(-) short-term unemployment (privately owned firms will eliminate inefficiences); profit-seeking firms will likely increase prices; some industries lack competition, monopoly power is abused
better in theory than in practice
little or no growth of international trade
divergence rather than convergence
little/no improvement in diversification
increasing income inequality/poverty in LEDCs
lower income growth among the poorest
creates winners and losers
not all have the skills/opportunities to benefit
Interventionist Policies
policies that aim to achieve economic growth and development via government intervention
focus on improving productive capacity through the correction of market deficiencies
redistributive policies to reduce inequality within and among countries
rising economic inequality (PROBLEM)
economic growth does not ensure development when the majority remain impoverished
insufficient access to education, healthcare, and credit
leads to further inequalities
corruption
rich minority have political influence
civil unrest
destruction of capital
market instability
tax policies (SOLUTION)
progressive taxes charge a higher percentage of tax as an individual’s income increases
addresses inequality by redistributing income and wealth from rich to poor
economy benefits as those with highest MPC now have more disposable income
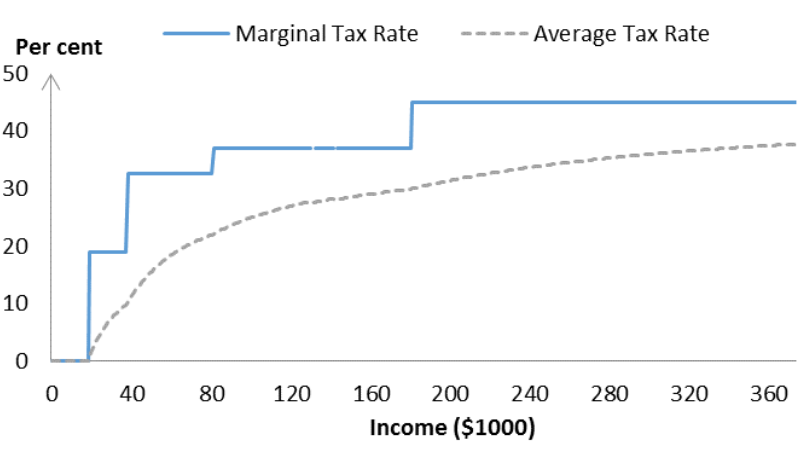
indirect taxes tax income through expenditure on goods/services (consumption)
redistribute income when applied to luxury products
discourage spending on products that generate negative externalities
low income tax rates incentivize work
encourage labour force participation
low corporate tax rates incentivize production
encourages investment
(-) progressive taxes → disincentivizes work for high income earners; incentivizes tax evasion; less savings/investment
(-) indirect taxes → increases inequality (regressive)
(-) low taxes → may incentivize rest (income); cannot ensure increased investment (corporate)
transfer payments (SOLUTION)
government payments without an exchange of goods/services
redistributive by nature
ex: unemployment benefits, pensions, child allowances
(+) reduces inequality; improves living standards for disadvantaged/marginalized
(-) payments without actual output/gain; opportunity cost for government; LEDCs lack sufficient government budgets
minimum wage policies (SOLUTION)
minimum legal price of labour
price floor in labour market
aims to protect low-skilled workers
sufficient living wage for all
ideally allows for savings for all
(+) increases living standards for those who benefit
(-) requires government resources to ensure compliance; increases costs of production; may increase unemployment
Provision of Merit Goods
low levels of human capital (PROBLEM)
barriers to education
school fees; insufficient fundng (insufficient/underqualified teachers/resources); gender discrimination; distance from home; conflict
barriers to healthcare
doctor’s fees; insufficient funding (insufficient/underqualified teachers/resources); gender discrimination; distance from home; insufficient access to water/sanitation
limited access to infrastructure (form of physical capital requiring investment) (PROBLEM)
ex: electricity, telecommunications, internet access, irrigation, roads, ports, etc.
lowers costs of production
largely a government responsibility
merit goods
goods which are deemed to be socially desirable → likely to be under-produced and under-consumed through free markets
ex: education, healthcare, vaccines, public transit
particularly true for poorest members of society
products that create positive externalities when consumed
MSB > MPB
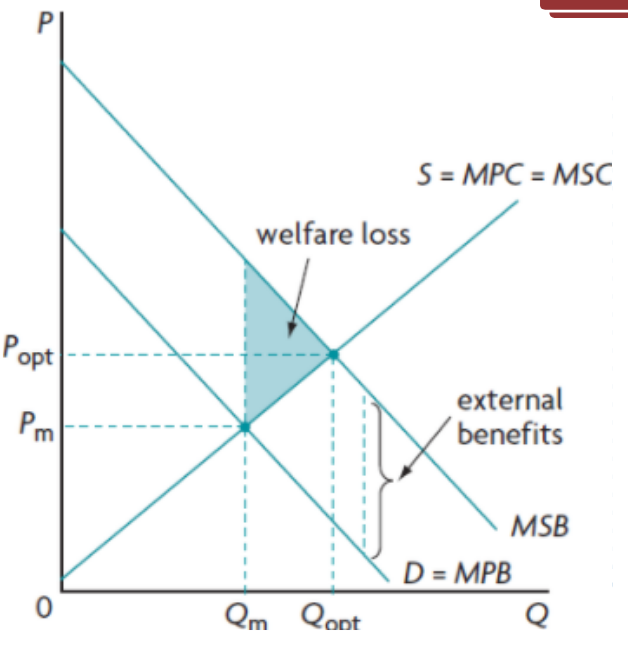
education programs (SOLUTION)
allocating a portion of government’s budget for education/training (primary, secondary, adult)
social benefits exceed private benefits
ex: improvements in capital, increased living standards, lower crime rates, lower birth rates
underprovided and underconsumed in LEDCs
budget limitations; ‘no free lunch;’ need to work (ex: agriculture)
health programs (SOLUTION)
allocating a portion of government’s budget for investments in health
necessary for healthy and productive labourforce
social benefits exceed private benefits
ex: vaccines and preventative measures against contagious diseases and pandemics; social marketing of preventative measures against malaria/HIV/AIDS
underprovided and underconsumed in LEDCs
infrastructure (SOLUTION)
allocating a portion of government’s budget for investments in a country’s basic physical systems
decrease costs of production and increase productivity
power supports transition from primary to secondary sector
roads, rails, ports allow movement of goods
telecommunications foster communication + facilitates education
clean water + sanitation supports health/safety
social benefits exceed private benefits
underprovided and underconsumed in LEDCs
Foreign Direct Investment
investment by a multinational company (MNC) in productive activities in another country
based in home country, operating in host country
control of 10+% of firm in host country
increasingly common to have home in MDC and be hosted in LEDC
most important source of foreign finance flows into LEDCs
though domestic investment tends to be much greater
reasons MNCs expand into LEDCs (firms are profit maximizers)
increase sales and revenues
bypass trade barriers
lower costs of production
access to locally produced raw materials
natural resource extraction
appealing characteristics of LEDCs
stable macroeconomic environment
inflation, currency, debt, BOP
large markets
liberalized economy + trade policy
favourable tax rules
freedom to repatriate profits
well-educated labour force
well-functioning infrastructure
political stability
(+) can help offset current account deficit; improved technical/management skills; improved technology; increased savings=increased capital stock; tax revenues; boost to local industry; employment opportunities
(-) environmental degradation; inappropriate consumption patterns; spending on infrastructure takes priority over spending on merit goods; negative political influence; ‘race to the bottom’
Foreign Aid
indebtedness (PROBLEM)
debt servicing has opportunity cost
human capital, infrastructure, etc.
may require increasing taxes
poor credit ratings + high interest rates
discourages FDI
potential debt trap
foreign aid (SOLUTION)
financial assistance to developing countries
funds, goods, services
must be concessional and non-commerical
transfers involve more favourable conditions than those found in the market
ex: loans have lower interest rates or longer repayment periods
must not involve buying/selling
goal of improving economic, social, or political conditions
military aid, peacekeeping, refugee assistance, and anti-terrorism do NOT meet these conditions
types of foreign aid:
humanitarian aid
food, medical, emergency relief
development aid
project, programme, technical assistance, debt relief
humanitarian aid (SOLUTION)
aid extended in regions affected by violent conflicts or natural disasters
grants (money as a gift) or goods-in-kind (food, medicine, blankets, etc.)
intended to save lives, ensure access to basic necessities, and help displaced people
development aid (SOLUTION)
aid intended to help LEDCs achieve development objectives
ex: eradicating poverty, improving education/standards of living
delivered through grants, concessional loans, and debt forgiveness
financial aid counted as inflows in BOP
debt relief (SOLUTION)
forgiveness/restructuring of a portion (or all) of a country’s debt
original loans were typically for development projects
restructuring is done through new loans on new (improved) terms
helps reduce opportunity cost of debt servicing
official debt assistance ‘ODA’ (SOLUTION)
foreign aid from donor governments for development purposes
not from NGOs/non-profit organizations
can be bilateral → from one country to another
can be multilateral → channeled through a development agency like UN/World Bank
largely in the form of grants
non-government organizations ‘NGOs’ (SOLUTION)
organizations capable of providing tens of billions of dollars in aid (grants) annually
an increasing amount of which was collected as ODA
ex: World Vision International, Oxfam International, Save the Children International
some of which also help plan, implement, and manage development programs
(+) increases consumption; increases investment; supports growth of human capital and infrastructure (productivity, potential for some to escape poverty cycle); can improve income distribution; helpful in achieving SDGs; potential to escape debt trap
(-) tied aid reduces effectiveness (recipients required to use aid to buy products from donor countries); conditional aid reduces effectiveness (recipients required to agree to certain terms); aid is inconsistent and unpredictable; aid may not reach those most in need; potential for corruption; recipient countries may borrow recklessly, assuming future debt forgiveness
Multilateral Development Assistance
multilateral development assistance (SOLUTION)
lending for the purpose of development by intermediary organizations
international organizations composed of many countries
ex: World Bank, International Monetary Fund
large projects funded by pooling money together
lending is typically non-concessionary
terms determined by market forces
The World Bank
international organization that lends money to LEDCs for economic development and structural change
poverty reduction + sustainable development
financing for infrastructure, education, health, etc.
+technical assistance, policy advice
non-concessional loan terms for middle-income countries
concessional loan terms for low-income countries
(-) governance dominated by rich countries → voting power determined by size of financial contributions
(-) excessive interference in domestic policy
(-) conditional assistance → loans deprive country of autonomy
(-) inadequate attention to poverty alleviation
(-) accused of doing very little to help LEDCs
The International Monetary Fund (IMF)
organization that oversees the international financial system + promotes global trade
seeks exchange rate stability
financial assistance + policy advice to countries facing BOP problems
short-term non-concessional loans to countries struggling to make international payments
aims to ensure macroeconomic stability
(-) governance dominated by rich countries → voting power determined by size of financial contributions
(-) excessive interference in domestic policy
(-) conditional assistance → loans require extremely conservative macroeconomic policies
(-) many countries have experienced increasing rates of poverty and negative growth rates
Institutional Change
informal economy (PROBLEM)
‘parallel markets’
unregistered
not recorded for national accounting
untaxed
unregulated
unprotected + vulnerable
especially common in LEDCs
ex: subsistence farmers, casual jobs paid for in cash
weak institutional framework (PROBLEM)
established systems, structures, and contexts that shape economic behaviour in a country
ex: legal system, protection of property rights, taxation structures, banking system
property rights (SOLUTION)
the entitlement to assets owned by an individual, organization, or government
tangible + intangible assets
physical + intellectual property (particularly land)
free to decide how resources are best used
rights to use, earn income from, transfer to others
necessary for FDI
land rights (SOLUTION)
(+) increased food security; increased access to credit; lower rates of deforestation; biodiversity; protects indigenous peoples and their culture
improved access to banking (SOLUTION)
banks provide link between savers and borrowers
not readily available in LEDCs
credit is necessary for growth + development
investment in human/physical/natural capital
mobile banking makes products available to anyone anywhere
microfinance (SOLUTION)
small loans on short repayment plans to those who do not typically qualify
including women
used for self-employment
(+) great success stories; targets women; may require financial literacy course
(-) high interest rates; encourages growth of informal economy; possible corruption; tragic stories; very small scale; cannot serve as THE solution
gender inequality (PROBLEM)
ex: health/education, labour market, inheritance/property rights, access to credit
limits quantity + quality of labour
massive barrier to eliminating poverty
contributes to low living standards for women and children
repeated across generations
increasing women’s empowerment (SOLUTION)
gender equality helps end social and cultural discrimination against females
includes driving, voting, working with men, etc.
increased output (and potentially productivity)
especially significant in reducing poverty and child mortality
educated mothers = educated children = smaller families
lack of good governance (PROBLEM)
the action/manner of governing
effectiveness of government
those who act on behalf of the people
includes policy implementation, spending, taxation, etc.
corruption (PROBLEM)
dishonest/fraudulent conduct
ex: bribery, tax evasion
typically by government officials, powerful firms/individuals
decreases tax revenues + ability to provide merit goods
reducing corruption (SOLUTION)
LEDCs benefit from well-structured and well-enforced legal systems
LEDCs benefit from tax system reforms
necessary to generate essential revenues without excessive borrowing
Market-Oriented Policies
LEDCs need a mix of market-oriented and interventionist policies
extremes have been ineffective, governments must strike balance
market-oriented policies (SOLUTION)
policies that allow private decision-makers to make economic decisions
limited government intervention
market determines resource allocation
price serves as signals and incentives
communicates information, motivates response
competition produces lower price and greater quality and choice
ex: trade liberalization, freely floating exchange rates, market-based supply-side policies
policies that encourage competition (deregulation, privitization, anti-monopoly regulation)
labour market reforms (limiting labour union power, eliminating minimum wage)
incentive-related policies (incentives to work/innovate/invest)
(+) efficient allocation of resources; competitiveness (firms + households benefit); benefits of free trade (firms + households benefit); long-run economic growth (profit motive drives entrepreneurs to innovate and invest)
(-) market failures (negative externalities are not corrected, merit goods remain underprovided/underconsumed); income/wealth inequalities (unequal distribution of FOP, benefits do not naturally reach the poorest, insufficient credit opportunities for the poor)
Interventionist Policies
LEDCs need a mix of market-oriented and interventionist policies
extremes have been ineffective, governments must strike balance
interventionist policies (SOLUTION)
policies based on government intervention in the market
intended to correct market deficiencies
seeks to create more effective markets (at the cost of efficiency)
(+) provision of stable macroeconomy
price stability, full employment, reasonable budget deficit, reasonable trade balance
protects interests of economic decision-makers
attracts FDI
(+) corrects market failures
corrects negative externalities + overuse of common pool resources
provides merit goods (products that generate positive externalities)
education, healthcare, social safety nets, parks
provides public goods (non-excludable, non-rivalrous)
natonal defense, basic education/healthcare
(+) investment in human capital
health/education
insufficiently provided by private sector
(+) provision of essential infrastructure
ports, roads, railways, power, communication, sanitation, sewage, etc.
insufficiently provided by private sector
(+) provision of social safety net
use of transfer payments
a certain amount of income is needed to ensure access to basic needs
(+) promotion of gender equality
empowerment of women
access to health/education/credit
inheritance + property rights
(-) misallocation of resources
protects inefficient producers
(-) requires significant government spending
requires significant taxation
opportunity costs
(-) poor planning
requires technical knowledge + expertise
(-) excessive bureaucracy
systems, structures, rules, regulations
source of inefficiences
(-) corruption
use of public office for private gain
(-) potential influence of elite groups
exerting political pressure, self-serving interests