Chapter 11: Stockholders' Equity
Objective 11.1: Explain the role of stock in financing a corporation.
Corporate Ownership
- The major advantage of the corporate form of business is the ease of raising capital as both large and small investors can participate in corporate ownership.
- Advantages include:
- It is simple to become an owner of a corporation:
- You just have to buy a share of the company’s stock.
- You can easily transfer ownership:
- Sell the stock to someone else.
- A corporation provides limited liability.
- A shareholder is not responsible for a company’s debt.
- It the company goes bankrupt, you lose the amount you paid for the initial stock, but you are not liable for company’s liabilities.
- Because a corporation is a separate legal entity, it can:
- Own assets
- Incur liabilities
- Sue and can be sued
- Enter into contracts
- Corporations are .
- You must submit an application to the state government to create a corporation. When a corporation is approved, the state issues the articles of incorporation which holds information about the corporation.
- Stockholder benefits include:
- Voting rights - being able to vote on important issues at annual meetings.
- Dividends - Stockholders have the right to receive dividends when declared by the board of directors.
- Residual claims (liquidation rights) - If the corporation goes bankrupt, stockholders share in any remaining assets after creditors are paid.
- Preemptive rights - Existing stockholders have the first chance to purchase newly issued stock before it is issued to the public.
Equity vs Debt Financing
- Equity financing is issuing new stock to investors.
- Advantages:
- Equity does not have to be repaid, but debt does.
- Dividends are optional, but there is interest on debt.
- Debt financing is borrowing money from lenders.
- Advantages:
- Interest on debt is tax deductible.
- Debt does not change shareholder control.
Objective 11.2: Explain and analyze common stock transaction.
Stockholders’ Equity
- Contributed Capital
- Retained Earnings
- Treasury Stock
- Accumulated Other Comprehensive Income or Loss
- Contributed Capital (Common Stock and APIC)
- The company receives capital from investors when they sell stock to them.
- APIC is Additional Paid in Capital, which is the amount collected over par.
- Retained Earnings
- It is earned capital.
- Cumulative net income means less cumulative dividends.
- Treasury Stock
- Shares that were issued, but the company decided they wanted to buy them back.
- This is a contra accounts that has a normal DEBIT balance and reduces Stockholders’ Equity.
- It is a account.
- A contra account that is “stuck like glue” to Common Stock and APIC.
- Accumulated Other Comprehensive Income or Loss
- Recorded unrealized gains and losses that cause temporary changes in the value of assets and liabilities of the company.
- The may involve pensions, foreign currencies, and financial investments.
- It holds everything else (what we can’t squeeze into Common Stock because it can only hold par value).
Authorization, Issuance, and Repurchase of Stock
- A corporation can only issue a certain number of shares, which are known as authorized shares.
- Issued shares are permanently for the stockholder unless:
- They sell them to another company
- The corporation buys them back (treasury stock)
- Unissued shares are shares that haven’t been traded.
- Outstanding shares are owned by stockholders. They are .
Stock Authorization
- Par value is assigned to each share of stock that is authorized.
- It is not the same at market price, which is the value of what shares can sell for to the public.
- It is always a small number, like $0.01 per share.
- Some states require par value.
- No-Par value stock does not have a determined price.
Stock Issuance
- The first time a corporation’s stock is available to the public is called an initial public offering (IPO).
- When new stock is issued to the public, this is called seasoned new issue.
- Issuing stock at par value,
- Debit cash
- Credit Common Stock (shares x par value amount)
- Credit Additional Paid In Capital (cash - common stock)
- Example: A company issued 100,000 shares of $0.01 par value common stock for $30 per share.
- Step 1: Calculate cash received.
- Shares x Price per share
- 100,000 x $30
- Cash = 3,000,000
- Step 2: Calculate Common Stock.
- Shares x Par value
- 100,000 x $0.01
- Common Stock = $1,000
- Step 3: Calculate Additional Paid-In Capital (APIC).
- Cash - Common stock
- 3,000,000 - $1,000
- APIC = 2,999,000
- Step 4: Make the journal entry.
| Cash | $3,000,000 | ||
|---|---|---|---|
| Common Stock | $1,000 | ||
| APIC | $2,999,000 |
Stock Exchanged Between Investors
- A transaction between two investors does not involve the corporation, so the corporation does not need to record anything.
- The corporation still has the same amount of shares issued to shareholders.
Stock Used to Compensate Employees
- Employees pay packages may include exclusive stock options for a “discount” price compared to what the market price is.
- Employees are later able to buy stock and the value will be higher.
- They can also sell their stock at a higher price.
Repurchase of Stock
- Treasury stock is the repurchase of issued stock.
- :
- Making a company believe the stock is worth getting.
- Buy back the shares just to reissue them at a higher price to other companies.
- Buy back shares to reissue them to employees.
- Reduce the number of outstanding shares to increase per-share measures of earnings.
- When it is bought back, it is .
- It has no voting or dividend rights.
- Cash dividends paid is reduced when Treasury Stock is purchased.
- Stock transactions are only on the balance sheet.
- :
- Debit Treasury Stock
- Credit Cash
- Example for reacquiring stock: A company reacquires 20,000 shares of its common stock at $20 per share.
- Step 1: Calculate cash paid.
- 20,000 x $20
- $400,000 is paid.
- Step 2: Make the journal entry.
| Treasury Stock | $400,000 | ||
|---|---|---|---|
| Cash | $400,000 |
- :
- Debit Cash (shares x new price of share)
- Credit Treasury Stock (shares x initial price of stock)
- Credit Additional Paid-In Capital (shares x (new price - old price))
- Example for reissuing stock: A company reissues 10,000 shares of Treasury Stock at $35 per share.
- Step 1: Calculate cash received.
- Shares x New cost per share
- 10,000 x $25
- Cash = $250,000
- Step 2: Calculate Treasury Stock that will be issued.
- Shares x Initial price of stock (from reacquiring example)
- 10,000 x $20
- Treasury Stock = $200,000
- Step 3: Calculate APIC.
- (Shares x (new price - old price))
- (10,000 x ($25 - $20))
- 10,000 x $5
- APIC = $50,000
- Step 4: Make the journal entry.
| Cash | $250,000 | ||
|---|---|---|---|
| Treasury Stock | $200,000 | ||
| APIC | $50,000 |
- Stock transactions NEVER generates gains or losses.
Objective 11.3: Explain and analyze cash dividends, stock dividends, and stock split transactions.
Cash Dividends on Common Stock
- If investors get common stock then they will get a return on their investment.
- Returns on Common Stock investments can come in two forms:
- Dividends
- Increases in stock price
- Growth investment is buying stock that pay a small amount of dividends or no dividends at all.
- Income investments are from common stock that do pay dividends.
- Before a dividend is declared, a company must have:
- Enough retained earnings
- Enough cash
- Dividends are…..
- Declared by a board of directors.
- Not legally required.
- Liabilities once declared
- .
Dividend Dates
- The declaration date is the day when the Board of Directors decide to issue a cash dividend. This is the day the liability is established. Journal entry:
- Debit Dividends
- Credit Dividends Payable
- The date of record is an administrative responsibility.
- No journal entry
- The date of payment reduces the liability and cash. Journal entry:
- Debit Dividends Payable
- Credit Cash
- The year end is when the temporary accounts are closed to Retained Earnings. Journal entry:
- Debit Retained Earnings
- Credit Dividends
- Example:
- Declaration Date: A company declares a cash dividends of $115,000,000 during its 2021 fiscal year.
| Dividend | $115,000,000 | ||
|---|---|---|---|
| Dividend Payable | $115,000,000 |
- Date of record: NO JOURNAL ENTRY
- Date of payment: The previously declared dividend is paid off by the company.
| Dividend Payable | $115,000,000 | ||
|---|---|---|---|
| Cash | $115,000,000 |
- Year end: The company’s temporary accounts are closed into Retained Earnings at the end of their accounting period.
| Retained Earnings | $115,000,000 | ||
|---|---|---|---|
| Dividends | $115,000,000 |
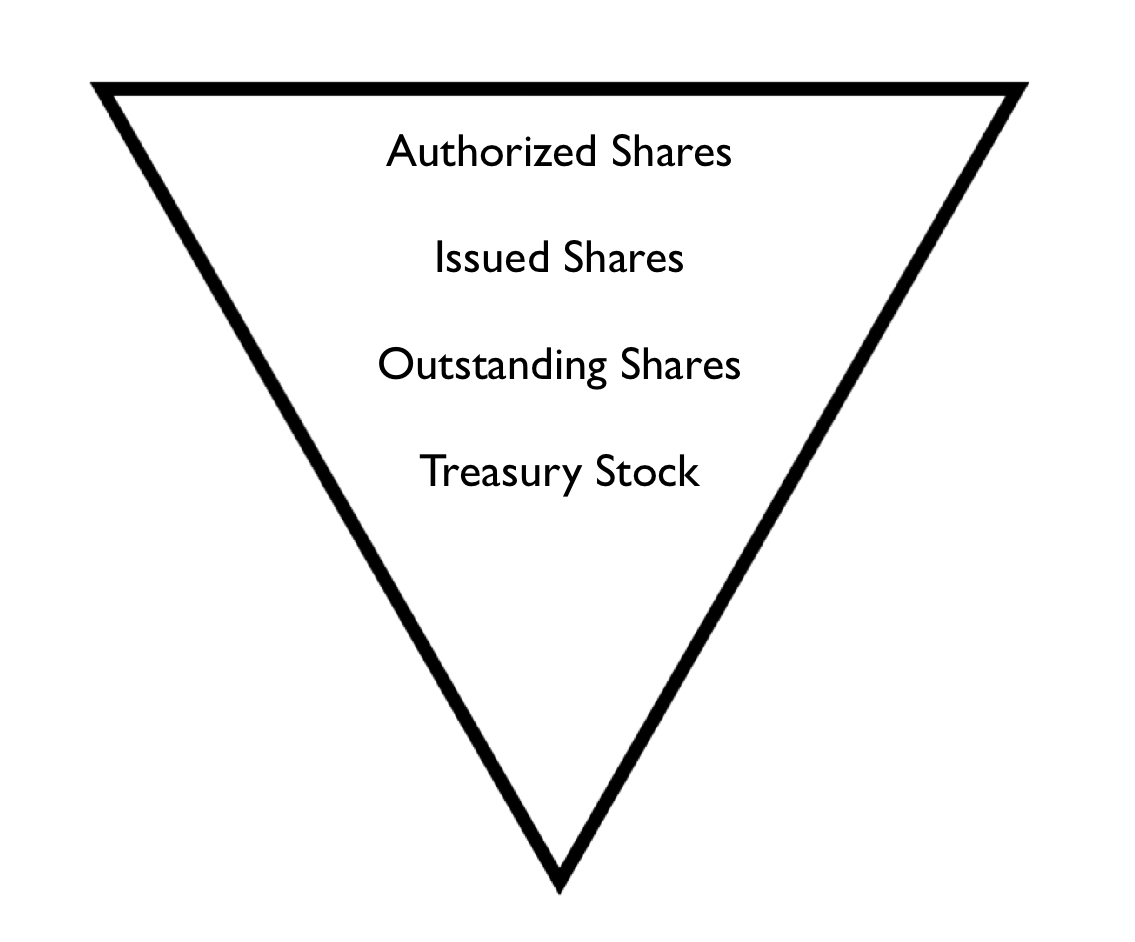
The Common Stock Triangle 🔽
- Authorized shares are the max amount of shares that can be issued.
- Issued shares are given to shareholders.
- Outstanding shares are what has not been issued.
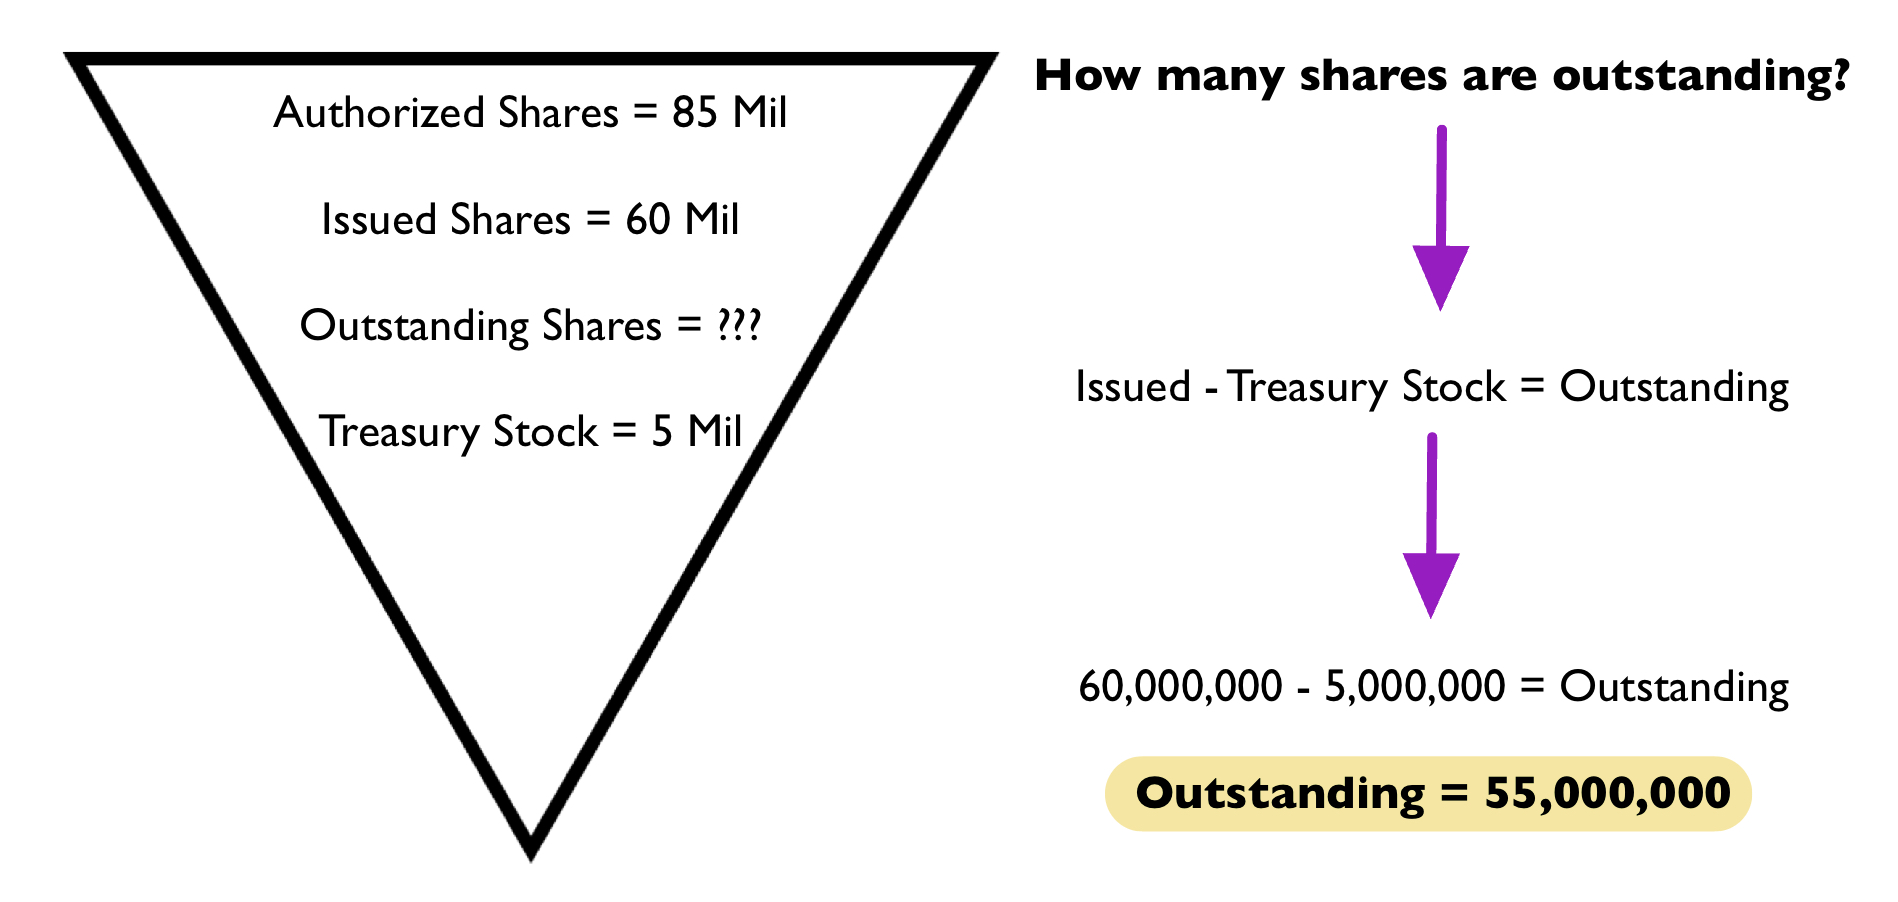
- ==Equation to calculate outstanding shares:==
- Issued - Treasury shares = Outstanding Shares
- Example:
Objective 11.4: Describe the characteristics of preferred stock and analyze transactions affecting preferred stock.
Preferred Stock
- Preferred stock is given to a special group of investors.
- Preferred stock has different features such as:
- It has different voting rights (none or a lot).
- Dividends may be paid at a fixed rate.
- It has priority over normal common stock.
- Preferred Stock Issuance increases cash and stockholders’ equity.
Preferred Stock Redemption
- Preferred stock that was issued can be bought back.
- This redemption means the preferred stock is retired, which results in the issuance being reversed.
Preferred Stock Dividends
- Preferred stock gives two dividends preferences:
- Current dividend preference
- Cumulative dividend preference
- A current dividend preference states that preferred dividends must be paid before paying dividends to stockholders.
- A cumulative dividend preference states if a current dividends is not paid, the unpaid amount has to be paid before other common dividends.
- Dividends in arrears regard cumulative preferred stock that has not been paid yet. They are not on the balance sheet.
Retained Earnings
- Retained Earnings are the collective earnings of a company.
- Net income increases Retained Earnings.
- Net loss decreases Retained Earnings.
- Giving cash or dividends to stockholders also decreases Retained Earnings.
- The negative balance of Retained Earnings is called accumulated deficit.
Statement of Stockholders’ Equity
- The statement of stockholders’ equity shows each stockholders’ equity account so we can track increases and decreases for each account.
- Examples of what may be included:
- Issued shares
- Treasury stock
- Net income
- Cash dividends
- Stock dividends
- Common stock
- APIC
- Retained Earnings
Objective 11.5: Analyze the earnings per share (EPS), return on equity (ROE), and price/earnings (P/E) ratios.
Earnings Per Share (EPS)
- Earnings per share provides information on the profit earned from common stock that is outstanding.
- Recent earning ratios can look into how dividends and stock prices may be in the future.
- Using EPS, you can compare the financial ratio to other years.
- You can not compare companies using this ratio.
- The higher that ratio, the better.
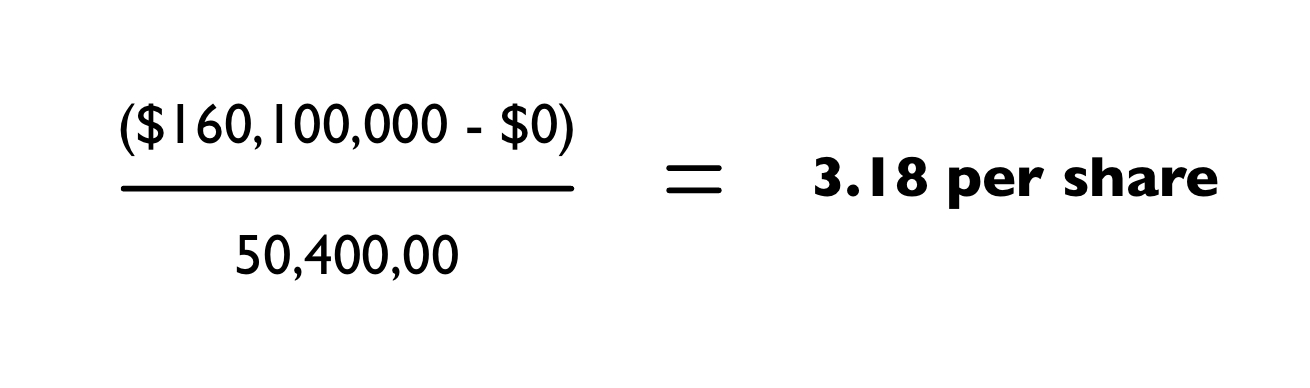
- ==Equation to calculate earnings per share:==
- (Net Income - Preferred Dividends)/ Average number of Common Shares Outstanding
- Example: A company’s income for 2022 was $160,100,000. It has $0 of preferred dividends. The average number of its outstanding shares was 50,400,000.
Return on Equity (ROE)
- Return on Equity reports a company’s return to stockholders.
- The ratio can be compared across companies.
- The higher the ratio, the better.
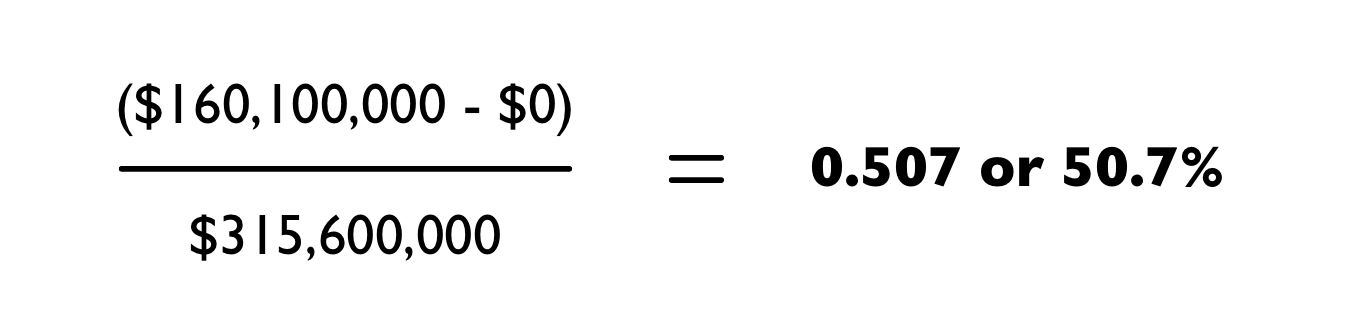
- ==Equation to calculate return on equity:==
- (Net Income - Preferred Dividends)/ Average Common Stockholders’ Equity
- Example: A company’s income for 2022 was $160,100,000. It has $0 of preferred dividends. The average common stockholders equity was $315,600,000.
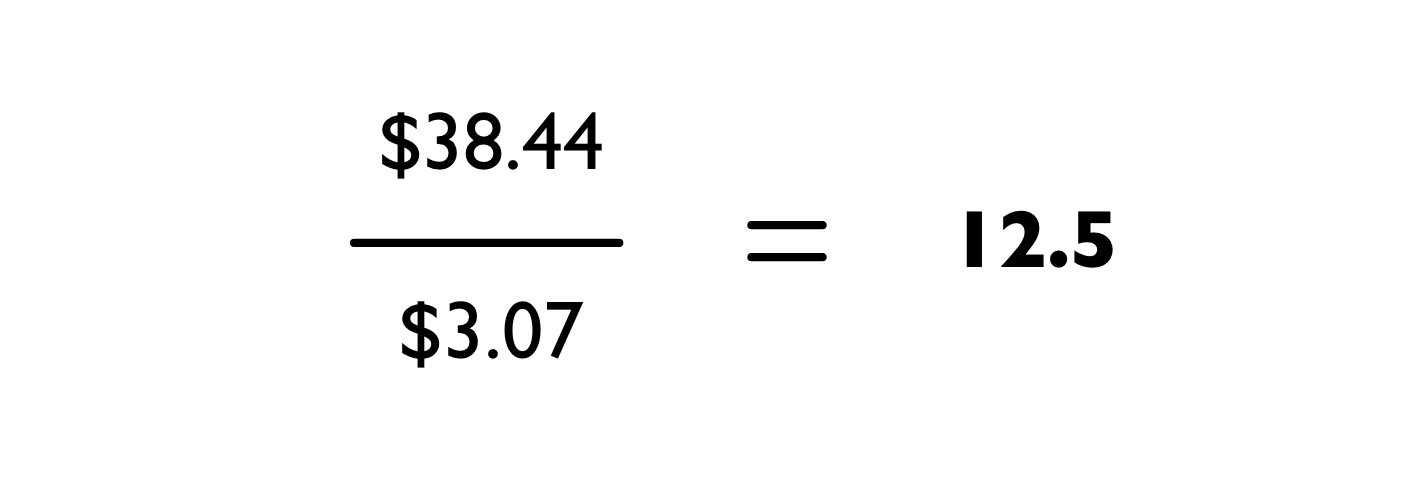
Price/Earnings (P/E) Ratio
- The Price/Earnings ratio is a measure of the value that investors place on a company’s common stock.
- The current stock price comes from the stock exchange.
- With this ratio, you need to calculate EPS before calculating P/E.
- ==Equation to calculate the price/earning ratio:==
- Current Stock Price (per share)/ Earning Per Share (annual)
- Example: A company’s stock price was $38.44 when the company reported its 2022 EPS of $3.07.