3b. Inequality
Inequality
Inequality is an unequal distribution of resources. This could be of income or wealth.
Income is a flow. It measures the receipt of money per period of time (e.g £200 a week)
Wealth is a Stock. It measures the value of a person’s wealth at a given point of time e.g. property valued at £150,000
Lorenz curves
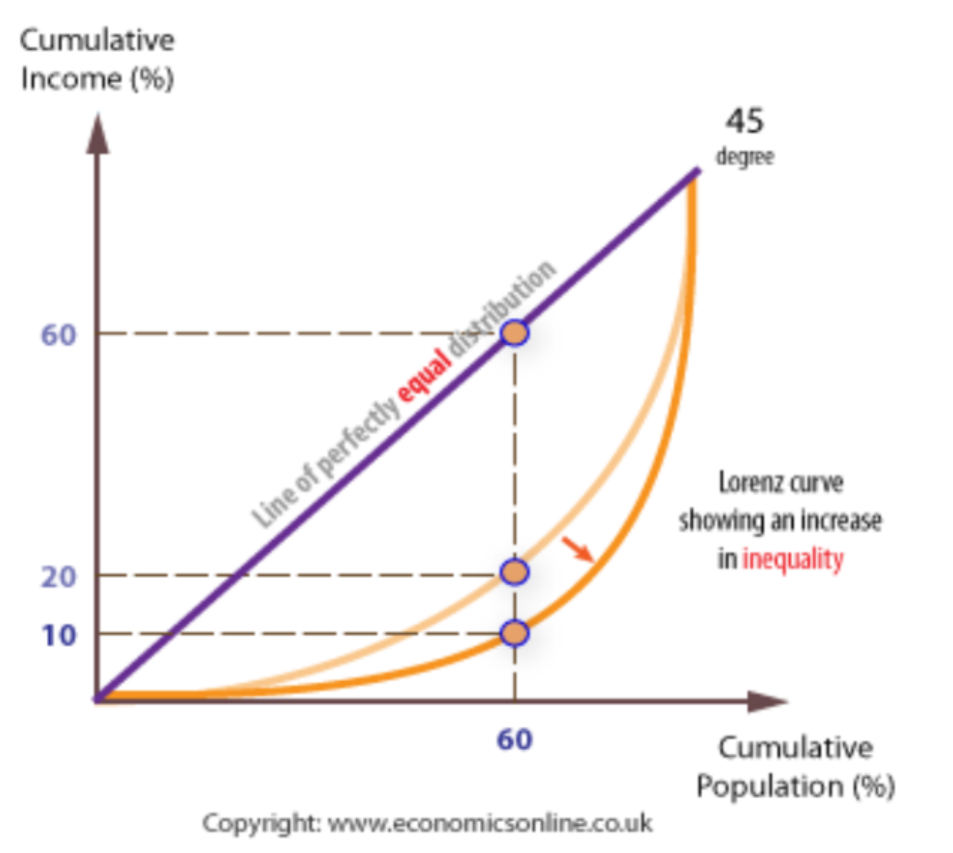
The Lorenz Curve plots the cumulative % of the population and plots this against the cumulative % of income. This is then compared to a line of perfect equality where the poorest 10% would have 10% of the income, the poorest 20% would have 20% of the income etc.
In this example the poorest 60% only have 20% of the income.

Lorenz curves
The further away from the line of perfect equality a county is, the more unequal it has become.
Gini co-efficient
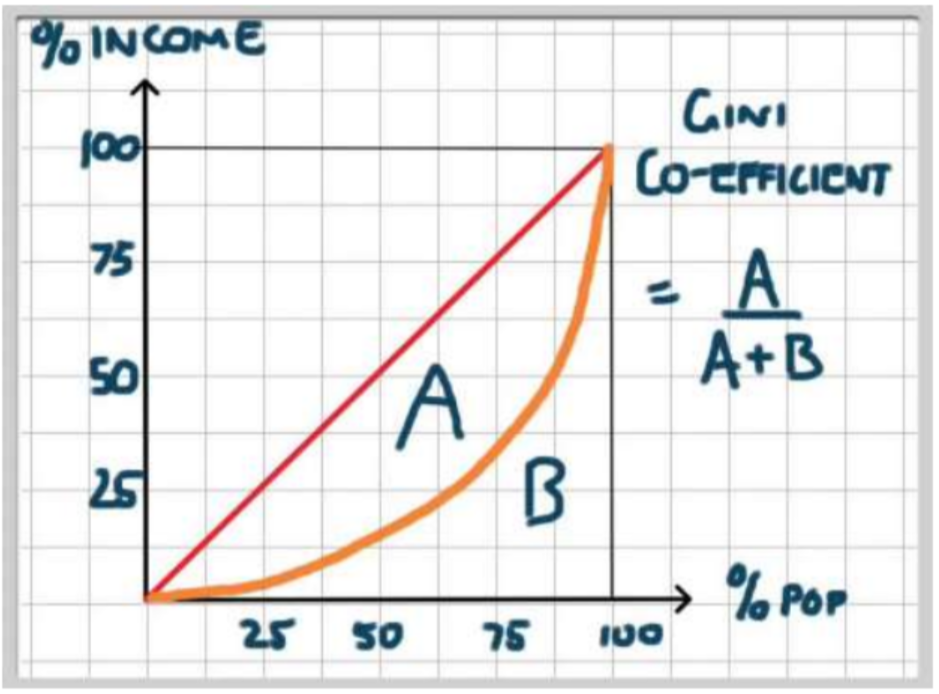
The Gini index measures the area between the Lorenz curve and a hypothetical line of absolute equality, expressed as a percentage of the maximum area under the line.
A low Gini coefficient indicates a more equal distribution, with 0 corresponding to complete equality, while higher Gini coefficients indicate more unequal distribution, with 1 corresponding to complete inequality (this is sometimes shown from 0 to 100)
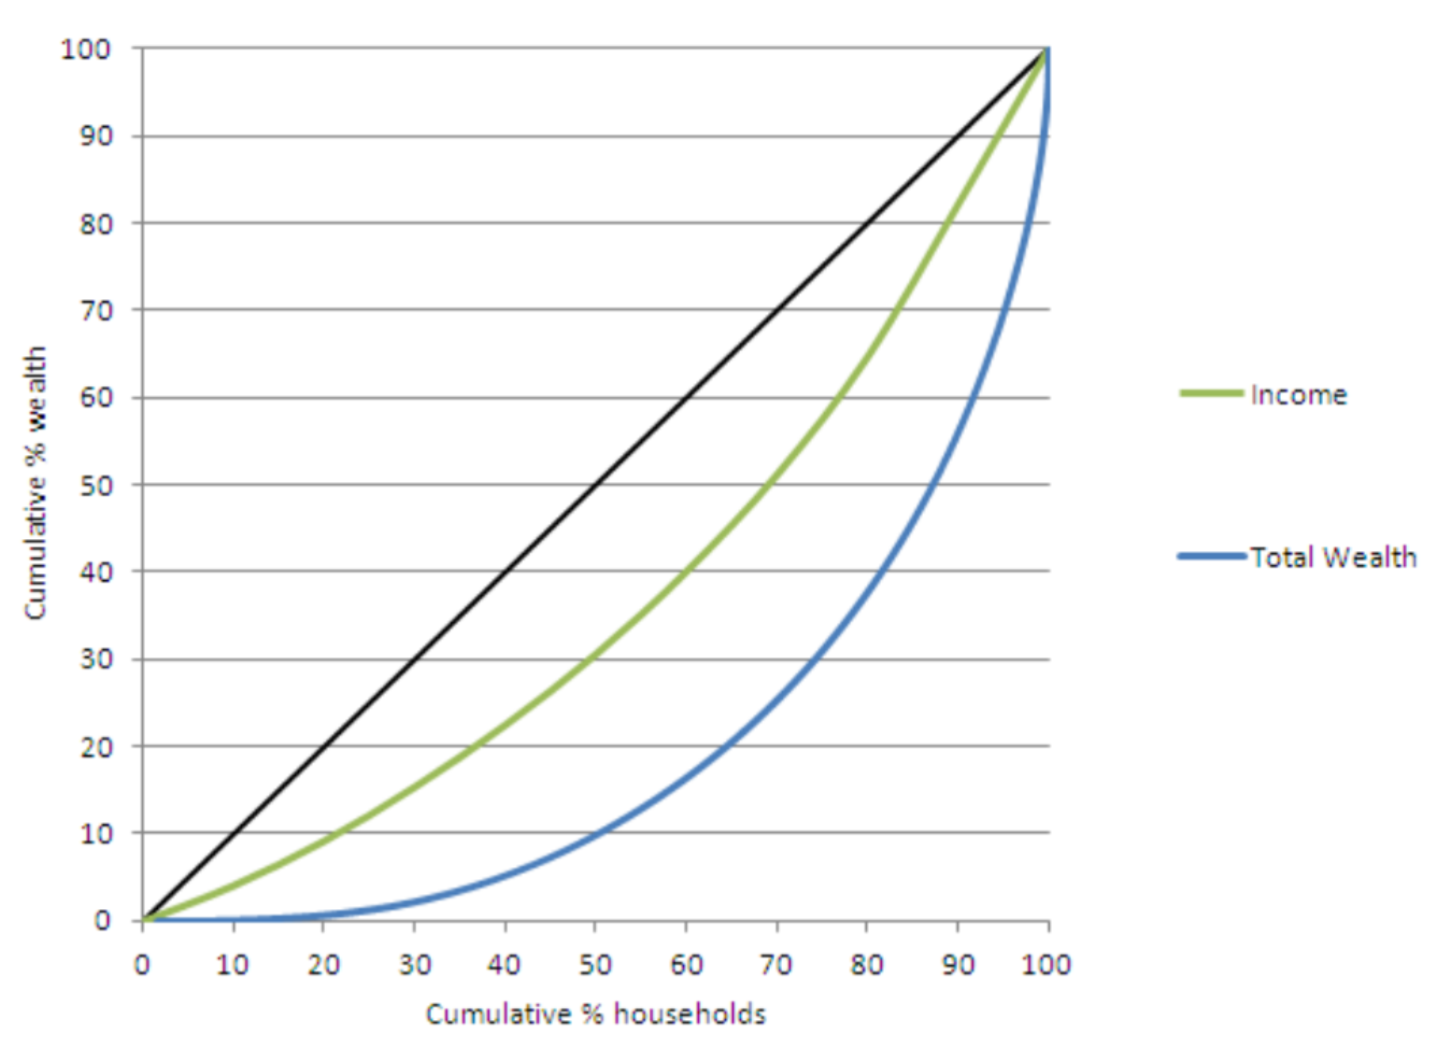
UK Lorenz Curves- Why the difference between income and wealth?
Causes of income inequality within countries
Education
Higher skilled workers tend to attract higher pay
Wages
Depends on the strength of trade union power and levels of discrimination (e.g. female pay gap or Indian caste system)
Unemployment
High unemployment leads to greater disparities in income
Low Benefits
Regressive Taxation
Wealth
The owners of wealth normally receive an income stream e.g. rent or dividends from their assets