~AP Calc AB Unit 1 Review~
Objectives:
-Know the Squeeze Theorom and Intermediate Value Theorom
-Know how to evaluate limits algebarically, from functions, and from graphs
-Determine Continiuity and Remove Discontuitys
-Handle infinite limits
Notes source:
Notes on unit 1.1-Can change occur at an instant?
-The foundational idea of limits is that we’re moving from an average rate of change to an instanteous rate of change.
-Formula for average rate of change: change in y/change in x
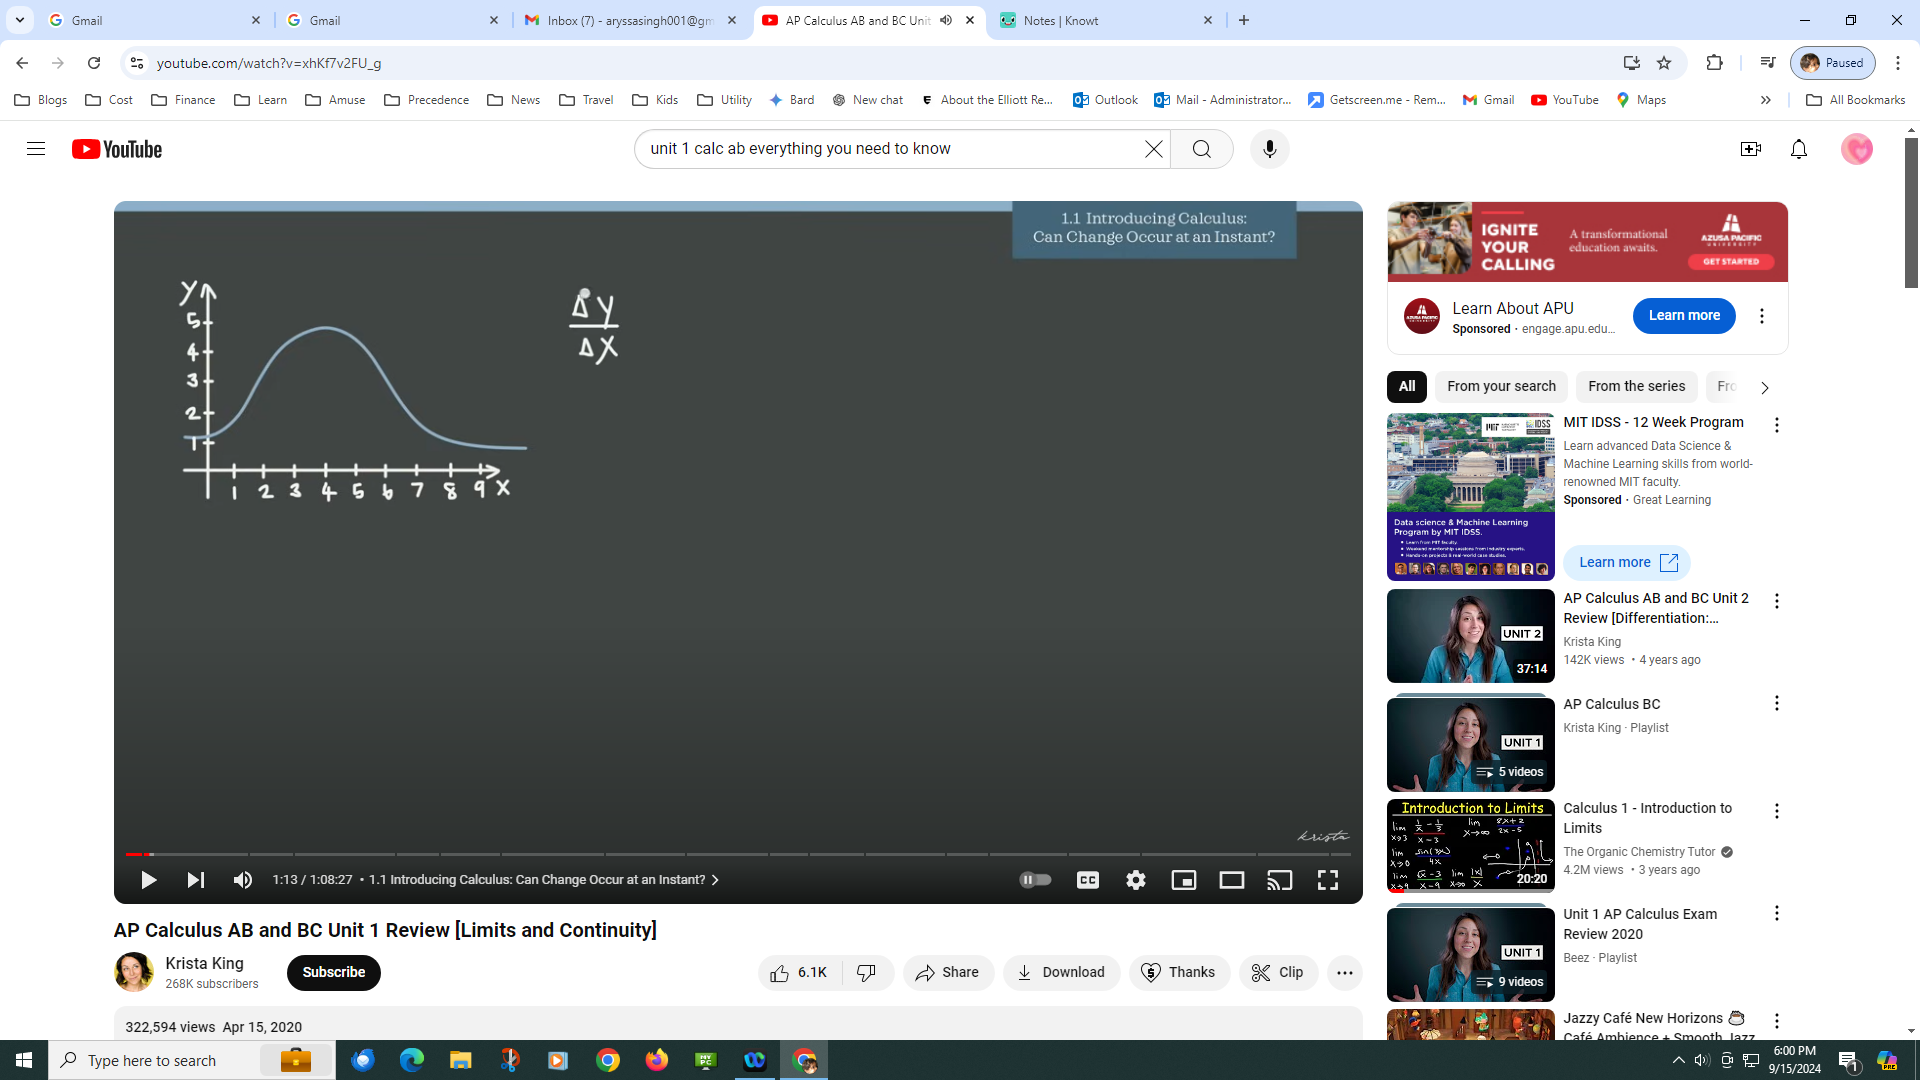
-Now let’s say on this graph, that we want to find the instatenous rate of change between the point (2,3), and (7,2).
Work: 2-3/7-2=-1/5. It’s just like the slope formula! This tell us that if we move 5 units right we will move 1 unit down!
The change in y over change in x formula is calculus is also often written as f(x)-f(a)/x-a.
Also, the denominator can not equal zero, because in math we can’t decide by zero. Whtn the denominator equals zero, the function has a limit. So if we doing the math work we previously did and there was a zero at the deminator, we would apply the concept of a limit to that difference quotient. (The difference quotient is the formula where we plugged in the numbers.) We would then be applying a limit to an instatenous rate of change.
-We can also estimate a limit using a table of values. Let’s look at an example.
x | 5 | 7 |
f(x) | -8 | 1 |
ignore this | ignore this | ignore this |
-Normally, there are more values in a table then this, but I’m not very good at using Knowt for taking notes. But, we could plug in these values in the formula find average rate of change.
Notes on 1.2: Defining Limits and using Limit Notation
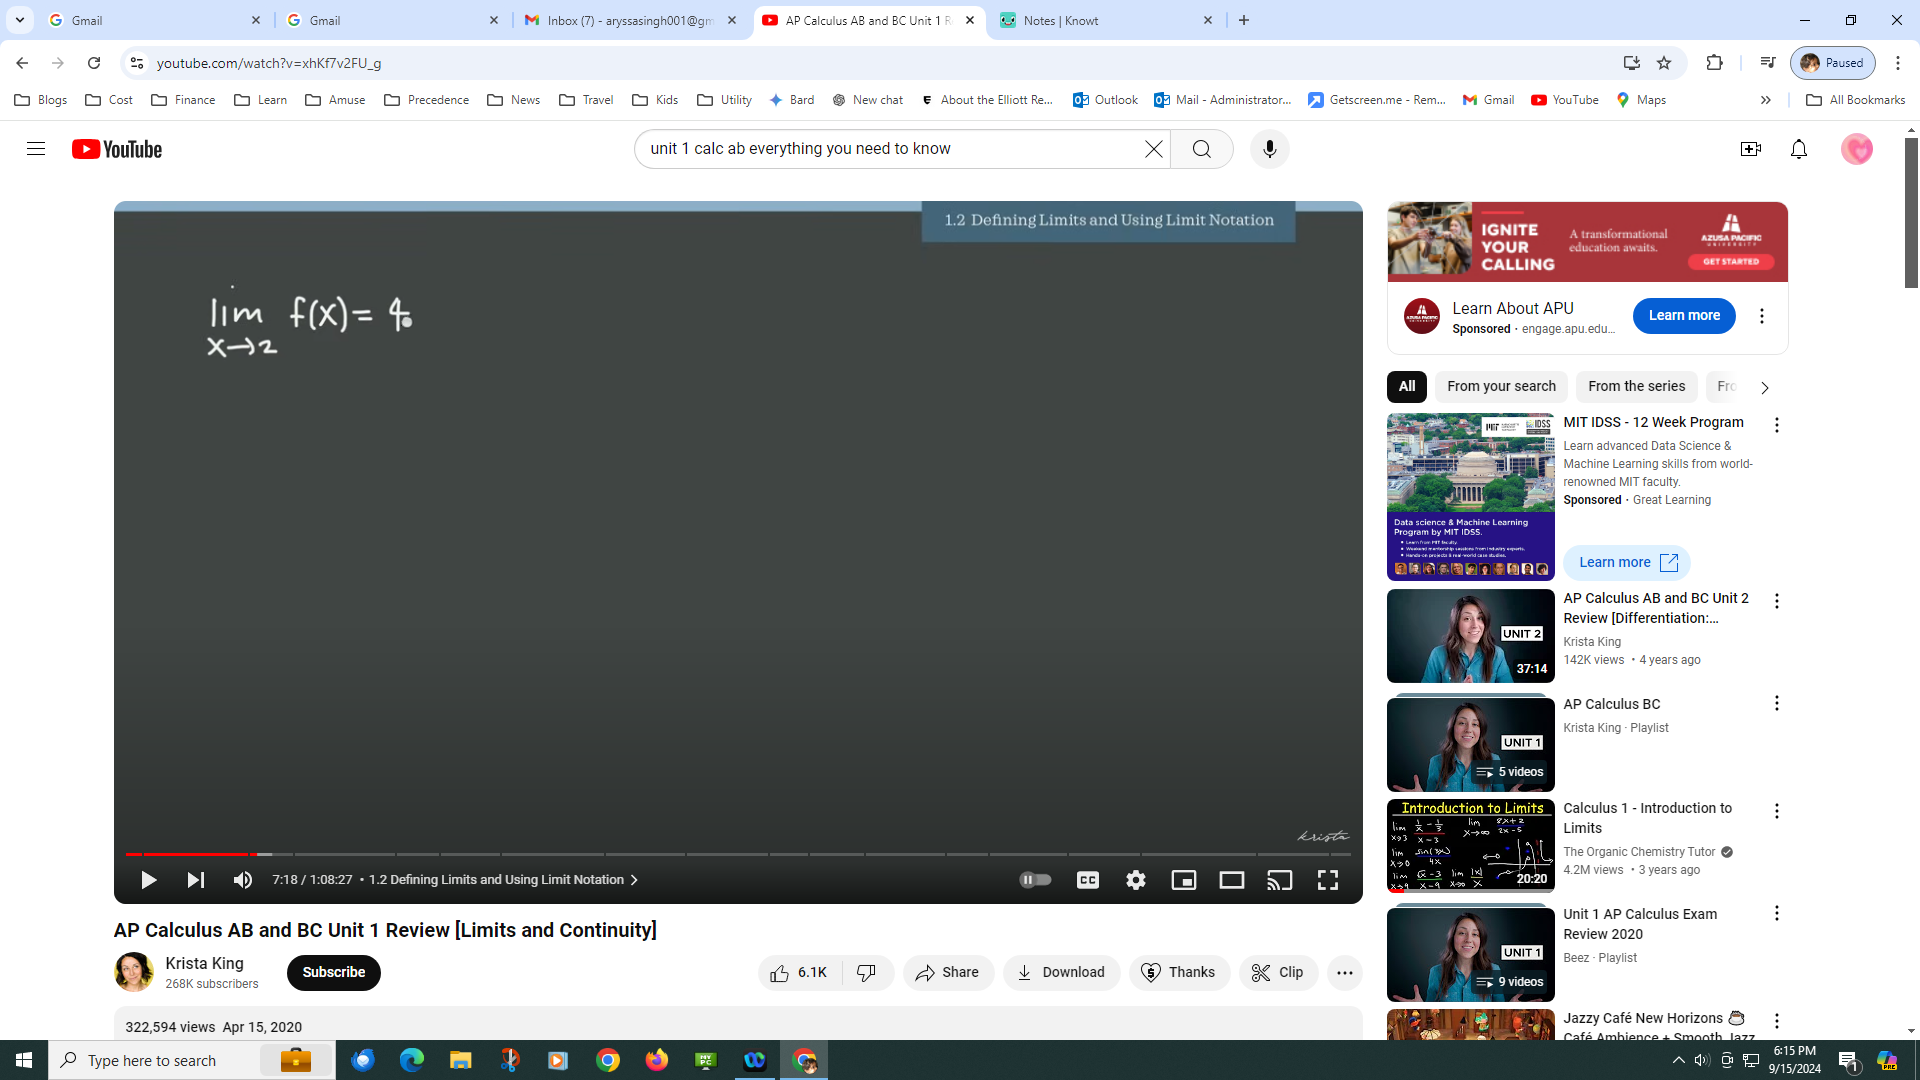
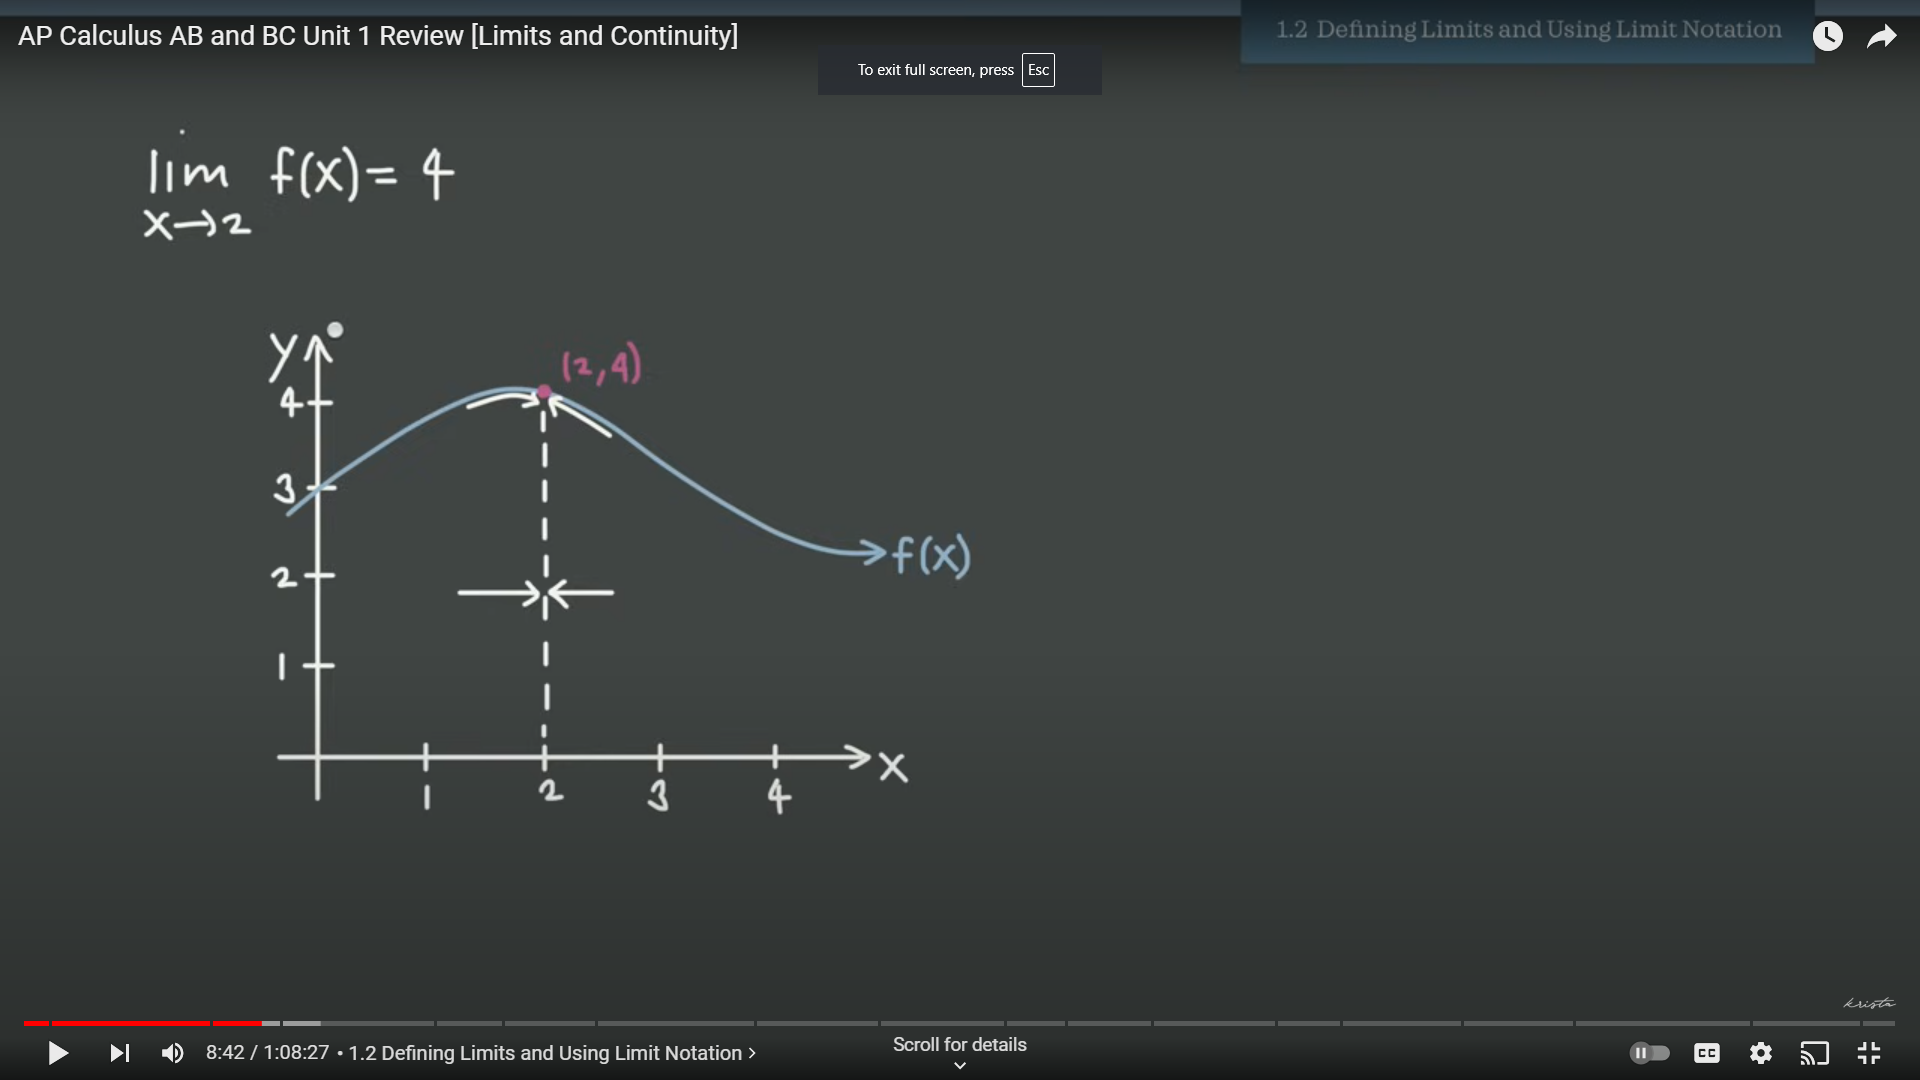
This would read as the limit as f(x) approaches two equals four. All this means is that if we sketch this function, if the function gets closer to two, the value of the function will get closer to four. Shown below is what this looks like visually.
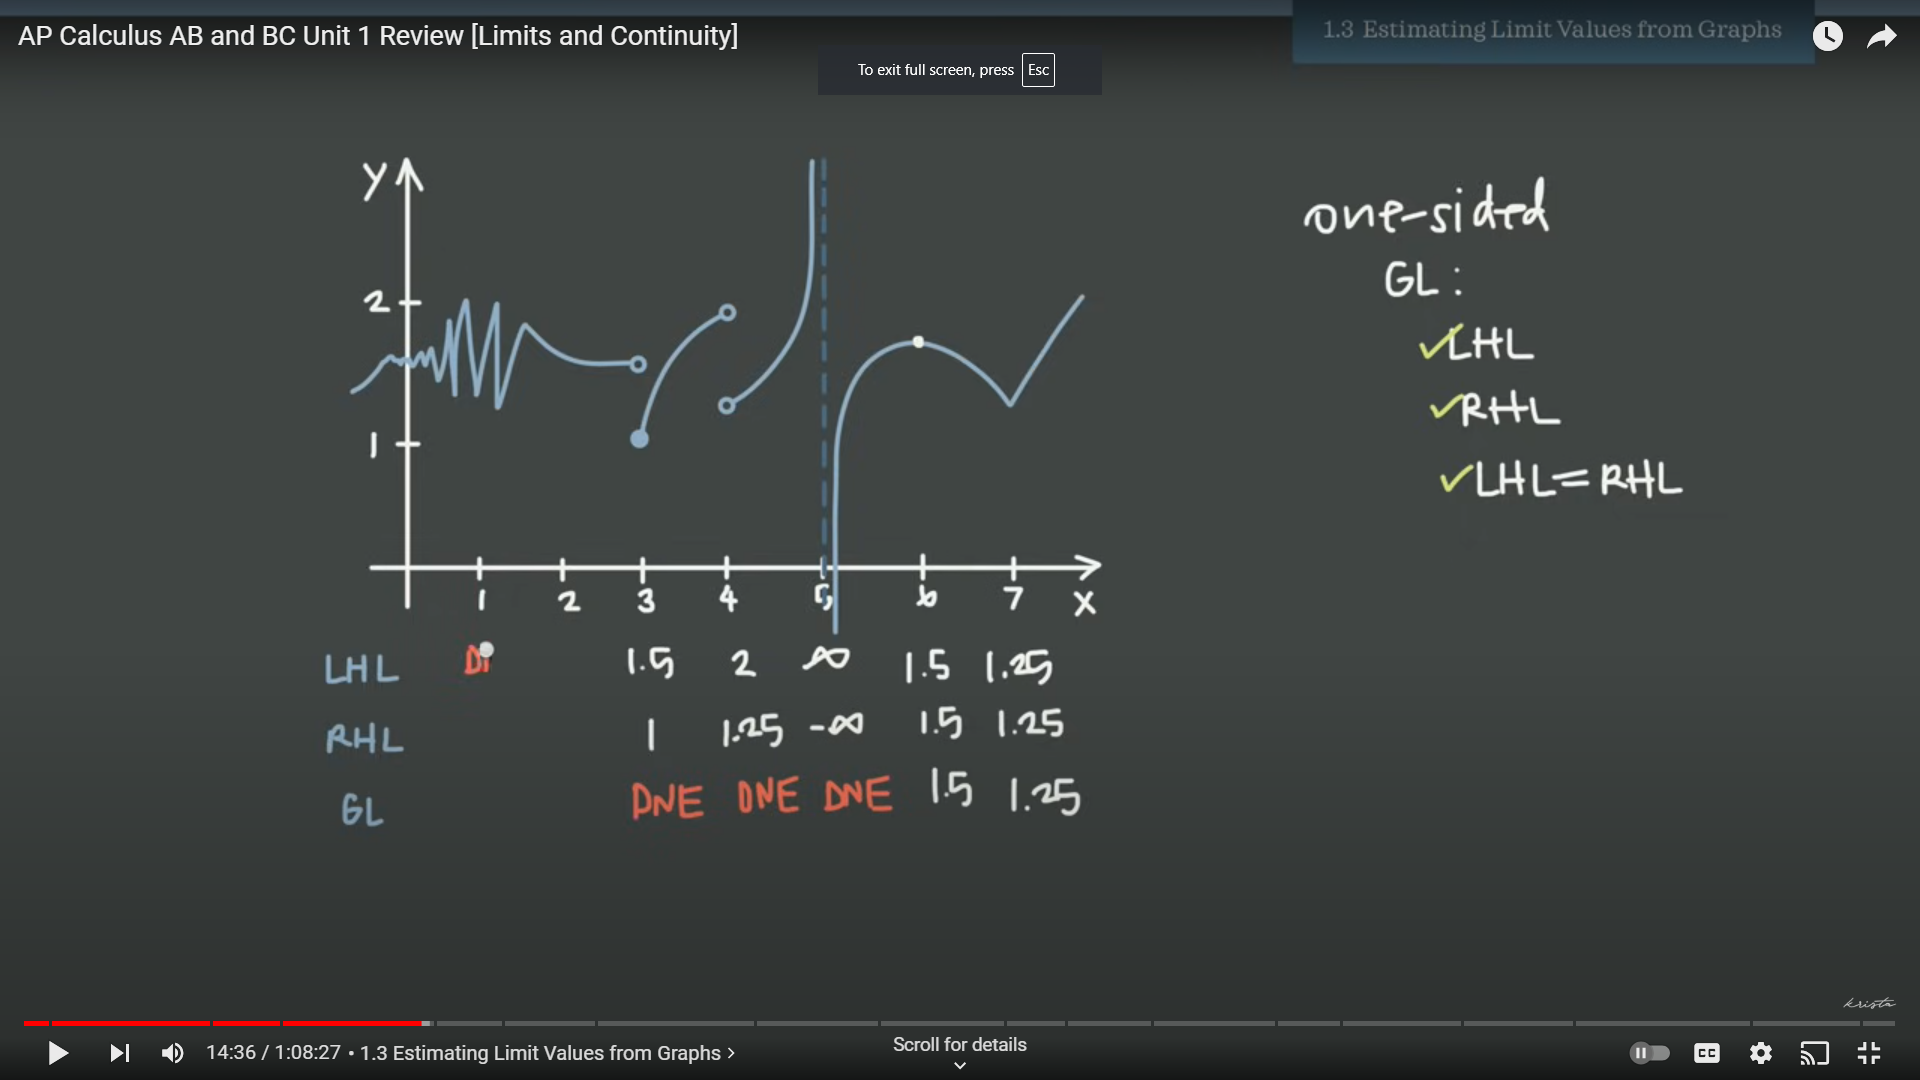
Left hand Limit-Does not exist
Right hand limit-Does not exist
General limit: Does not exist
Breakdown of all the limits: At every point along the graph, we can think abotu a right hand limit, a left hand limit, and a general limit. Right side limits and left side limits can be different.
-However, in order for the general limit to exist, the left and right hand limits to be equall.
At x=3, the left hand limit is about 1.5. The right hand limit is one. These aren’t equal, so the General Limit Doesn’t Exist.
At x=4, we would say that the left hand limit is about two. The right hand limit looks like we are approaching about 1.25 Therefore the General Limit can’t exist here either.
-Since the asymtope is there, the limit on the left is positive infinity. At the right hand side, it’s at negative infinity. The general limit doesn’t exist.
-The asymptope doesn’t impact the last part of the graph, as we can see that we’re approaching 1.25 on both sides. Therefore, the general limit for that part of the graph is 1.25.
-Oscilatting functions aren’t approaching a value.
1.4: Estimating Limit Tables from a graph
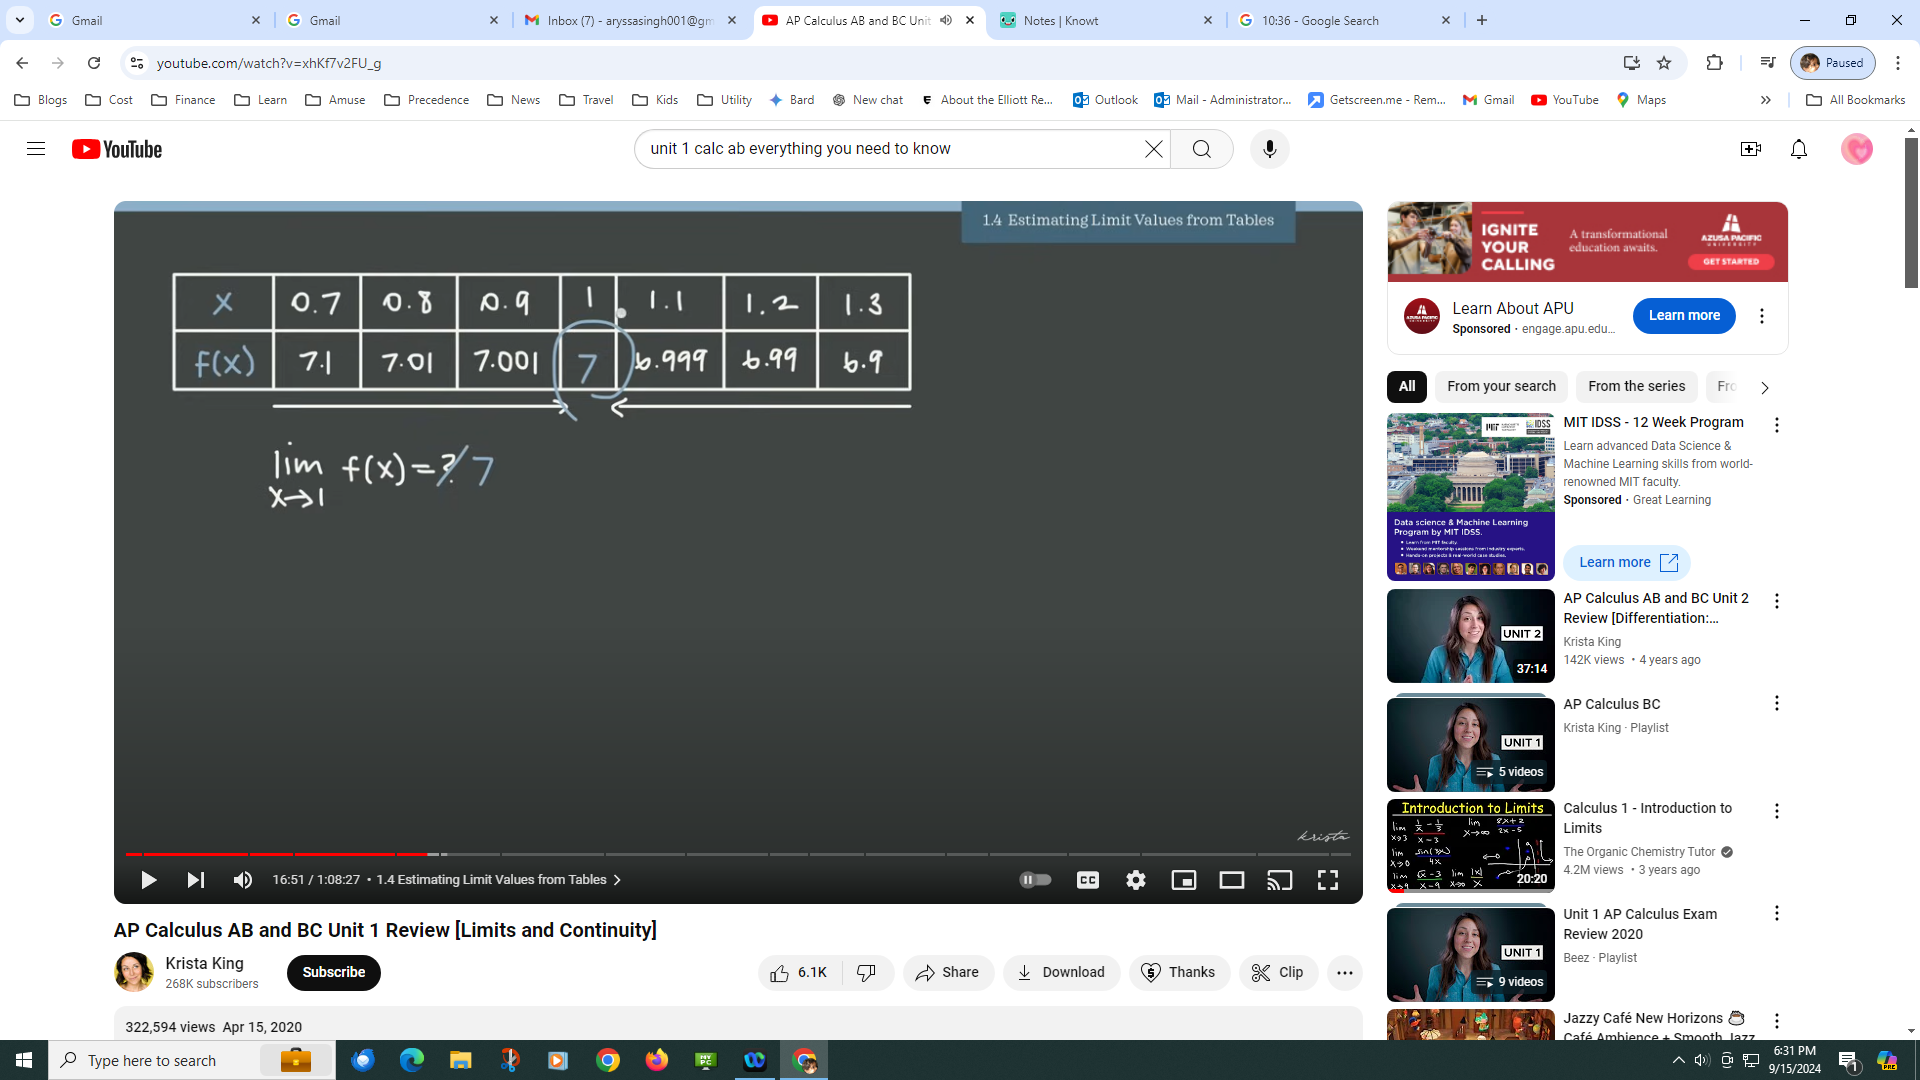
Here, it’s clear that on both sides that as x approarches one, the limit is seven. Just to clairfy, 7 wasn’t in the original dataset given. But we can see that form both sides as x approaches one, y or f(x) approaches seven.
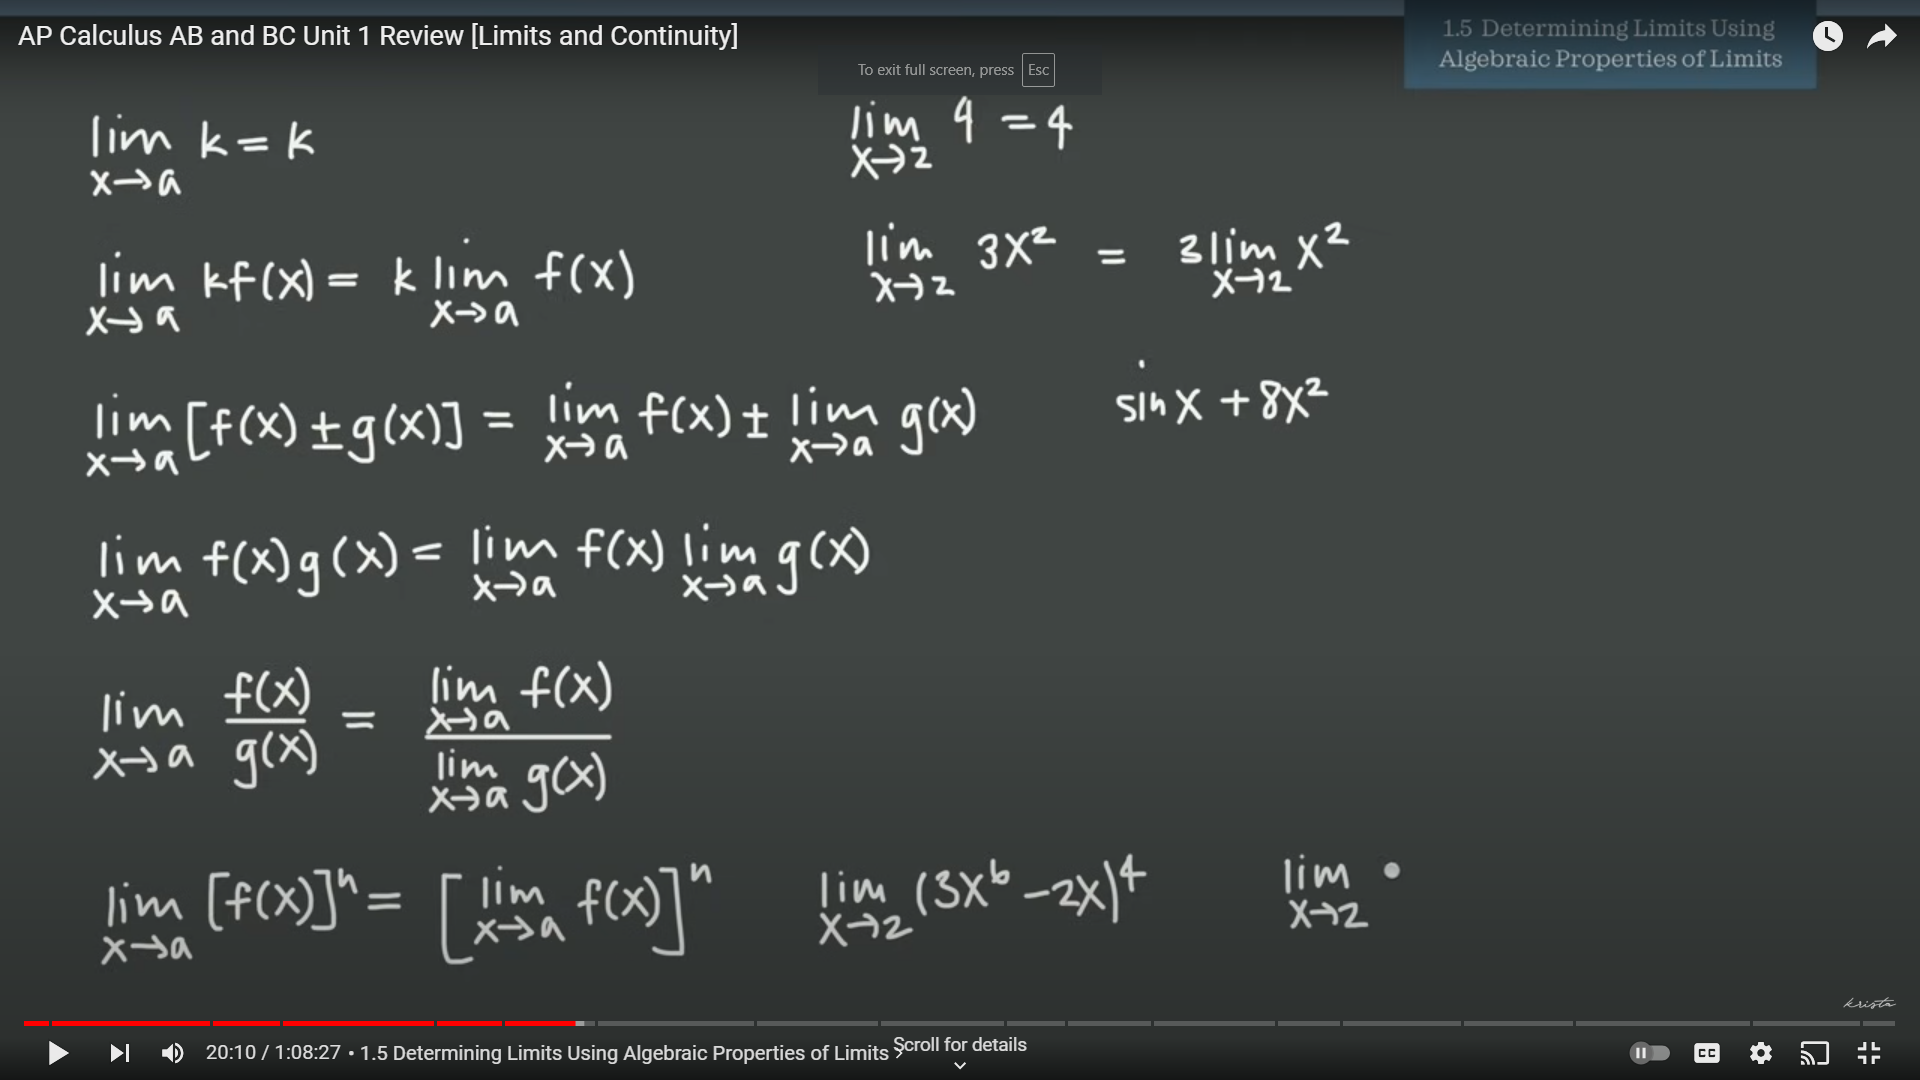
1.5: Determining Limits Using Algberaic Properties of Limits
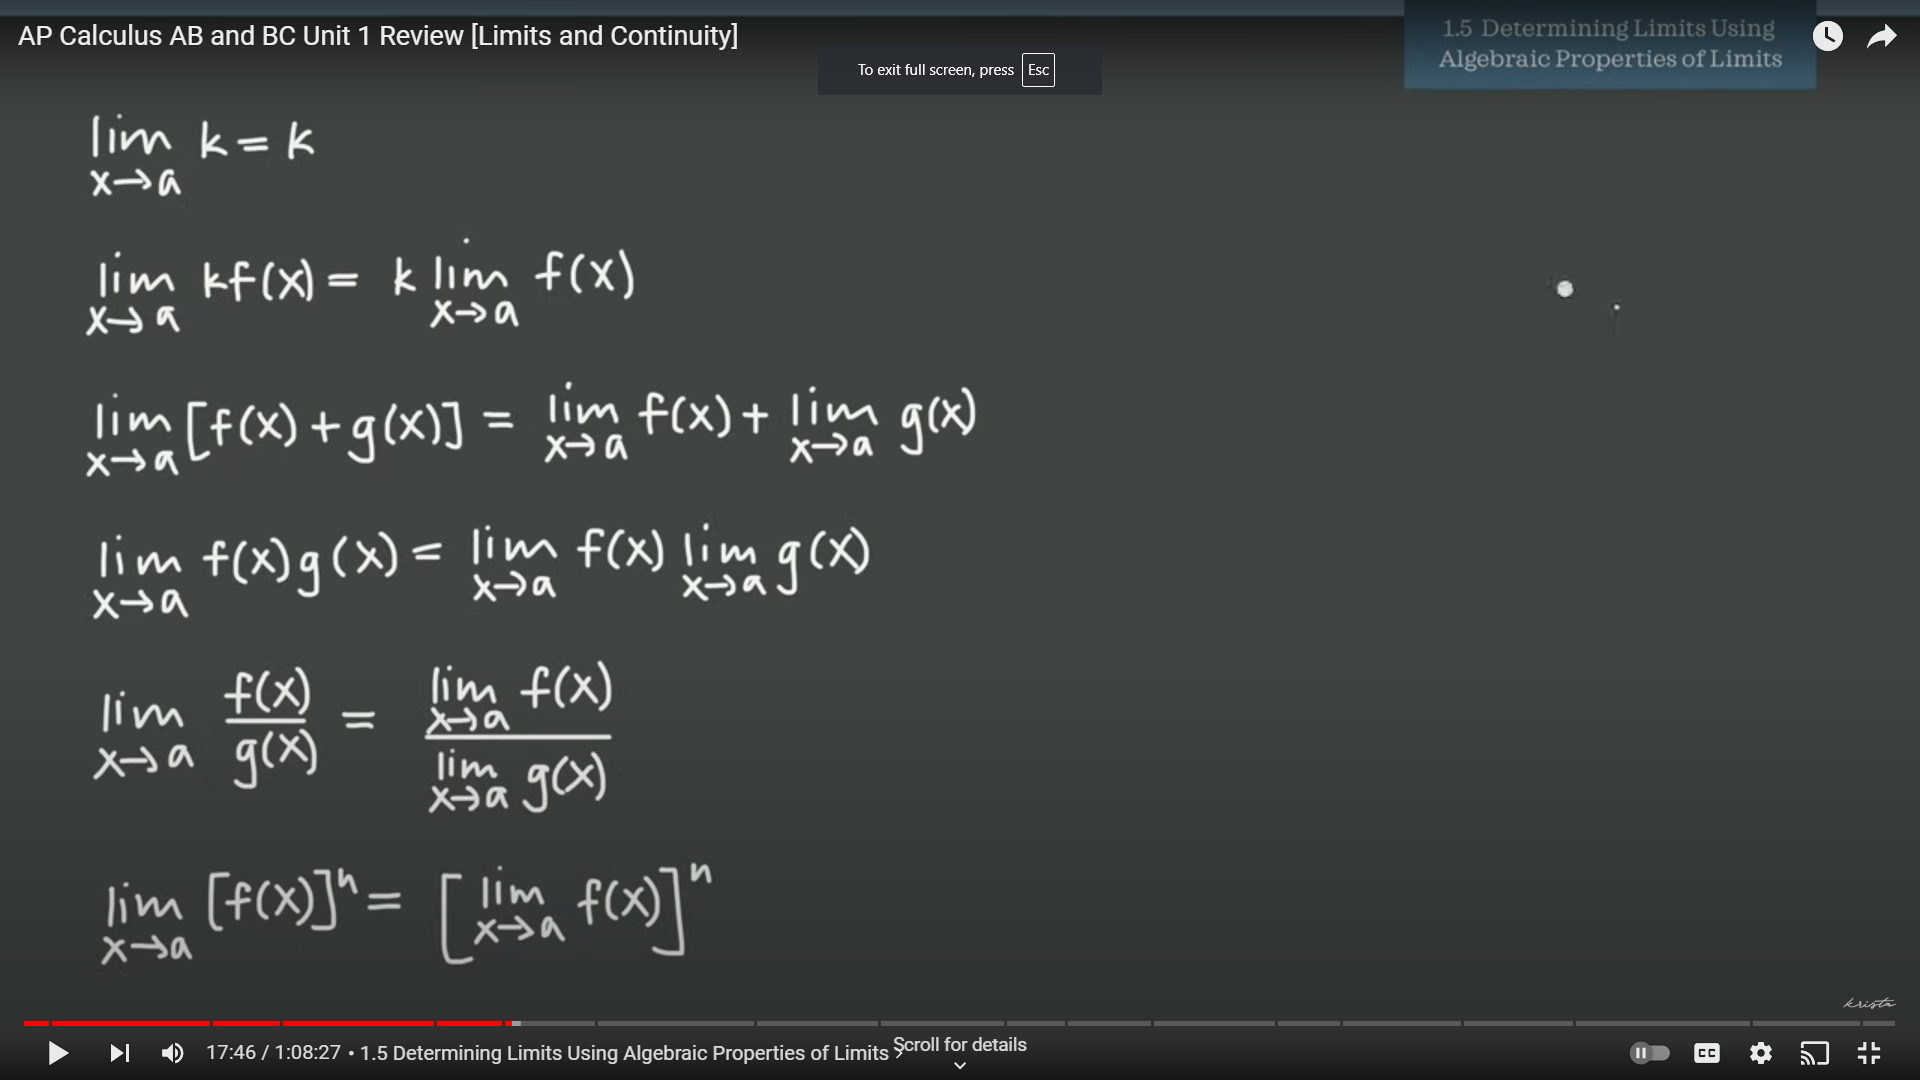
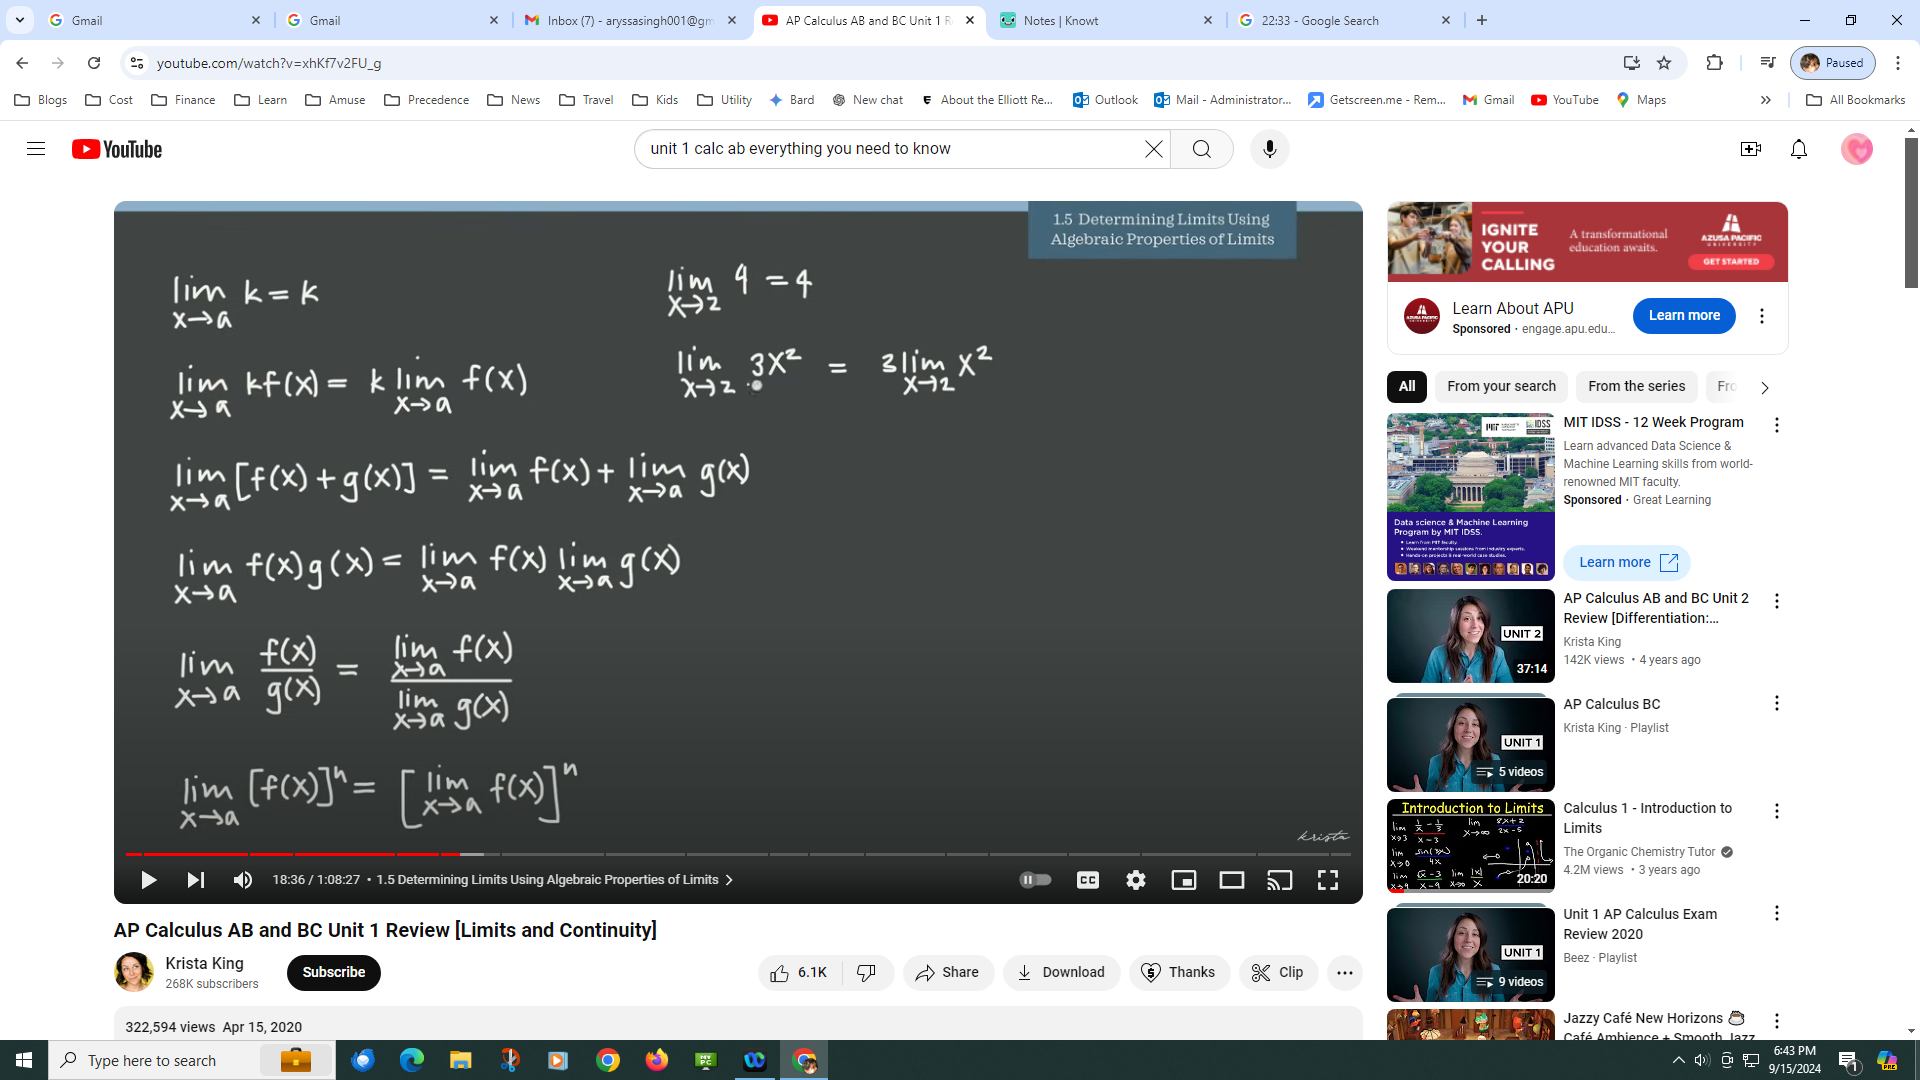
-The first formula tells us that as the limit approaches a, k will be constant at a. So if you were to, for example, plug in three for a and 6 for k, the limit as 3 approaches six will always be six.
-The second formula deals with rewriting limits, which I will show below.
1.16: Determinig Limits using algebraic manipulation
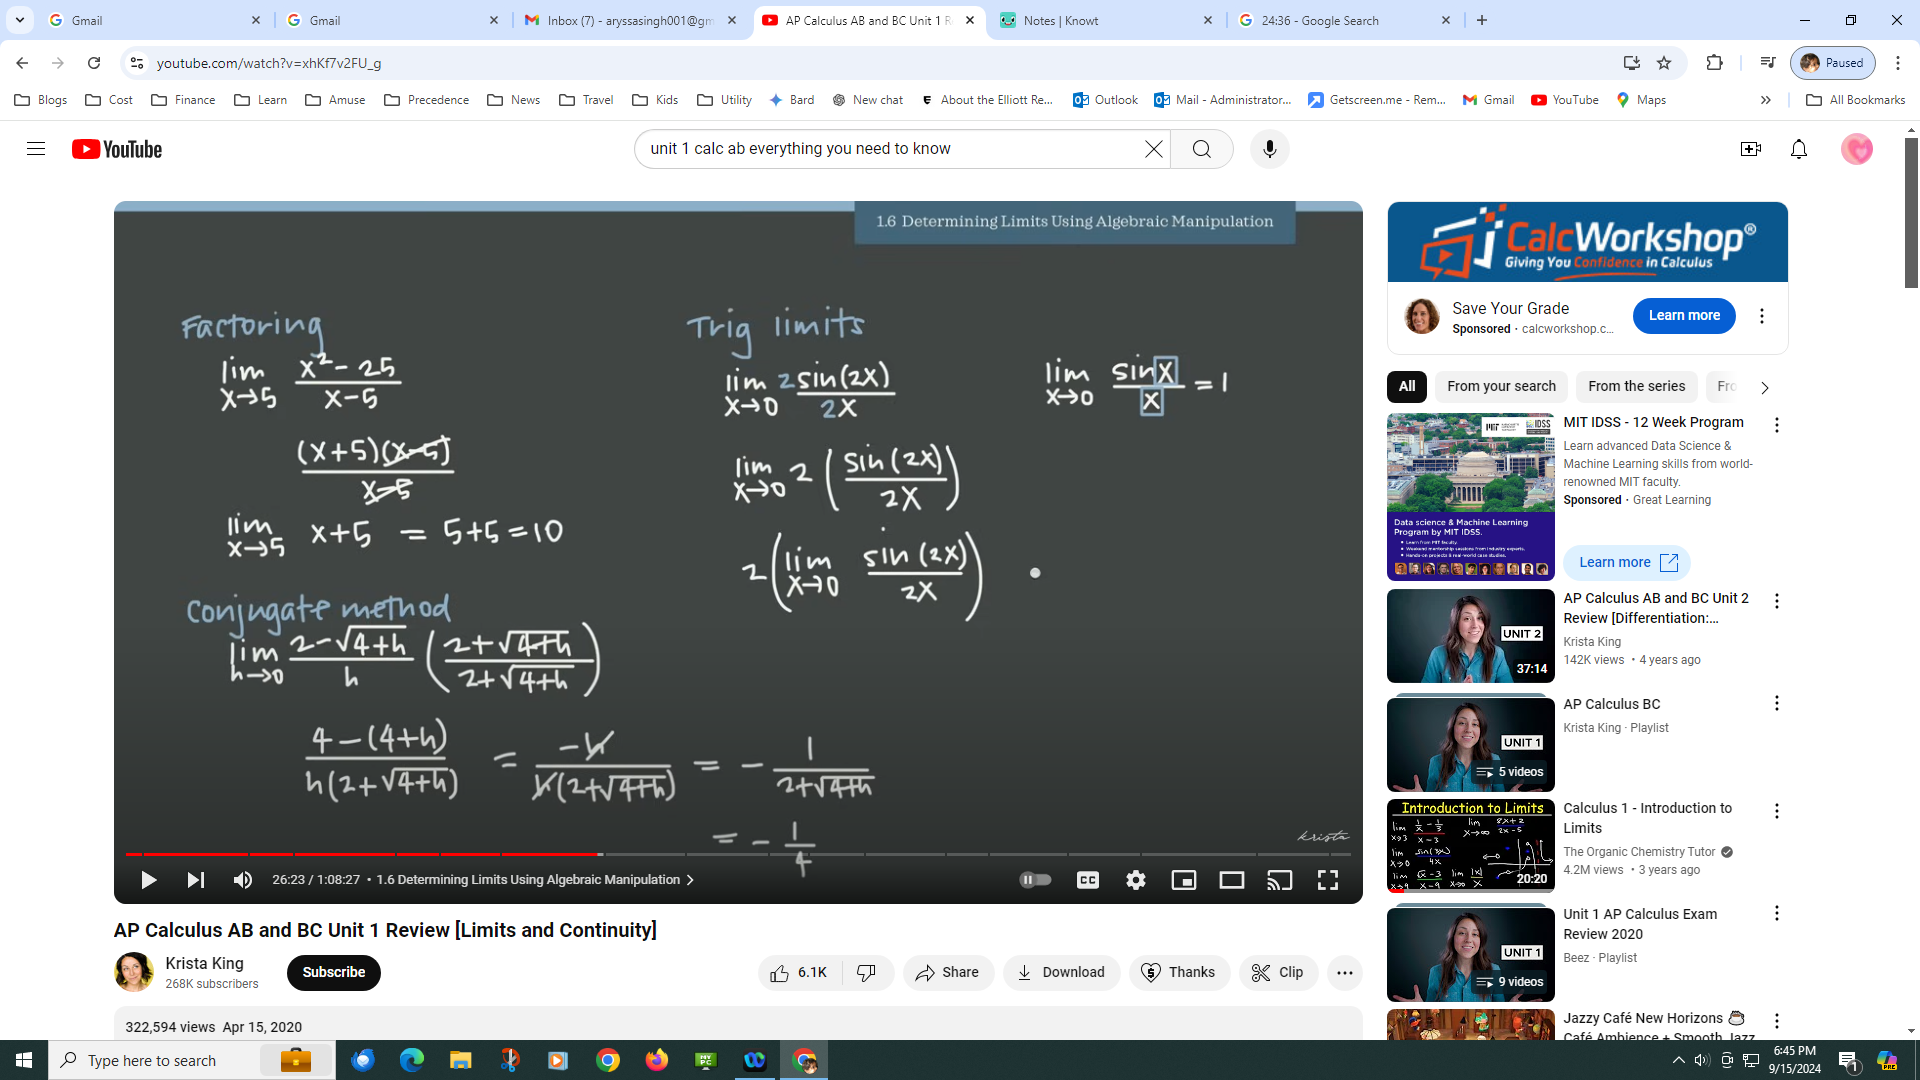
-For the conjugate method, we take the two term bionomial and change their signs. A bionomial algebraic expression having exactly two unlike terms, including the variables and the constant.
-MEMORIZE: as the limit of f(x) approaches zero, sinx/x=1.
1.10: Identifying Discontinuity
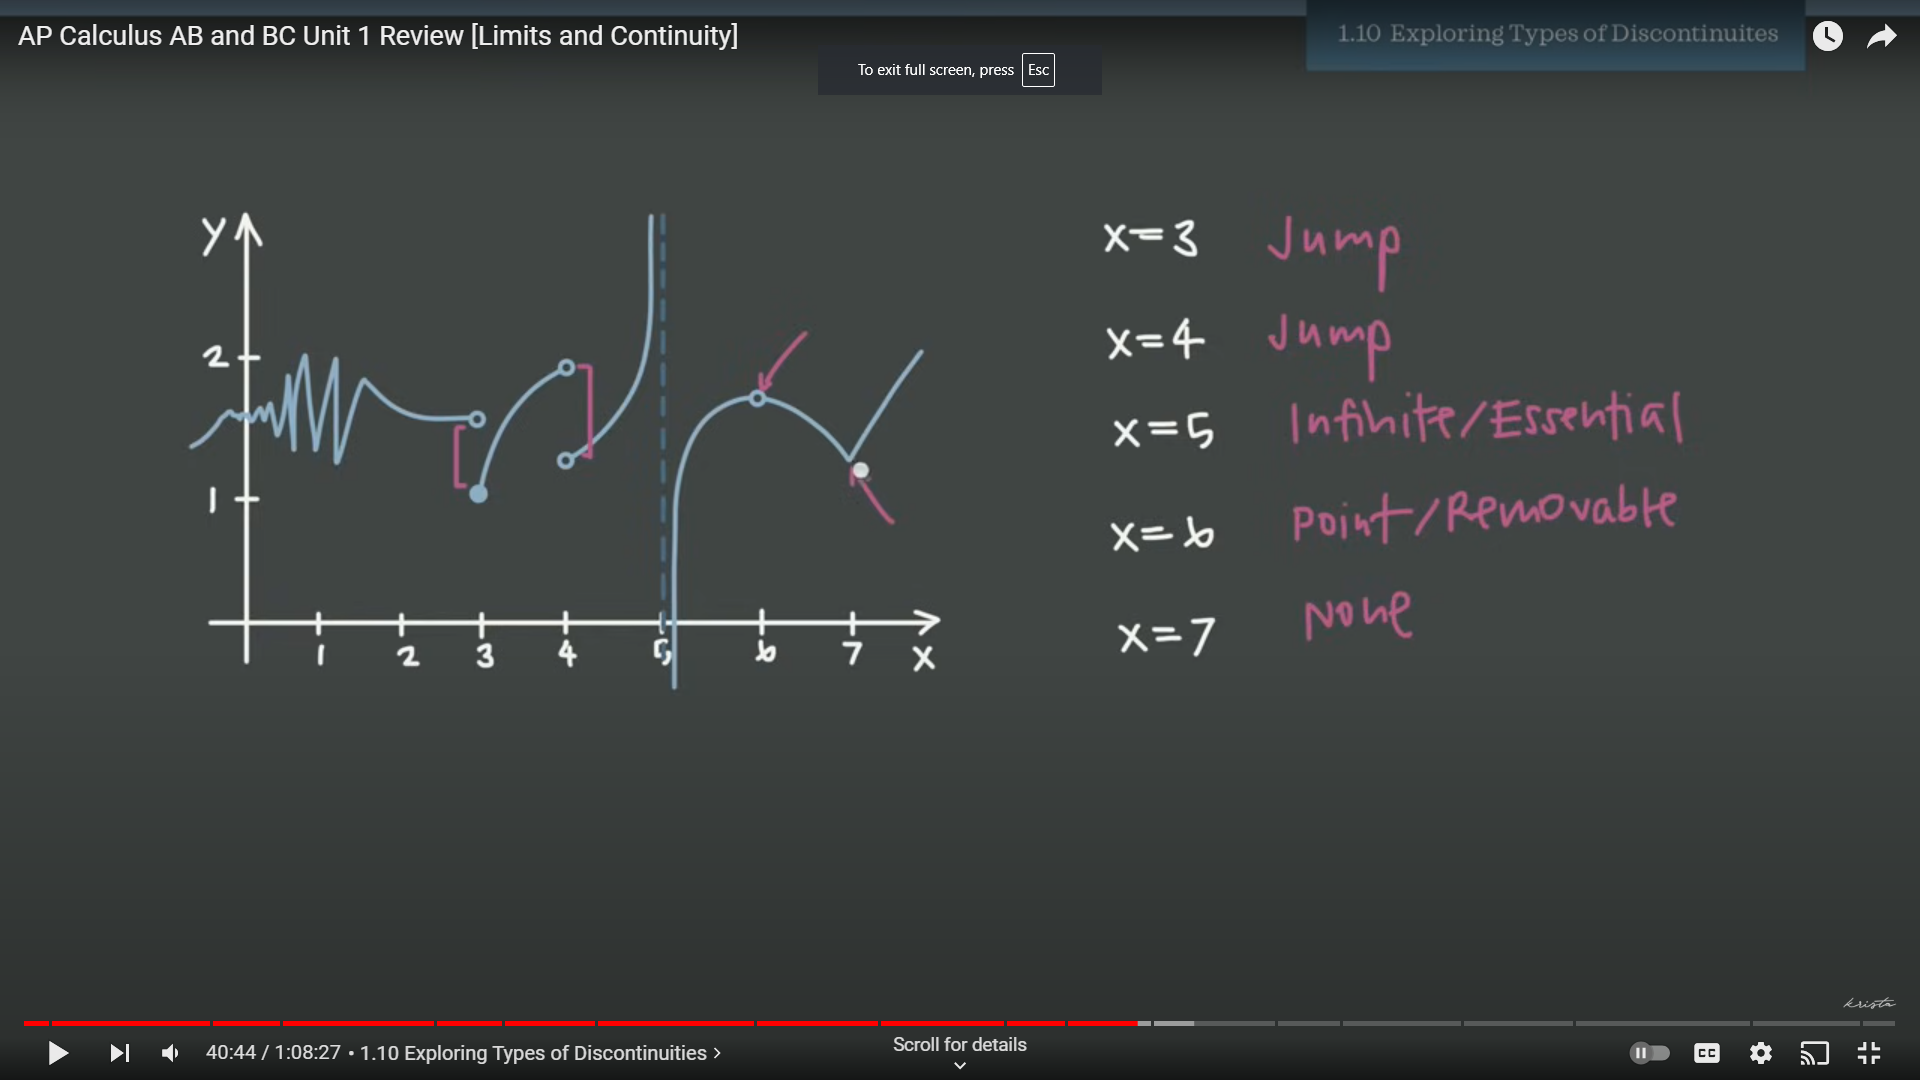
Further explanation: The jump discontinity’s happen when there is a gap between two points. The infinite/essential discontnity happens when both parts of the function are happening at the same time. The point/removable discontuity happenes when there is an undefined sole point. To find a discotinuity, find a hole or gap in the graph.
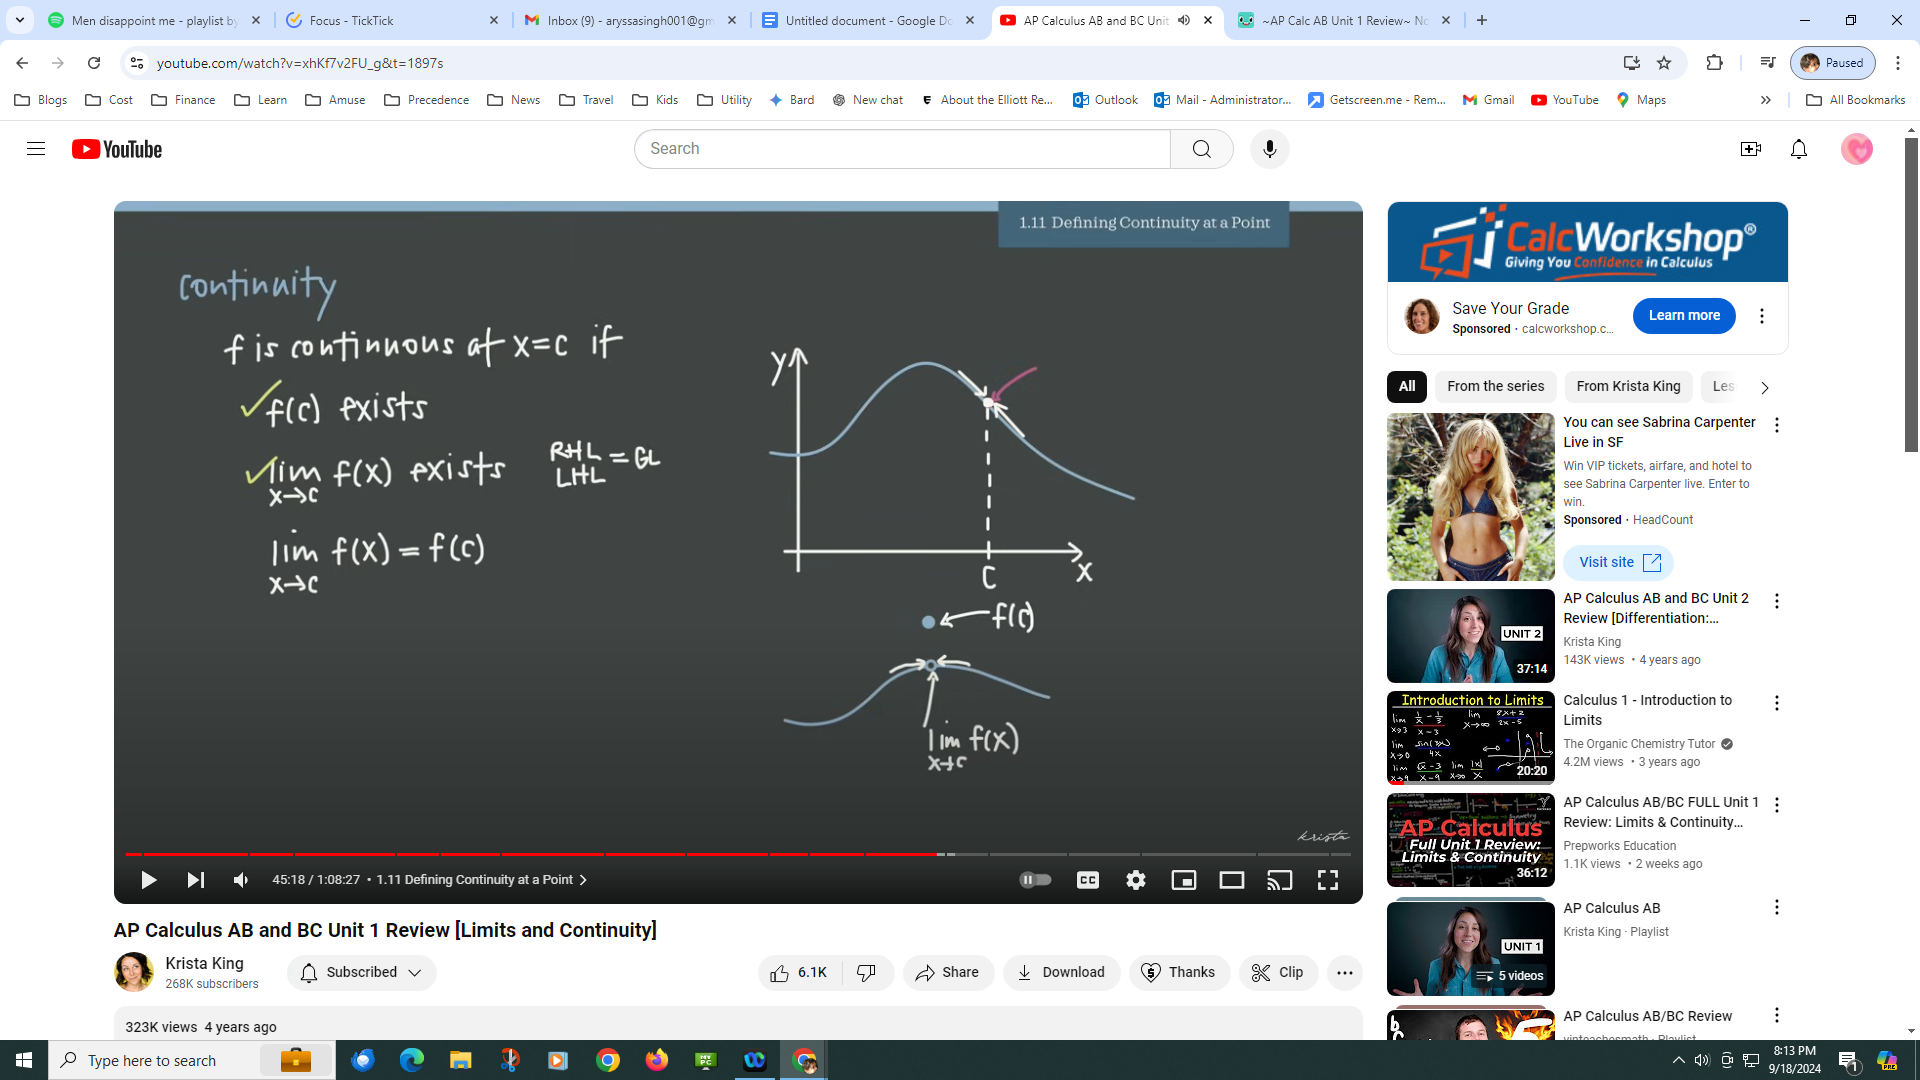
1.1: Deifning contnuity at a point
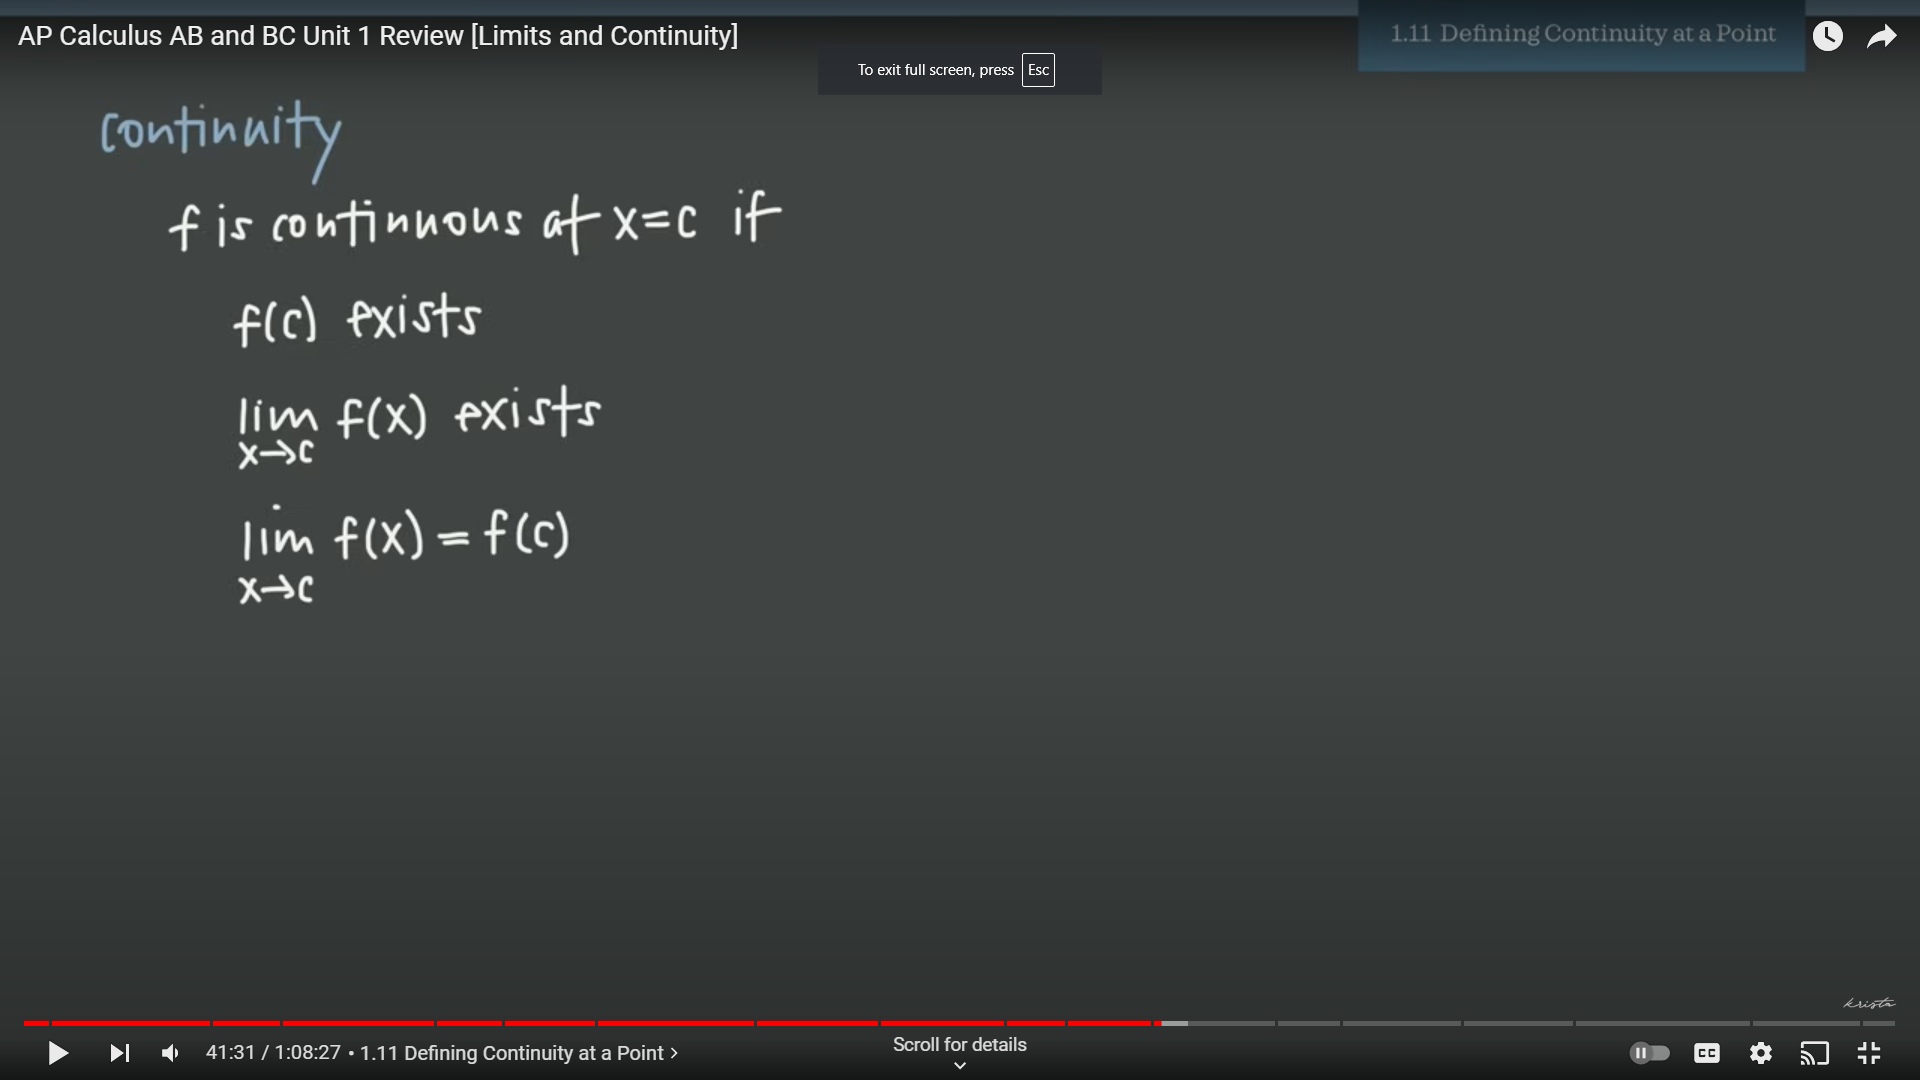
This is the definition of contuinity. In other words, the right hand limit has to exist, and those two have to be equal to one another. The genral limit also has to equal to the value of f(x) when plugged in. Below is a visual representation of this.
1.13:Removing discontinuities
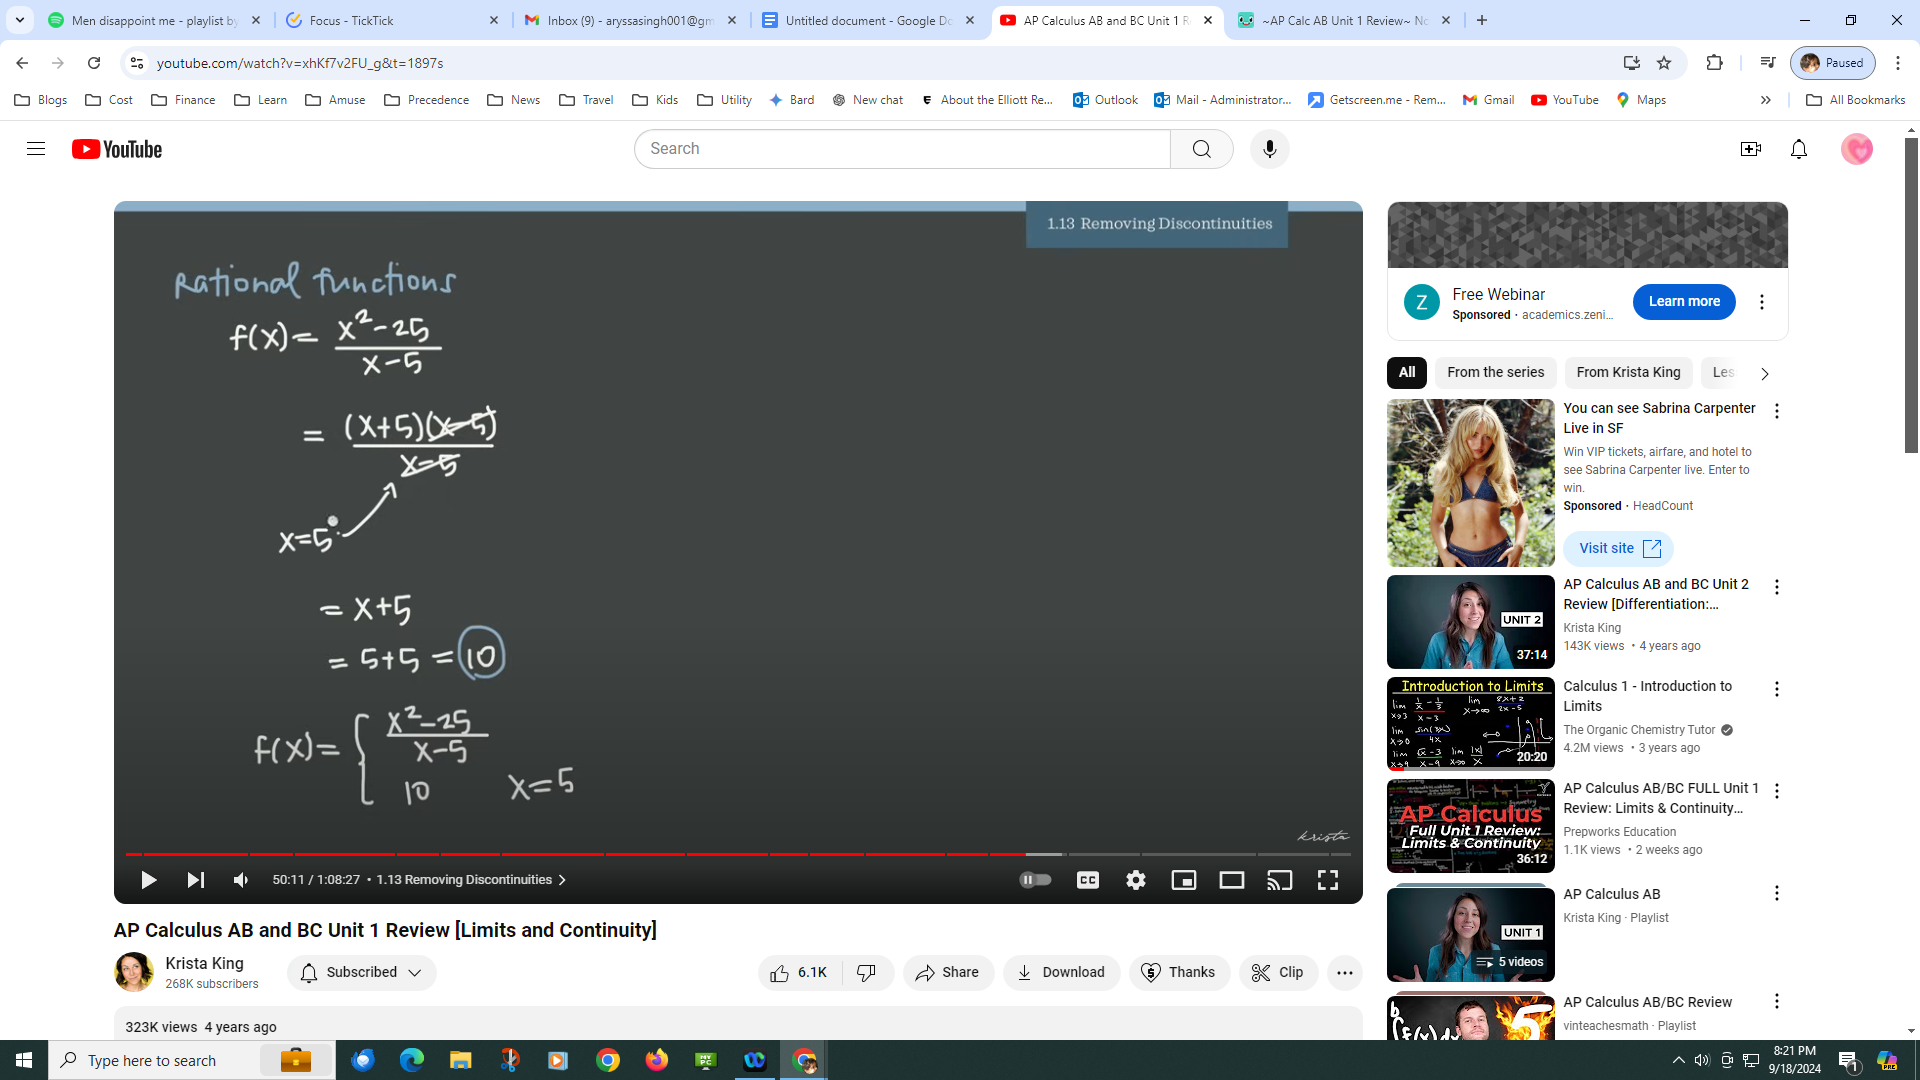
-if the denominator of a rational function is zero, there is a removable discontiuity aka hole. Factoring can be used to remove a removale discontinuity. Then you can define the function as a piecewise function. The work for that will be shown below.
1.15: Connecting Limits at Infinity and Horizontal asymtopes
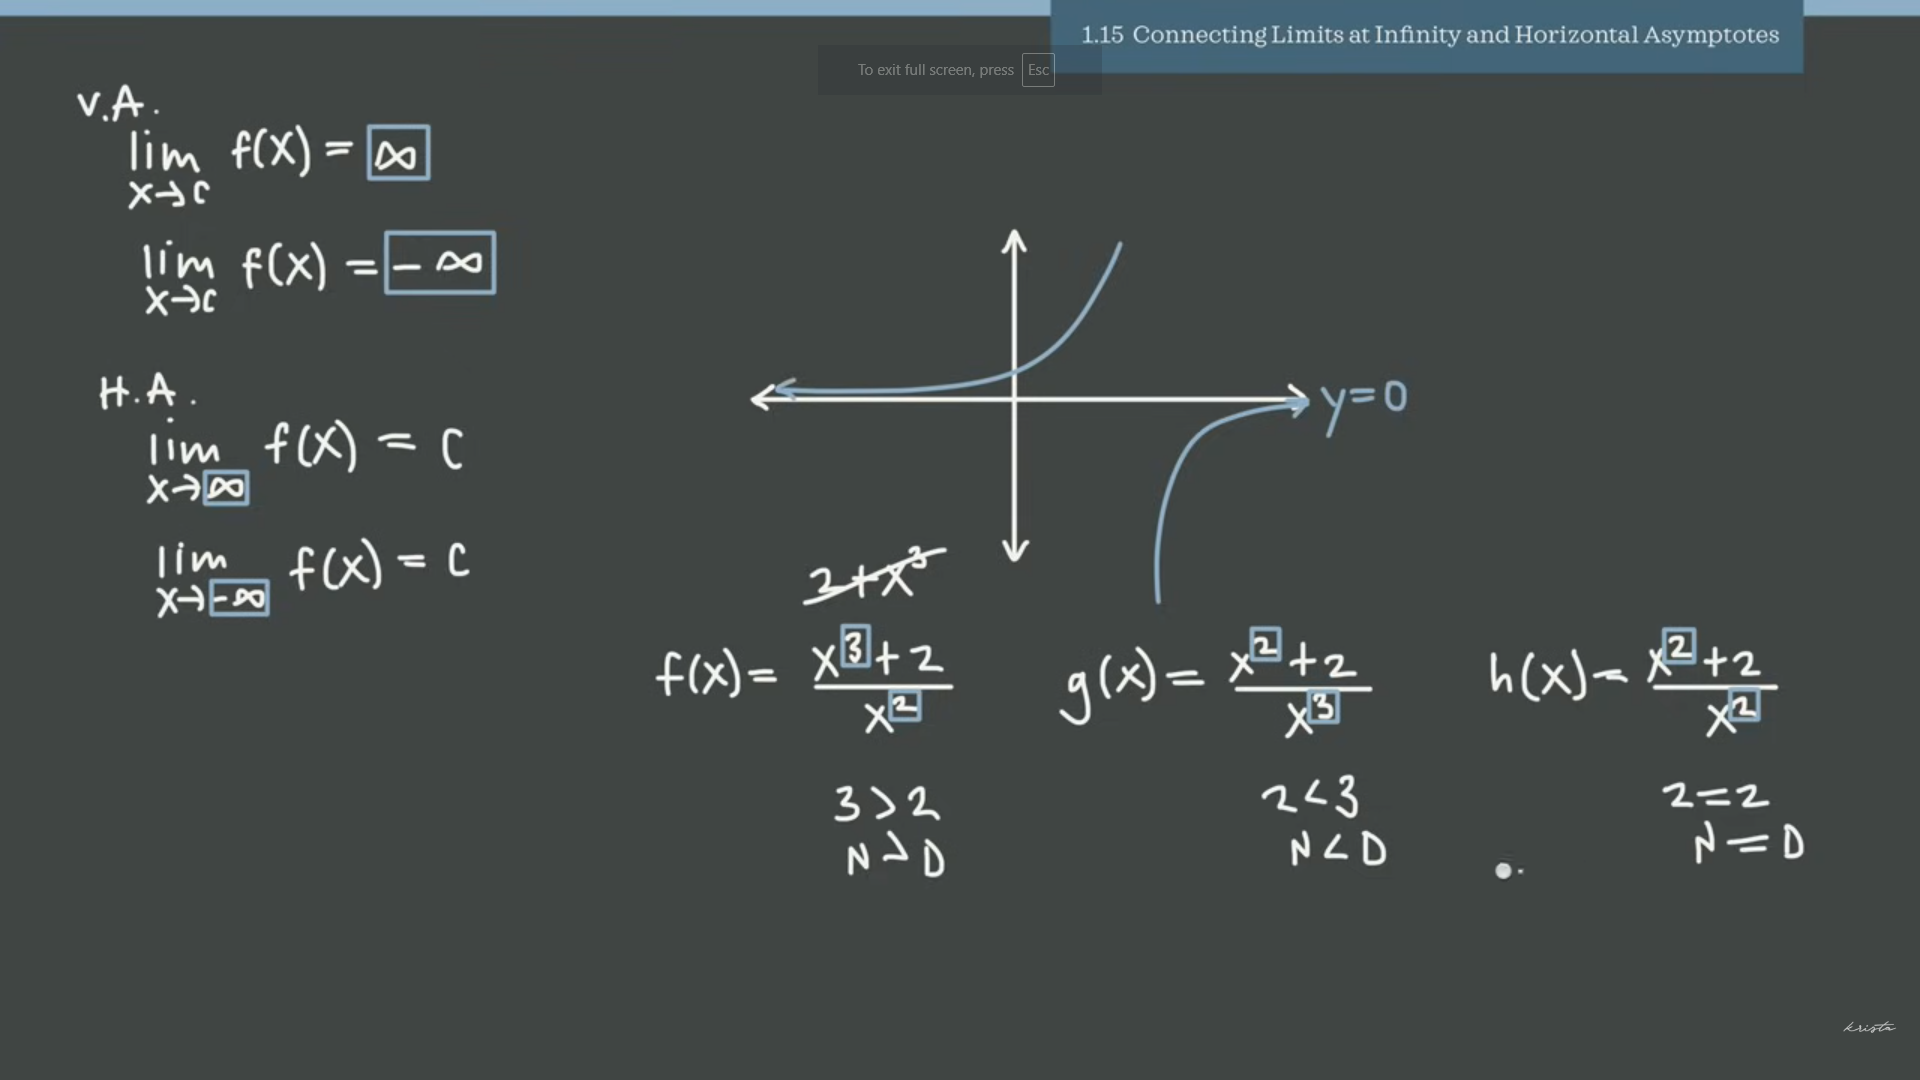
Numerator-N
Denominator-D
The leading term is the one with the highest degree.
-When the numerator is greater than the denominator, there is no horizontal asymtopes. So the end behaivor is that it doesn’t approach a specific value
-When the numerator is less than the demoinator, then the horizontal asymtope is y=0. It is always specifically the x-axis.
-When the numerator and demoinator are equal, you have to use the ratio of coffiencets. For example we know that 1 /1 =1 This works because 1x²=x².
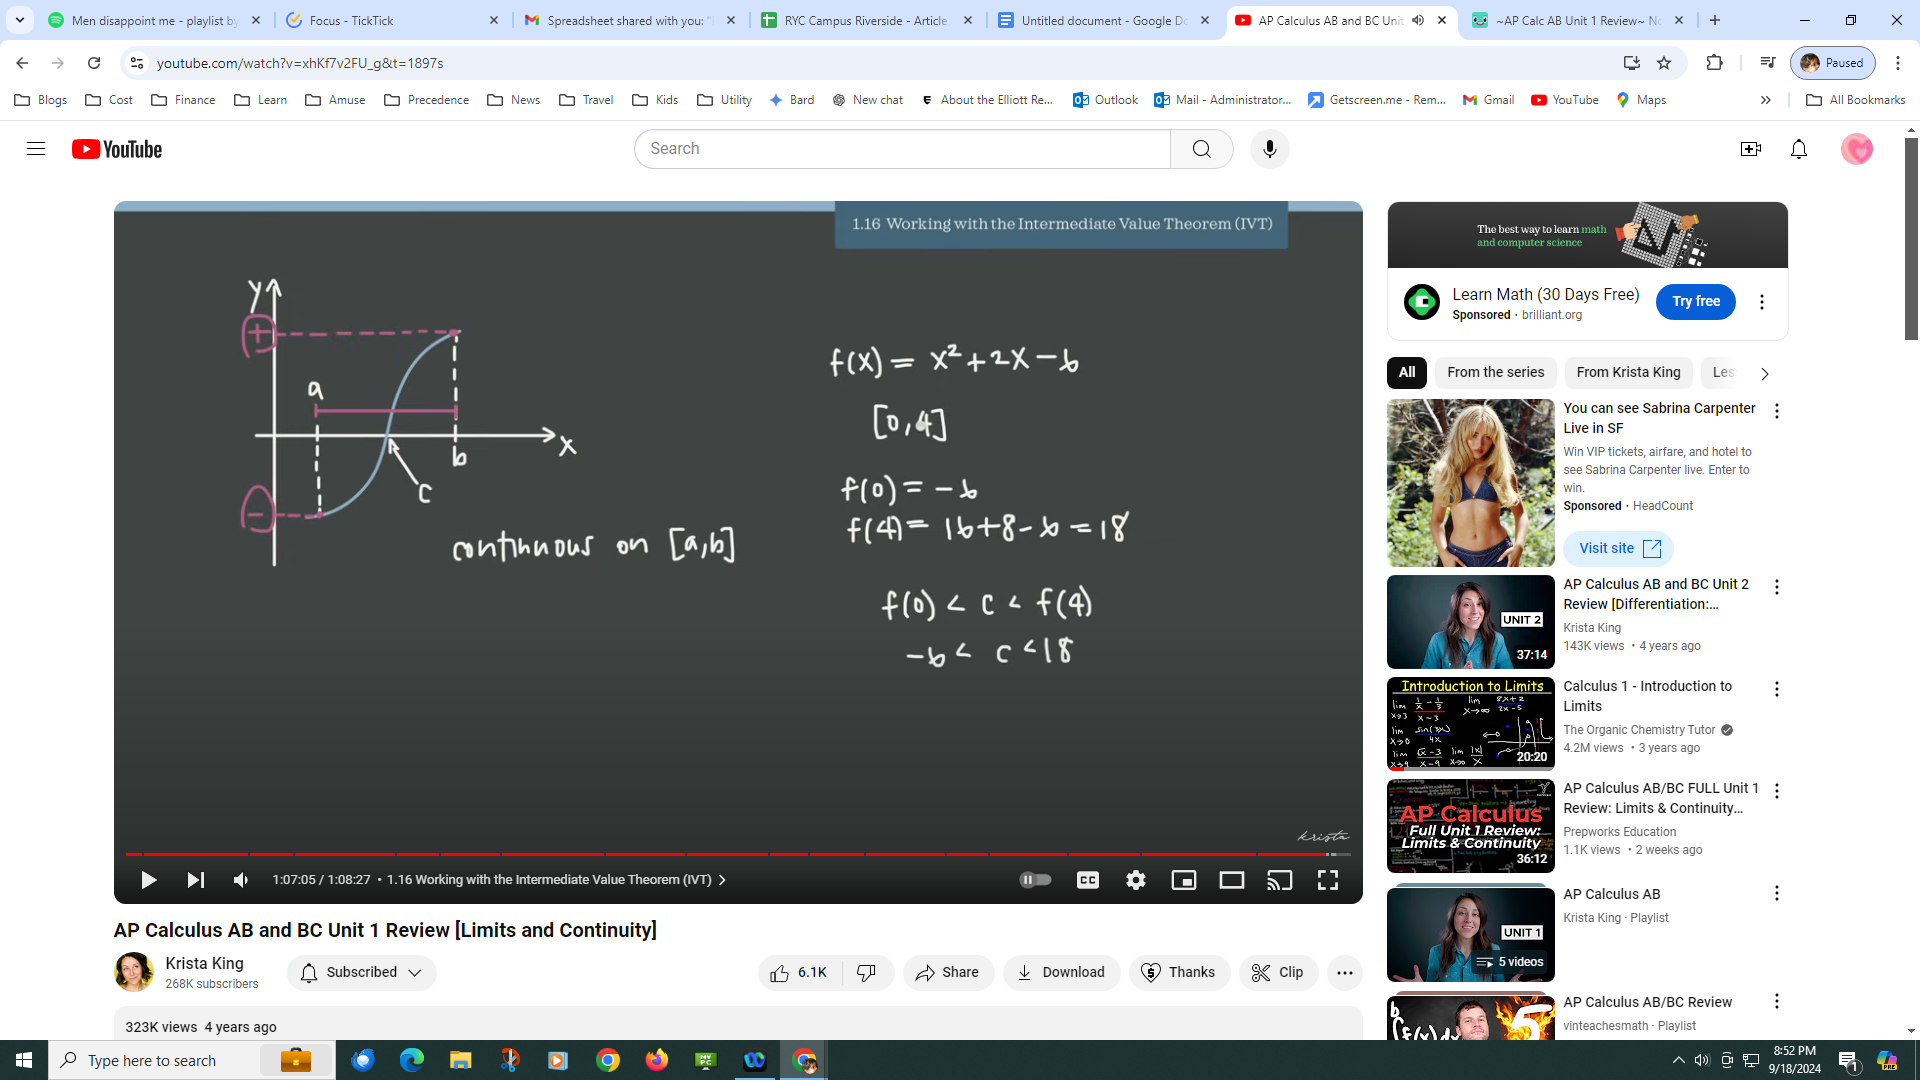
1/16: Intermediate Value Theorom
This theorem states that if one interval of a function is negative and the other is positive (an example is shown below), the function has to cross the x-axis somewhere in the middle of the two intervals, assuming that the function is continuous throughout the whole interval.
