Monopolistic Competition and Oligopoly
Monopolistic Competition
Main characteristics
Relatively large number of sellers with small market shares
No collusion (too many sellers)
Independent action (e.g., price cutting)
Differentiated products created through advertising, giving some pricing power
Easy entry to, and exit from, the industry
LO1
Industry concentration and measurement (LO1)
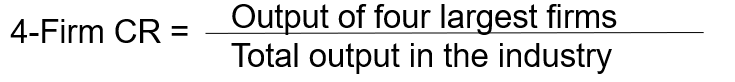
Four-firm concentration ratio (CR4):
Definition: Output of the four largest firms / Total output in the industry
Formula:
Herfindahl index (HI):Definition: Sum of the squares of the market shares of all firms
Formula: HI = (%S1)2 + (%S2)2 + (%S3)2 + …. + (%Sn)2
Note: If shares are in percent, use percent values; if in decimals, use decimal shares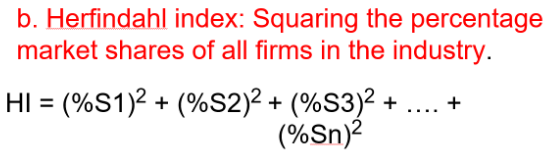
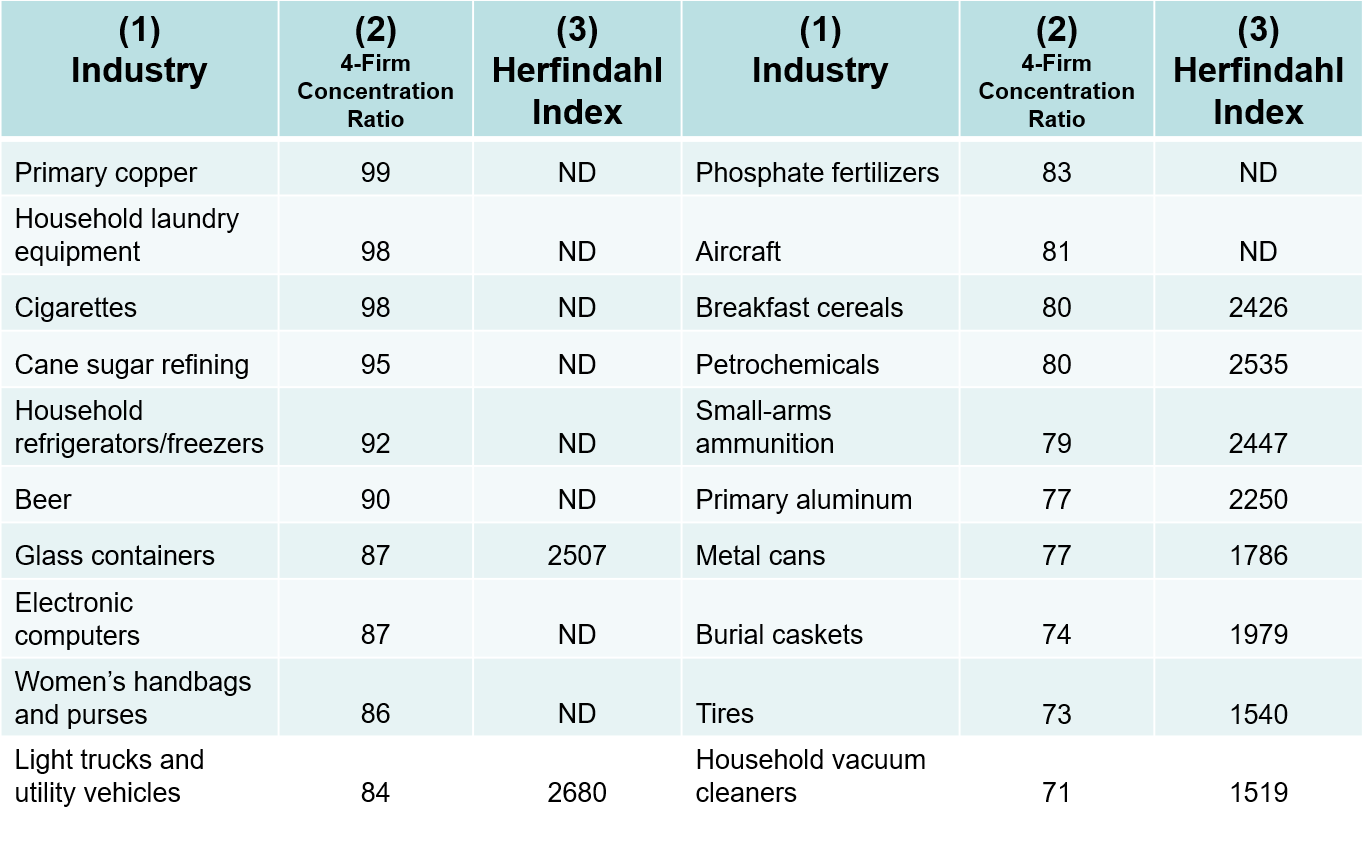
Examples of low-concentration industries (illustrative data from slide):
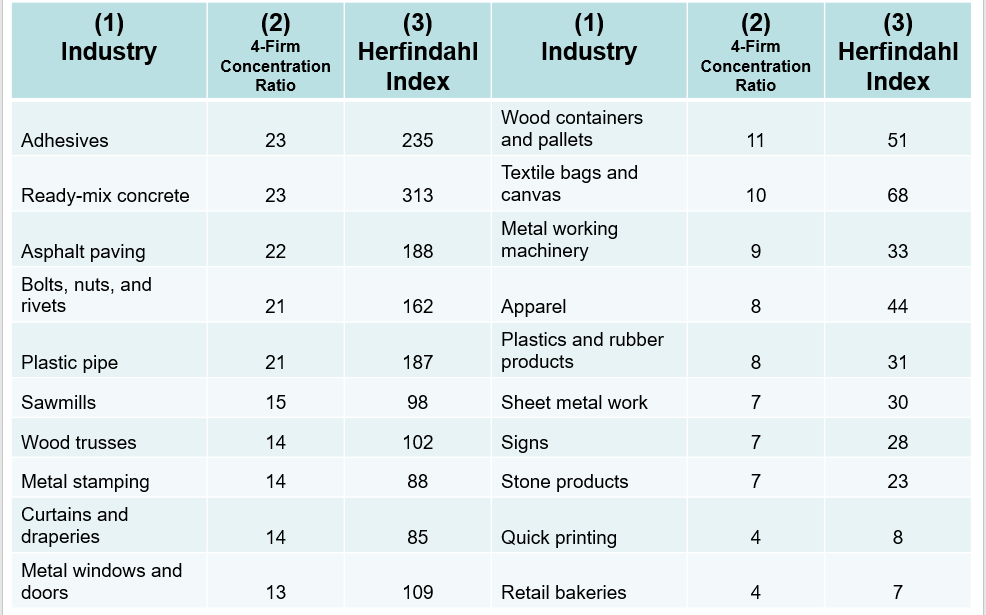
LO1: This table shows some examples of U.S. manufacturing industries that are considered monopolistically competitive. The lower the 4-firm concentration ratio, the less concentration and subsequently, the more competitive the industry. Generally speaking, the lower the Herfindahl index, the lower the industry concentration.
Price and output in monopolistic competition (short run vs long run)
Demand is highly elastic
Short-run: produce where MR = MC; can earn positive or negative economic profit
Long-run: normal profit (economic profit drives entry/exit until profits are zero)
In monopolistic competition, the demand curve is highly, but not perfectly, elastic. It is more elastic than a monopoly's due to close substitutes, yet less elastic than pure competition due to product differentiation, giving firms some price control. In the short run, firms maximize profits or minimize losses by producing where marginal cost (MC) equals marginal revenue (MR). In the long run, profits are driven to zero (normal profit) because of free entry and exit in the industry.
The short run: profit
Profit-maximizing condition: MR = MC
Price-quantity framework illustrated by D (demand), MR, MC, and ATC curves
In profit scenario: price > average total cost at profit-maximizing quantity (P > ATC)
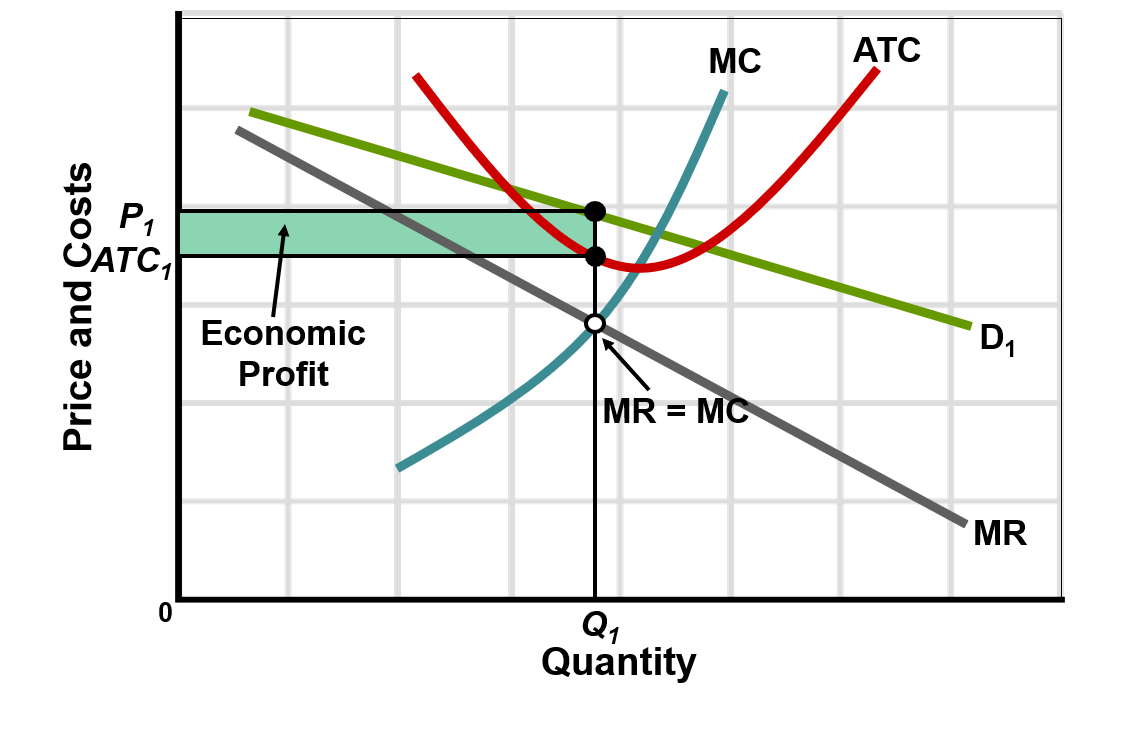
Firms produce the quantity where MR = MC just like in other industries. It is possible to make a profit in the short run. Economic profit = (P1 – ATC1) *Q1
At the profit maximizing output, price is higher than ATC and the firms enjoy an economic profit in the short run.
The short run: loss
If demand is not sufficient to cover costs, firms incur losses but will minimize losses where MR = MC
In the short run, ATC > P, but firms still produce where MR = MC to minimize losses
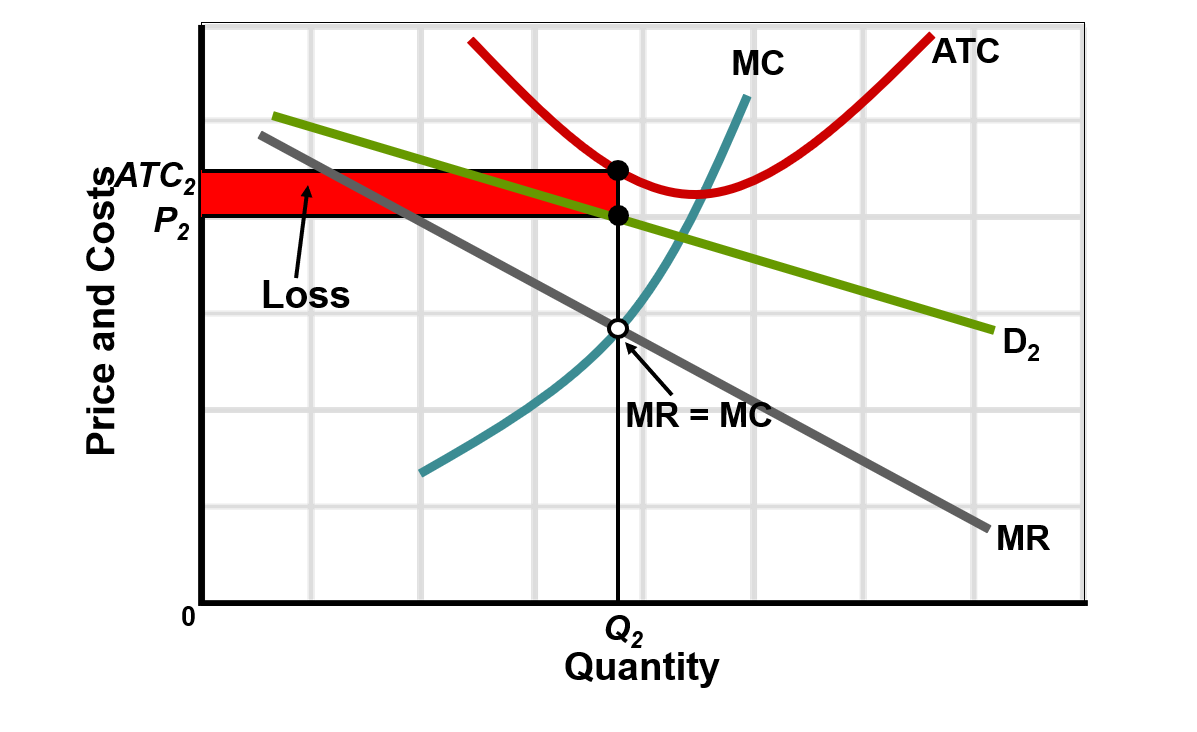
Firms will produce the quantity where MR = MC to maximize profits. It is possible to make a loss in the short run. Economic Loss = (P2 – ATC2) *Q2 . At the profit maximizing output, price is below ATC and therefore a loss is incurred.
The long run: normal profit
In the long run, firms earn just normal profit (zero economic profit)
Quantity and price adjust so that MR = MC and P = ATC
At this point, there is no incentive for entry or exit
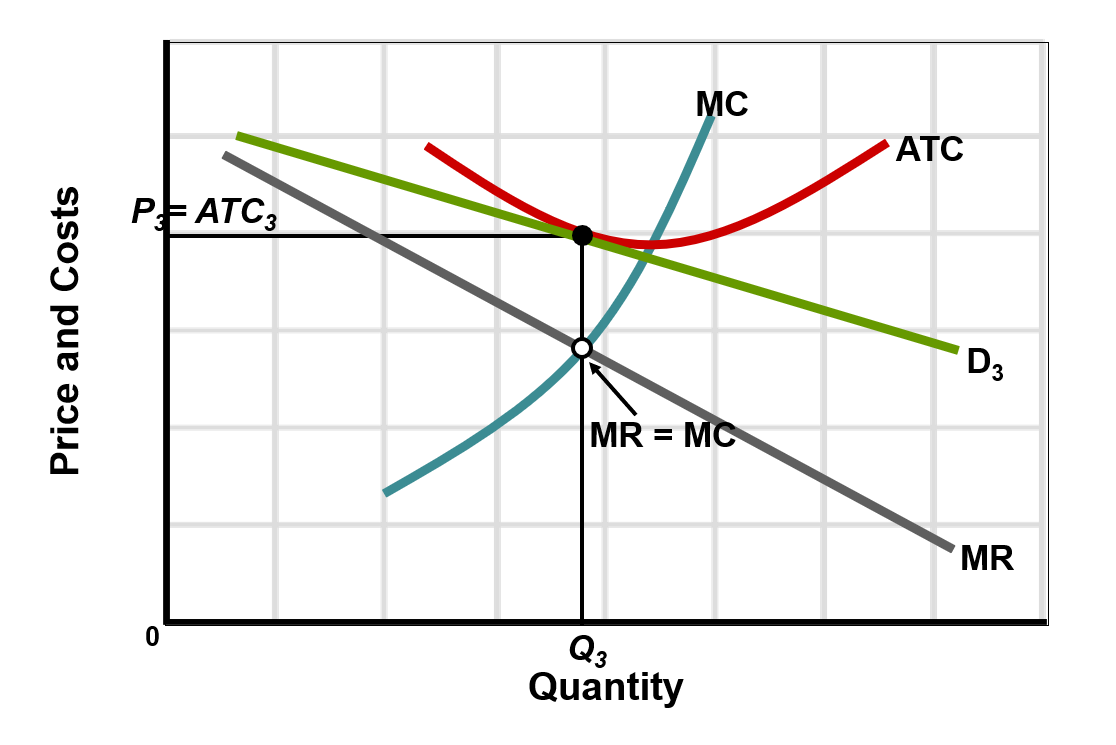
the long run firms still produce the quantity where MR = MC. In the long run firms will enter the industry if economic profits were enjoyed, shifting (the firm’s) demand left and profits fall. In the long run firms will exit the industry if there are economic losses, shifting demand to the right and losses shrink. This will continue until the price settles where it just equals ATC (or P3= ATC3 ) at the MR=MC output. At this price, the monopolistically competitive firm earns a normal profit.
In
Monopolistic competition (long-run) – efficiency considerations
Efficiency verdict: inefficient
Productive inefficiency: P > ATC
Allocative inefficiency: P > MC
Compared to perfect competition (P = MC = min ATC), monopolistic competition yields excess capacity (producing less than it can produce)
Excess capacity at minimum ATC implies not producing at the lowest possible average cost
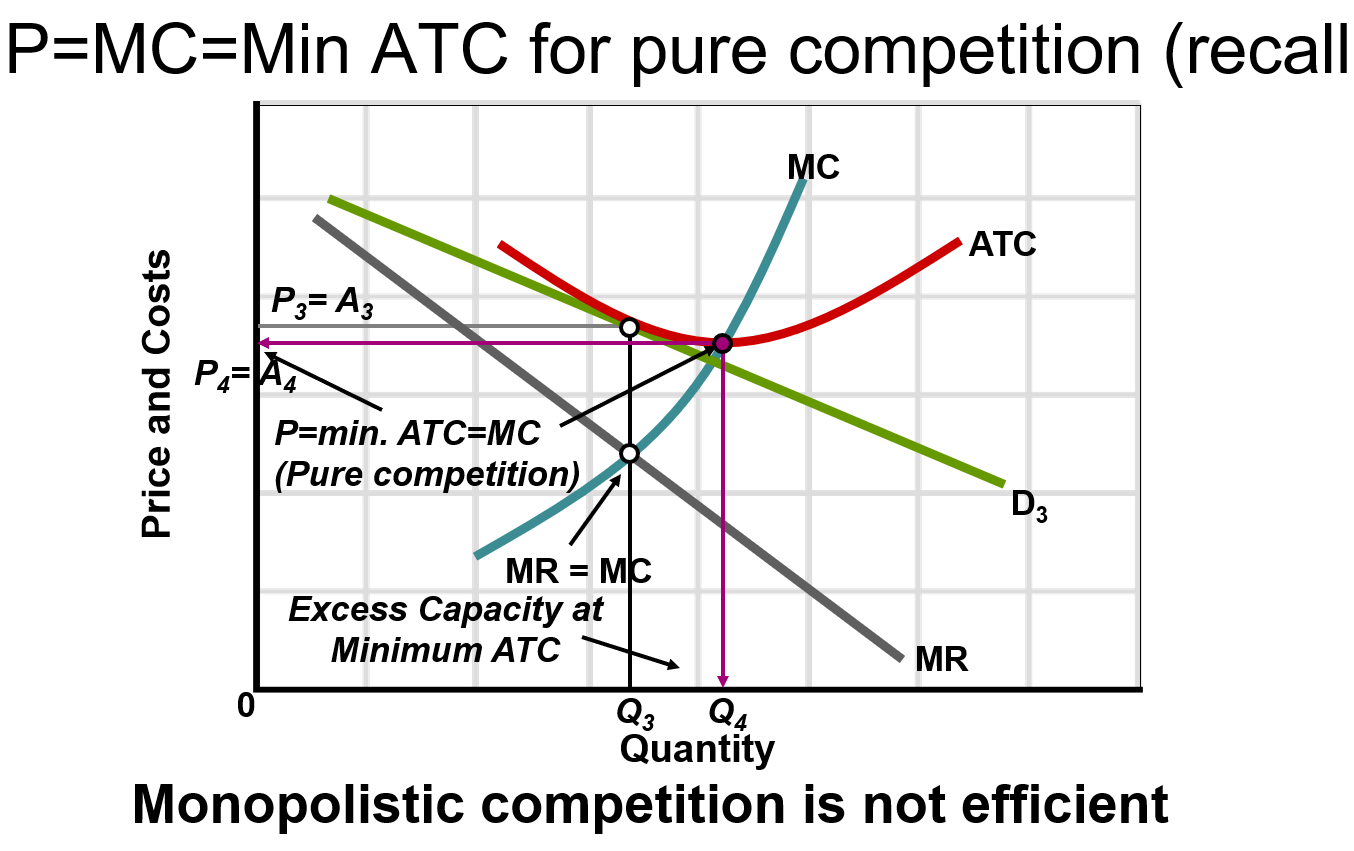
Monopolistic competition is inefficient in long-run equilibrium, failing to achieve both productive and allocative efficiency.
- Productive inefficiency occurs because production happens where the average total cost (A3) exceeds the minimum average total cost (A4), i.e., A3>A4.
- Allocative inefficiency arises because the product price (P3) is greater than the marginal cost (P3>MC).
- These inefficiencies result in an underallocation of resources, an efficiency loss, and excess production capacity (Q4−Q3 ) for every firm in the industry.Product variety and consumer benefits
Firms constantly manage price, product, and advertising
Leads to better product differentiation and more advertising
Consumers benefit from a wider array of choices, styles, brands, and perceived quality
Monopolistically competitive producers may be able to postpone the long-run outcome of just normal profits through product development, improvement, and advertising. Compared with pure competition, this suggests possible advantages for the consumer. Development, or improved products, can provide the consumer with a diversity of choices.Product differentiation is at the heart of the trade-off between consumer choice and productive efficiency. The greater number of choices the consumer has, the greater the excess capacity problem.
Oligopoly: characteristics
A few large producers control a significant share of the market
Products can be homogeneous or differentiated
Firms face interdependence and strategic behavior
Mutual interdependence and potential for price/production coordination
Entry barriers exist (economies of scale, branding, capital requirements, etc.)
Mergers may occur to gain dominance
The entry barriers in oligopoly are not as great as in monopoly, thus we have a few producers. There may be homogeneous or standardized oligopolies like the steel and oil markets. There may also be differentiated oligopolies like the markets for breakfast cereal, beverages, and automobiles. Control over price is limited because there is just a few sellers in the market and rivals may respond in a way that would be detrimental to the firm that just changed the price. Entry barriers are more substantial than in monopolistic competition which is why there are just a few producers in the market. Although some firms have become dominant as a result of internal growth, others have gained dominance through mergers.
Oligopolistic industries and concentration measures
Four-firm concentration ratio used to assess oligopoly potential
Limitations of CR4: local markets can be more monopolistic than national; cross-industry competition; ignores world price; hidden dominant firms
Notes on very high concentration industries (illustrative): primary copper, cigarettes, cereals, petroleum, etc. (CR4 often very high; HI ranges vary; many ND = not disclosed)
To be an oligopoly, the 4-firm concentration ratio must be at least 40%. Based on this rule of thumb, about 50% of U.S. manufacturing is oligopolistic. Localized markets may have just one producer which is a monopoly, while a low 4-firm concentration ratio indicates a lot of competition in the national industry. Inter-industry competition occurs when industries like glass and plastic compete with each other. This competition is not reflected in their high 4-firm concentration ratios. World Trade is not taken into account when calculating concentration ratios. Dominant Firms in the industry exhibit dominance that may be disguised and not reflected in the 4-firm concentration ratio.
Four oligopoly models
Game Theory
Collusive pricing (cartels)
Price leadership
Kinked demand curve (noncollusive pricing)
Rationale: diversity of oligopolies and interdependence complicates predictions of price/output/advertising
There are two reasons that we don’t have just a single model to explain this type of market. Oligopoly encompasses a great range and diversity of market structures. The decisions depend on the actions of the rivals, making it more difficult to explain the behaviors without several models. Each of these models are described on the following slides.
Game Theory overview
Players (firms) choose among alternative actions
Must consider how others will respond to their actions
Interdependence leads to strategic behavior
Equilibrium concepts (e.g., Nash equilibrium) guide outcomes in strategic settings
Game Theory details
Small group of sellers: tension between cooperation and self-interest
Cooperative outcome (monopolist-like) yields higher profits, but there are strong incentives not to cooperate
Each firm cares only about its own profit; incentives to cheat hinder cooperation
Cooperation (cartels) can be unstable due to incentives to cheat
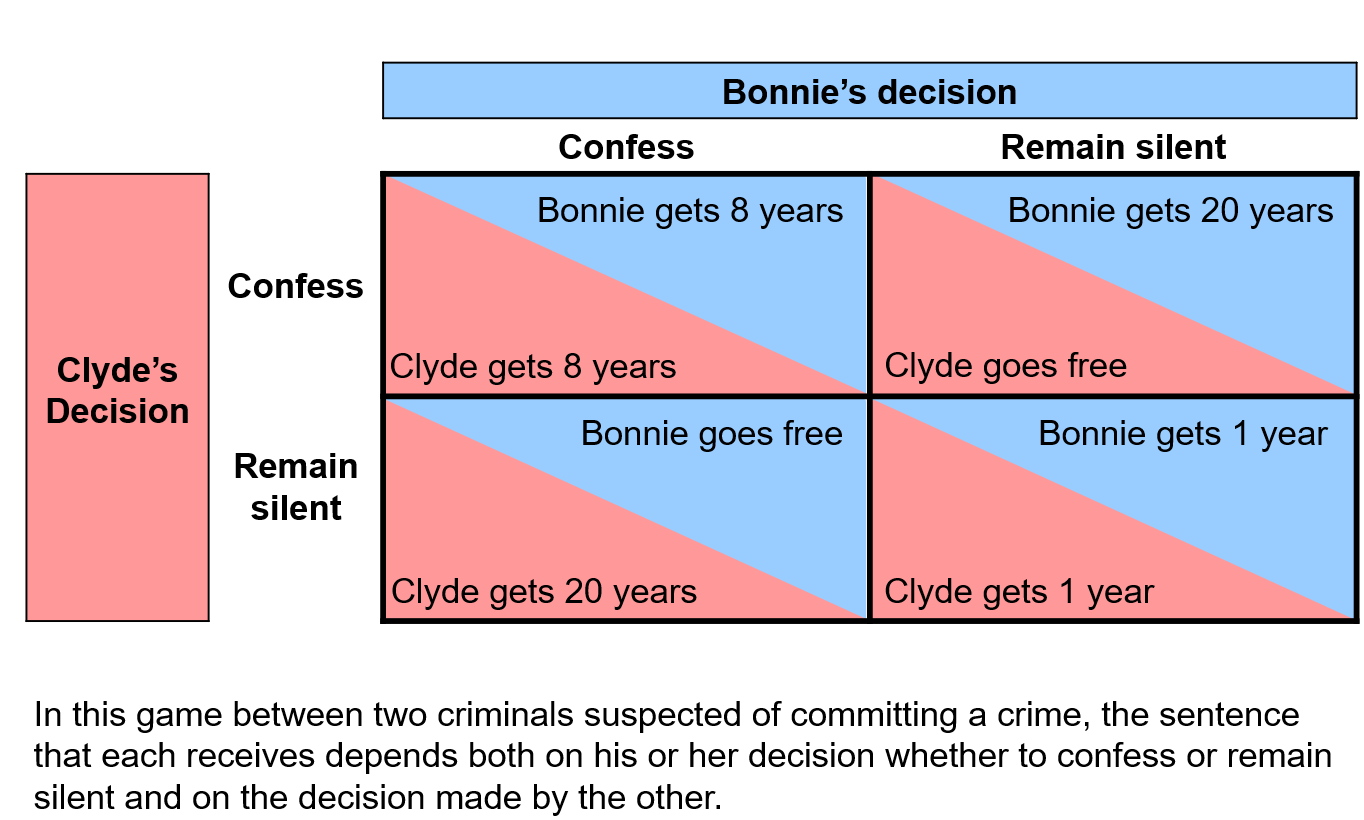
The Prisoners’ Dilemma – cooperation vs. self-interest
Classic example of why cooperation is difficult even when mutually beneficial
Dominant strategy: choose the action that is best regardless of the other player’s action
Typical setup: two prisoners decide to confess or remain silent; outcomes depend on both choices
Canonical interpretation: mutual cooperation would yield a better joint outcome, but each player has a dominant, self-interested choice leading to a worse outcome for both
Example payoffs (illustrative):
If both stay silent: each receives a light sentence (e.g., 1 year)
If one confesses and the other stays silent: the confessor goes free (0 years) while the silent one gets a heavy sentence (e.g., 10 years)
If both confess: both receive moderate sentences (e.g., 5 years)
Conclusion: without enforceable agreements, the equilibrium outcome is suboptimal from a joint perspective
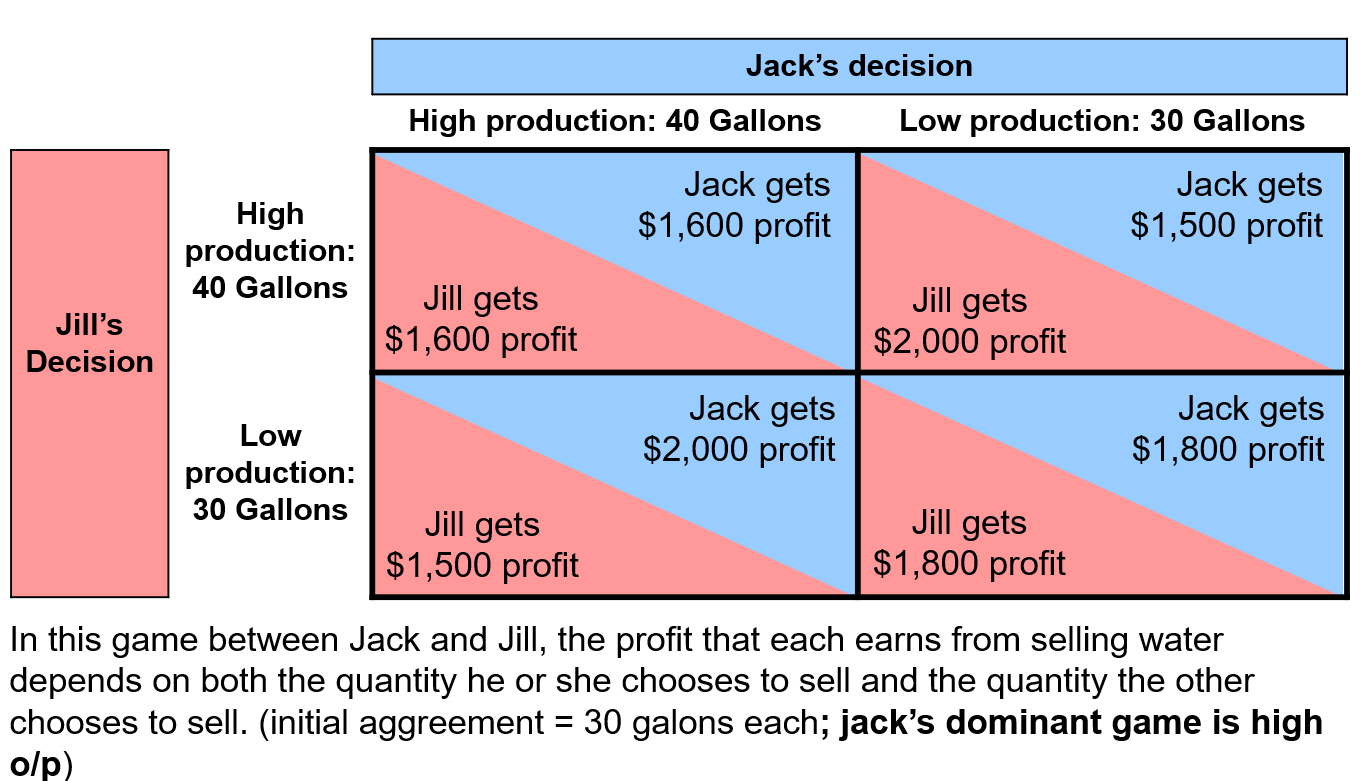
Oligopoly games: cooperation vs. noncooperation
Firms play a game trying to reach monopoly-like profits
Self-interest drives noncooperation; easy to cheat on any tacit or explicit agreement
Cartel stability is fragile due to incentives to cheat
Collusion: Cartels
Definition: a group of firms or nations that collude to set prices and outputs
Formal collusion: agree on price and output allocations among members
Legality: collusion is illegal in the United States
Example: OPEC as a real-world cartel
Obstacles include: cost and demand differences, number of firms, cheating, recession (cheating incentives), new entrants, legal prohibitions
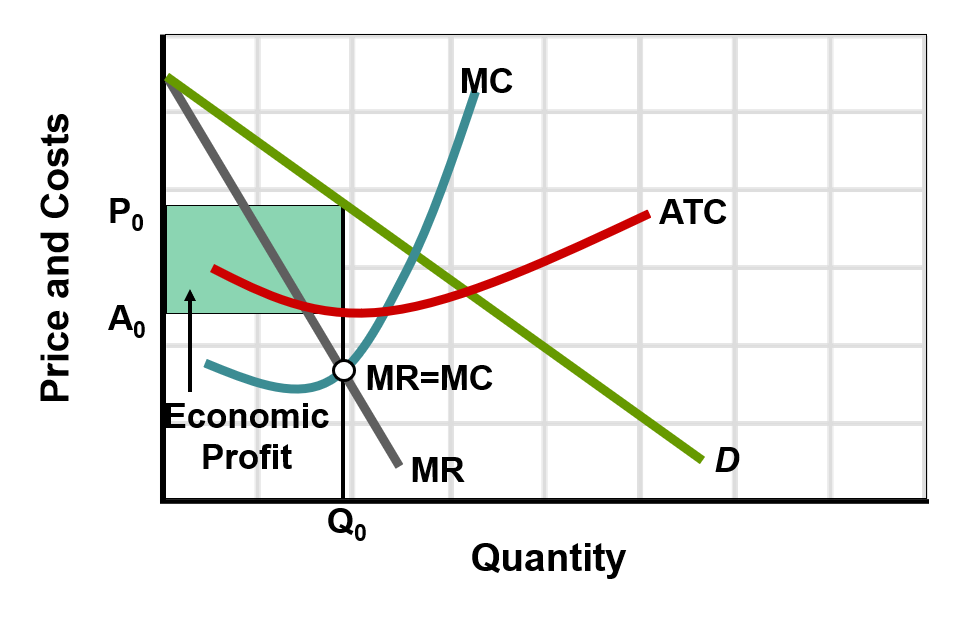
Oligopolies tend to collude and this model shows how collusive oligopolists behave. Oligopolies are conducive to collusion and the tendency toward joint profit maximization. If oligopolistic firms face identical or highly similar demand and cost conditions, they may collude to limit their joint output and to set a single, common price. Thus, each firm acts as if it were a pure monopolist, setting output at Q0 and charging price P0. This price and output combination maximizes each oligopolist’s profit (green area) and thus, the combined or joint profit of the colluding firms. Collusion is most likely to occur when the good that is being produced is homogeneous.
Global perspective: OPEC
Key producers and approximate oil production levels (illustrative):
Saudi Arabia: 8,433,000 barrels
Iran: 3,658,000 barrels
Iraq: 2,706,000 barrels
UAE: 2,375,000 barrels
Kuwait: 2,354,000 barrels
Venezuela: 2,256,000 barrels
Nigeria: 2,172,000 barrels
Angola: 1,618,000 barrels
Libya: 1,574,000 barrels
Algeria: 1,276,000 barrels
Qatar: 813,000 barrels
Ecuador: 481,000 barrels
Price leadership model
Dominant firm initiates price changes
Other firms follow the leader
The leader can use limit pricing to deter entry
Potential outcome: price wars or stable pricing depending on reactions
Kinked-demand theory
Noncollusive oligopoly model
Assumes uncertainty about rivals’ reactions to price changes
Two possible rival reactions: match price cuts or ignore price cuts; generally ignore price increases but match decreases
Result: price rigidity with asymmetric responses
Diagrammatic intuition: a kinked demand curve with a discontinuous MR curve; price changes are infrequent
Criticisms: real-world prices are not perfectly rigid; price wars can occur
The kinked demand model is used for noncollusive oligopolies to explain their behaviors and pricing strategies. Since the firms do not collude, none of the firms know with certainty what their rivals are going to do. However, the firms assume that their rivals will match any price reductions in an effort to maintain their customers. On the other hand, it is reasonable to assume that if a firm raises its price, its rivals will ignore the price change in an effort to steal customers from the firm raising its price.
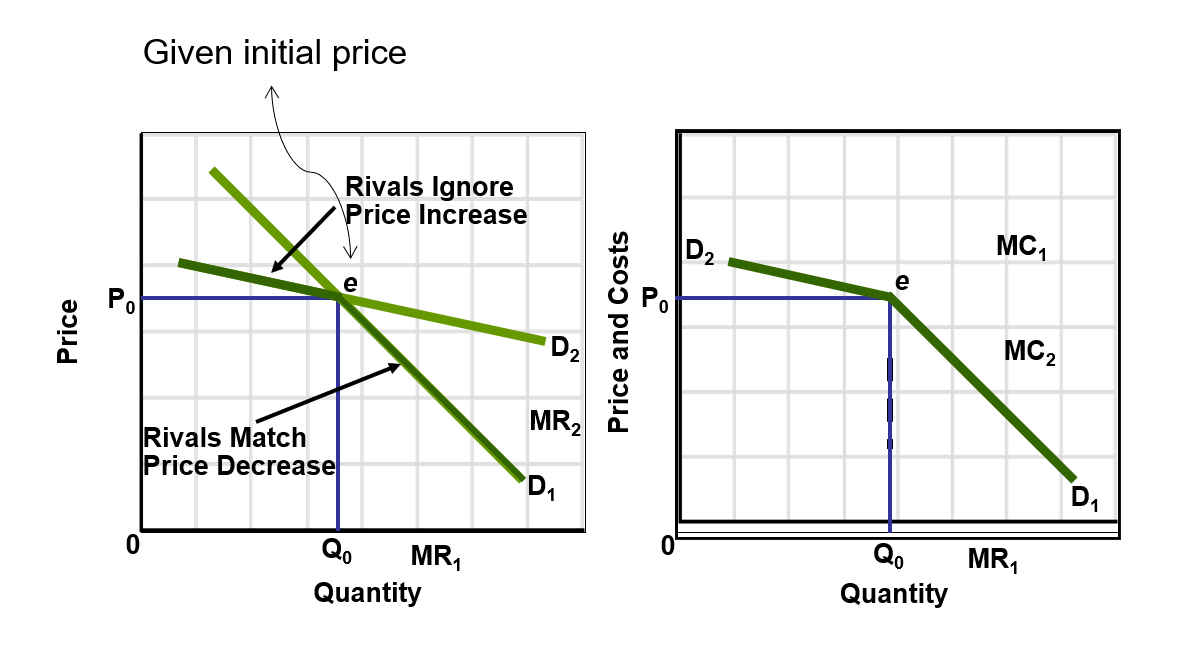
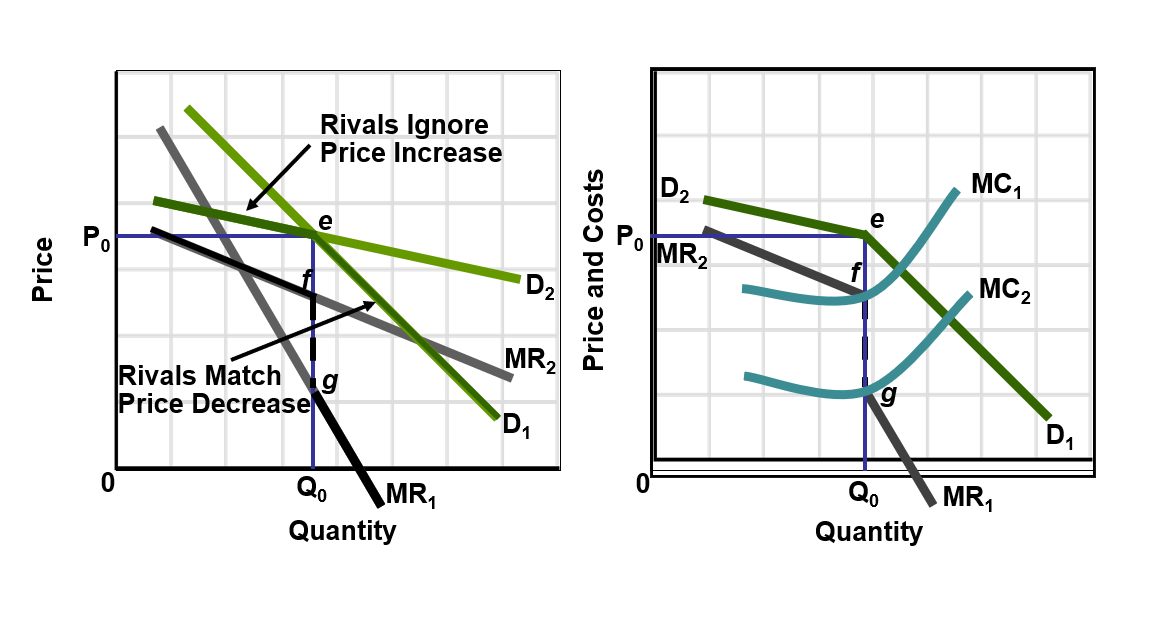
This graph shows the kinked-demand curve. (a) The slope of a noncollusive oligopolist’s demand and marginal-revenue curves depends on whether its rivals match (straight lines D1 and MR1) or ignore (straight lines D2 and MR2) any price changes that it may initiate from the current price P0.
(b) In all likelihood an oligopolist’s rivals will ignore a price increase but follow a price cut. This causes the oligopolist’s demand curve to be kinked (D2eD1) and the marginal-revenue curve to have a vertical break, or gap (fg). Because any shift in marginal costs between MC1 and MC2 will cut the vertical (dashed) segment of the marginal-revenue curve, no change in either price, P0, or output, Q0, will result from such a shift. This implies price is rigid.
Oligopoly and advertisingAdvertising is central to product development and competition
Advertising is less easily duplicated than a price change
Firms with large advertising budgets can gain market share
Advertising is prevalent in oligopolies since there are differentiated goods and advertising is the best way to communicate product differences. Product improvements and advertising can be successful because they are less easily duplicated than a price change. Oligopolists are financially able to advertise due to economic profits earned in the past.
Positive effects of advertising
Provides information to consumers at low cost
Enhances competition and speeds up technological progress
Can expand market size and enable economies of scale
Advertising is a low-cost way of providing information to consumers about different options and it reduces the consumer’s search time for products. Advertising also enhances competition between firms and thus aids in economic efficiency. It speeds up technological progress by introducing new products. It can help firms obtain economies of scale by reducing long run average costs.
Large-scale advertising – examples
Top U.S. advertisers (2010): Procter & Gamble, General Motors, AT&T, Verizon, News Corp, Pfizer, Time Warner, Johnson & Johnson, Ford, L’Oréal
Illustrative advertising spending (in millions of dollars)
Negative effects of advertising
Can be manipulative or misleading
Can lead to higher prices for consumers if uncompetitive practices persist
Consumers may forego lower-priced, unadvertised alternatives
Global brand perspective
World’s top brands (illustrative): Coca-Cola, IBM, Microsoft, Google, General Electric, McDonald’s, Intel, Nokia, Disney, Hewlett-Packard
Oligopoly and efficiency
Oligopolies tend to be inefficient overall
Productively inefficient: P > min ATC
Allocatively inefficient: P > MC
Qualifications: foreign competition, limit pricing strategies, technological progress can offset some inefficiencies
Productive Efficiency is achieved by producing in the least costly way and is evidenced by P = min ATC. Allocative Efficiency is achieved by producing the right amount of output and is evidenced by P = MC. Foreign competition has increased rivalry in oligopolistic industries. If the oligopolist leader practices limit pricing, we may get lower prices. Oligopolies may foster more rapid product development because of the competition in the industry and with the firm’s profits they have a means to invest in new technologies.