Short-Run Production Costs
Fixed, Variable, and Marginal Cost
Fixed Cost: costs that do not change with the level of output produced
Variable Cost: costs that vary with the level of output produced
Marginal Cost: the cost of producing one additional unit of output
MC, AVC, ATC
Marginal cost : cost difference of one additional unit of output (∆TC/∆Q)
Average fixed cost (AFC) : FC/Q
Average variable cost (AVC) : VC/Q
Average total cost (ATC) : TC/Q or AFC + AVC
Total Cost = TFC + ATC
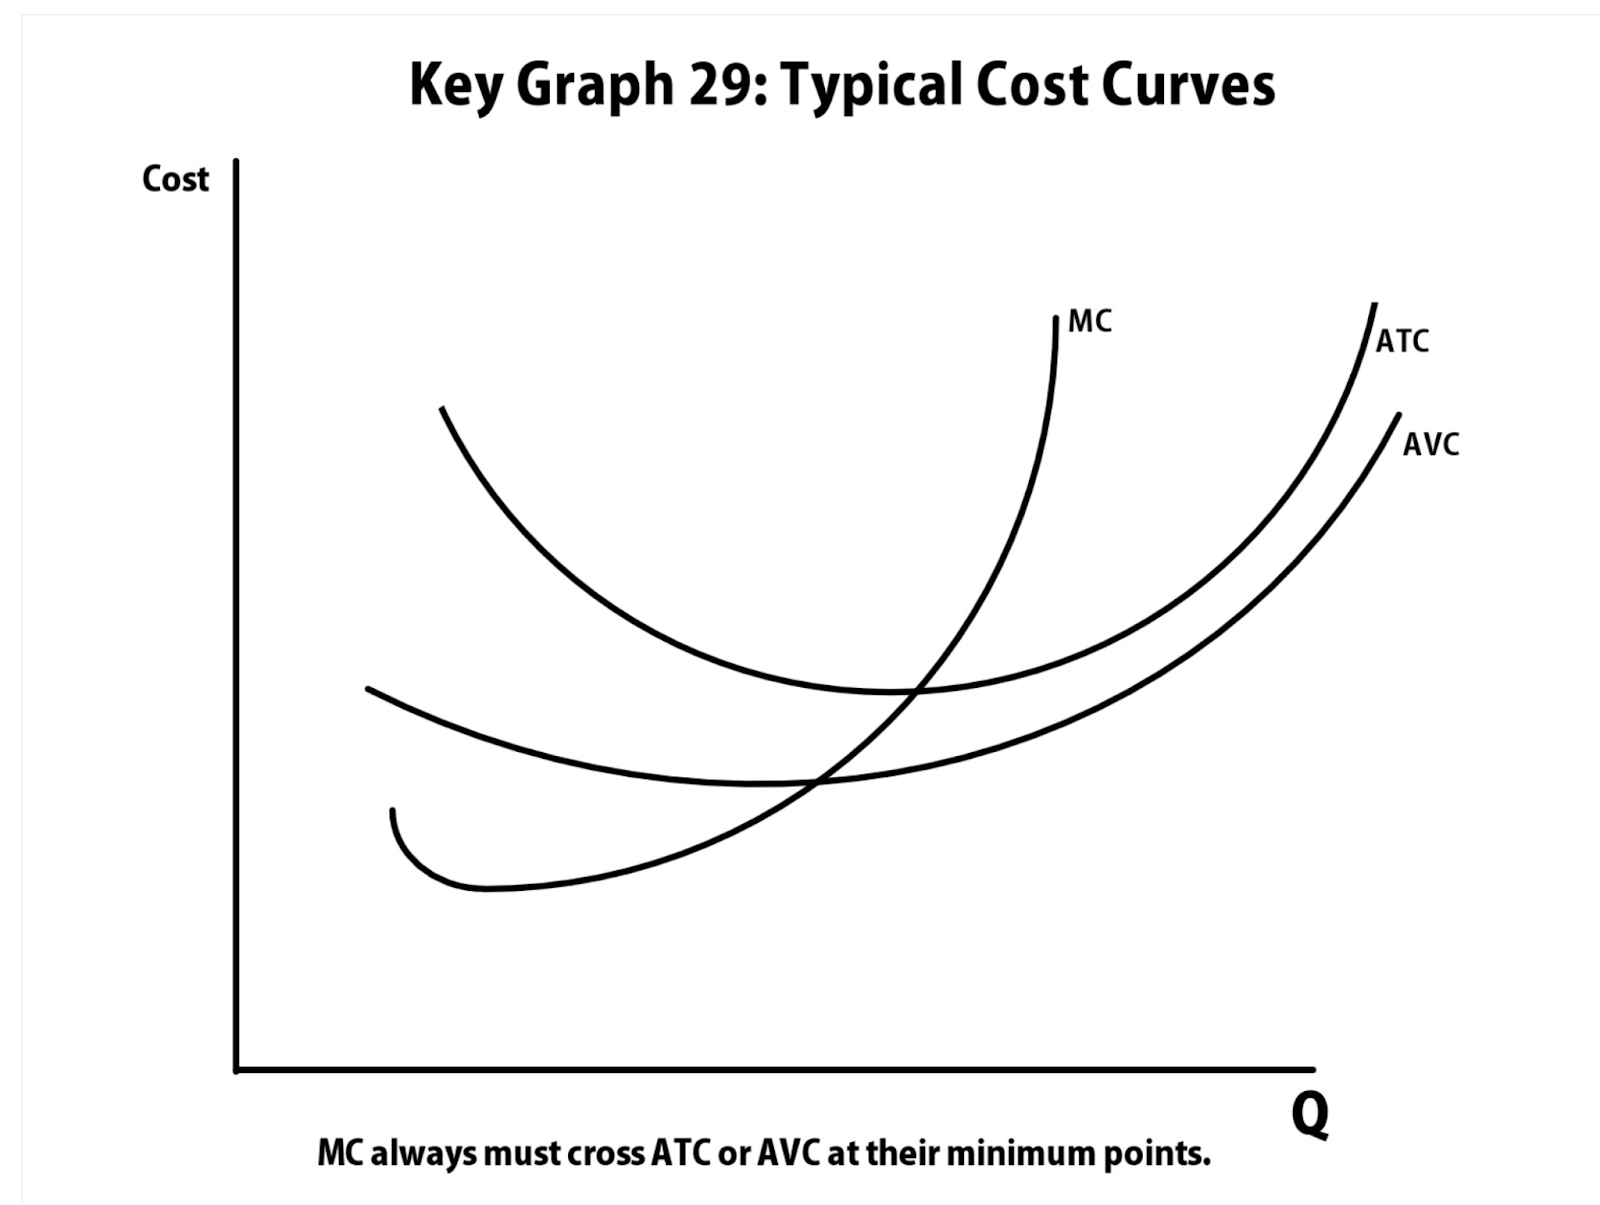
Graph
The MC curve intersects both the AVC and ATC curves at their respective lowest points
This intersection signifies the output level where average costs are minimized
Marginal Revenue and Marginal Cost
Marginal Revenue: the additional revenue a firm earns by selling one more unit of a good or service; (change in TR/change in Q)
Marginal Cost: the additional cost incurred by producing one more unit of a good or service (change in TC/change in Q)
MC typically decreases initially due to increasing returns, then increases due to diminishing returns.
Profit Maximization Rule is when MR = MC
TR is at maximum when MR goes negative
MR Below ATC
When MR < ATC, the firm is not covering its total costs and is operating at a loss
Even if a firm is incurring losses (MR < ATC), it may continue operating in the short run if it can cover its average variable costs (AVC).
continuing operations allows the firm to contribute to fixed costs, potentially reducing overall losses compared to shutting down immediately
if losses persist in the long run, the firm may exit the market, as it's unsustainable to operate without covering total costs over time
How Costs Change when Fixed and Variable Costs Change
1. Changes in Fixed Costs:
Fixed costs (e.g., rent, salaries) remain constant regardless of output
Increasing fixed costs raises the AFC and ATC
However, MC and AVC remain unaffected because fixed costs don't change with production levels
2. Changes in Variable Costs:
Variable costs (e.g., raw materials, hourly wages) fluctuate with output
An increase in variable costs raises AVC, MC, and ATC
These changes directly impact the cost of producing each additional unit
3. Graphical Representation:
An increase in fixed costs shifts the ATC curve upward, while MC and AVC curves remain unchanged
An increase in variable costs shifts the AVC, MC, and ATC curves upward
4. Changes in Productivity:
Improved productivity (e.g., better technology) allows more output with the same input
This causes the AVC, MC, and ATC curves to shift downward, indicating lower costs per unit
Conversely, reduced productivity shifts these curves upward