ap macro chapter 1
1.1 Scarcity
scarcity - having unlimited wants but limited resources
textbook definition of economics - social science concerned with the efficient use of scarce resources to achieve maximum satisfaction of economic wants
the science of scarcity, the study of choices (individuals, firms, governments)
study of how individuals and societies deal with scarcity
microeconomics - study of small economic units such as individuals, firms, and markets
examples - supply and demand in specific industries, production costs, labor markets
macroeconomics - study of the large economy as a whole or economic aggregates
examples - economic growth, government spending, inflation, unemployment, international trade
positive statements - based on facts; avoids value judgments (what is)
normative statements - includes value judgments (what ought to be)
theoretical economics - when economists use the scientific method to make generalizations and abstractions to develop theories
policy economics - applying economic theories to fix problems or meet economic goals
5 key economic assumptions
society’s wants are unlimited, but ALL resources are limited
scarcity
due to scarcity, choices must be made. every choice has a cost
every choice has a trade-off
everyone’s goal is to make choices that maximize their satisfaction. everyone acts in their own “self-interest”
everyone’s goal is to maximize satisfaction. we act in our own self-interest
everyone acts rationally by comparing the marginal costs and marginal benefits of every choice
everyone makes decisions by comparing marginal costs and marginal benefits
real-life situations can be explained and analyzed through simplified models and graphs
marginal analysis - making decisions based on increments
you will continue to do something as long as the marginal benefit is greater than the marginal cost
marginal benefit - the maximum amount of money a consumer is willing to pay for an additional good or service
marginal cost - the change in cost when an additional unit of a good or service is produced
trade-offs - all the alternatives that we give up when we make a choice
opportunity costs - the most desirable alternative given up when you make a choice
utility - satisfaction
marginal - additional
allocate - distribute
price - the amount the buyer (or consumer) pays
cost - the amount the seller pays to produce a good
consumer goods - created for direct consumption
capital goods - created for indirect consumption
allows the potential for more resources to be made
four factors of production
land - all natural resources that are used to produce goods and services
labor - any effort a person devotes to a task for which that person is paid
capital
entrepreneurship - ambitious leaders that combine other factors of production to create goods and services
physical capital - any human-made resource that is used to create other goods and services
examples - tools, tractors, machinery, factories, etc.
human capital - any skills or knowledge gained by a worker through education and experience
productivity - a measure of efficiency that shows the number of outputs per unit of input
increasing productivity allows the production of more items with fewer resources
1.2 OC and PPC
production possibilities curve (PPC, frontier) - a model that shows alternative ways that an economy can use its scarce resources
demonstrates scarcity, trade-offs, opportunity costs, and efficiency
4 key assumptions of the PPC
only two goods can be produced
full employment of resources
land
labor
capital
fixed resources (ceteris paribus)
fixed technology
point on the PPC curve - represents a specific combination that can be produced given full employment of resources
point inside of the PPC curve - inefficient because not all labor resources are being used (unemployment)
point outside of the PPC curve - not attainable because of scarcity, not enough materials at the moment
opportunity cost - the benefit missed out when choosing an alternative; the next best thing
constant opportunity cost - when resources are easily adaptable for producing either good
results in a straight-line PPC, not common
law of increasing opportunity costs - as you produce more of any good, the opportunity cost (forgone production of another good) will increase
happens because resources are NOT easily adaptable to producing both goods
results in a bowed-out PPC
3 shifters of the PPC
change in resource quantity or quality
change in technology
change in trade (allows more consumption)
change in demand does NOT shift the PPC
decrease in resources - decrease production possibilities for both
quality of resources improves - shifting the curve outward (change in technology)
unemployment is just a point inside the curve - no shift
quality of labor is improved - curve shifts outward
human capital is impacted significantly, making capital more productive
1.3 Comparative Advantage
trading - everyone specializes in the production of goods and services and trades with others (we don’t produce anything ourselves); more access to trade means more choices and a higher standard of living (no trade = limited materials)
per unit opportunity cost = opportunity cost/units gained
when calculating opportunity cost we give up what we get (down)
absolute advantage - the producer that can produce the most output or requires the least amount of inputs (resources)
comparative advantage - the producer with the lowest opportunity cost
goods that a country should specialize in - the good that is “cheaper” for them to produce (the one with comparative advantage)
trade can occur if they have a relatively lower opportunity cost
output questions - the amount of inputs, like time, workers, or other resources, are the same for both countries. only the output of each country is different
the same amount of workers - the US produces 10 planes, China produces 3 planes
output questions hack
output
other goes
over
input questions - the amount of output, like cars, planes, or corn, are the same for both countries. only the inputs for each country are different
the US takes 20 workers for 1 plane, China takes 40 workers for 1 plane
input questions hack (variable is resources, like time)
input
other goes
under
terms of trade - agreed upon conditions that benefit both countries
both benefit from trade if they each have relatively lower opportunity costs
5 comparative advantage hacks
Cars | Planes | |
|---|---|---|
US | 5 | 1 |
China | 3 | 2 |
spotting output vs input questions
output - want higher numbers
input - want lower numbers
o.o.o and i.o.u
output other goes over - 1/5
input other goes under - 5/1
it’s 50/50
one country can only have one comparative advantage
finding the terms of trade
one country wants another country’s item. if produced in the country, it’s expensive so trading benefits both
1 plane for 4 cars 1 car for ¼ plane basically 1p for any number between 5 and 3/2 c
quick and dirty
multiply across to see which two have the comparative advantage
3 × 1 = 3 comparative advantage for input
5 × 2 = 10 comparative advantage for output
input would be smaller number, output higher
1.4 Demand
demand - different quantities of goods that consumers are willing and able to buy
law of demand - there is an inverse relationship between price and quantity demanded
price goes up, quantity goes down, etc.
why does the law of demand occur?
substitution effect - if the price goes up for a product, consumers buy less of that product and more of another substitute product (and vice versa)
pepsi vs coke - if pepsi goes up, people buy more coke
income effect - if the price goes down for a product, the purchasing power increases for consumers — allowing them to purchase more
law of diminishing marginal utility - states that as you consume anything, the additional satisfaction that you receive will eventually start to decrease
the more you buy of any good, the less satisfaction you get from each new unit consumed
we buy goods because we get utility from them
demand curves
graphical representation of a demand schedule
downward sloping, showing the inverse relationship between price (y-axis) and quantity demanded (x-axis)
the x-axis is always quantity and the y-axis is always price; if switched then the graph is wrong
when reading a demand curve, assume all outside factors, such as income, are held constant (ceteris paribus)
shifts in demand
when the ceteris paribus assumption is dropped
movement no longer occurs along the demand curve. the entire demand curve shifts
shift means that at the same prices, more people are willing and able to purchase that good
change in demand, not quantity demanded - PRICE DOESN’T SHIFT THE CURVE
difference between a change in demand and a change in quantity demanded
change in demand - the whole curve shifts (inward/outward, all points shift)
change in quantity - only one point shifts, moving along the existing curve
change in price - moves along the curve
causes of shift in demand
market size (number of consumers)
expectations
related prices
substitutes
complements
income
normal goods
inferior goods
tastes and preferences
prices of related goods - the demand curve for one good can be affected by a change in the price of ANOTHER related good
substitutes - goods used in place of one another
if the price of one good increases, the demand for the other will increase (or vice versa)
complements - two goods that are bought and used together
if the price of one increases, the demand for the other will fall (or vice versa)
falls are different
income - the incomes of consumers change the demand, but how depends on the type of good
normal goods (proportional)
as income increases, demand increases
as income falls, demand falls
ex. luxury cars, seafood, jewelry, homes
inferior goods (inverse)
demand is higher when income is low
as income increases, demand falls
as income falls, demand increases
ex. Top Ramen, used cars, used clothes
different behavior than normal goods
impacts on the demand curve
changes in market size (number of consumers)
if… | demand of A… | |
|---|---|---|
the number of consumers rises | ↑ | |
the number of consumers falls | ↓ |
changes in expectations
if… | demand of A… | |
|---|---|---|
the price of A is expected to rise in the future | ↑ | |
the price of A is expected to fall in the future | ↓ | |
if A is a normal good | and income is expected to rise in the future and income is expected to fall in the future | ↑ ↓ |
if A is an inferior good | and income is expected to rise in the future and income is expected to fall in the future | ↓ ↑ |
changes in the prices of related goods or services
if… | demand of A… | |
|---|---|---|
if A and B are substitutes | and the price of B rises and the price of B falls | ↑ ↓ |
if A and B are complements | and the price of B rises and the price of B falls | ↑ ↓ |
changes in income
if… | demand of A… | |
|---|---|---|
if A is a normal good | and income rises and income falls | ↑ ↓ |
if A is an inferior good | and income rises and income falls | ↓ ↑ |
changes in tastes
if… | demand of A… | |
|---|---|---|
tastes change in favor of A | ↑ | |
tastes change against A | ↓ |
1.5 Supply
supply - the different quantities of a good or service that sellers are willing and able to sell (produce) at different prices
law of supply - there is a DIRECT (or positive) relationship between price and quantity supplied
price increases, quantity (made by producers) increases
price falls, quantity (made by producers) falls
at higher prices, profit-seeking firms have an incentive to produce more
difference between change in supply and change in the quantity supplied
change in supply - shift the whole curve (inward/outward, all points shift)
change in quantity - movement along the curve (one point shifts)
causes of shift in supply
technology
inputs - prices/availability of resources
land
labor
capital
number of sellers
government action: taxes and subsidies
subsidy - government payment to a business or market. subsidies cause the supply of a good to increase
expectations of future profit
impacts on the supply curve
changes in technology
if… | supply of A… | |
|---|---|---|
the technology used to produce A improves | ↑ | |
changes in input prices
if… | supply of A… | |
|---|---|---|
the price of an input used to produce A rises | ↓ | |
the price of an input used to produce A falls | ↑ |
number of sellers
if… | supply of A… | |
|---|---|---|
the number of producers of A rises | ↑ | |
the number of producers of A falls | ↓ |
government action - taxes and subsidies
if… | supply of A… | |
|---|---|---|
if A and B are substitutes in production | the price of a good rises due to taxes the price of a good falls due to subsidies | ↓ ↑ |
changes in expectations
if… | supply of A… | |
|---|---|---|
the price of A is expected to rise in the future | ↑ | |
the price of A is expected to fall in the future | ↓ |
1.6 Equilibrium
surplus - quantity demanded is less than quantity supplied
shortage - quantity demanded is greater than quantity supplied
supply and demand analysis
before the change
draw supply and demand
label original equilibrium price and quantity
the change
did it affect supply or demand first?
which determinant caused the shift?
draw increase or decreases
after the change
label new equilibrium?
what happens to price? (increase or decrease)
what happens to quantity? (increase or decrease)
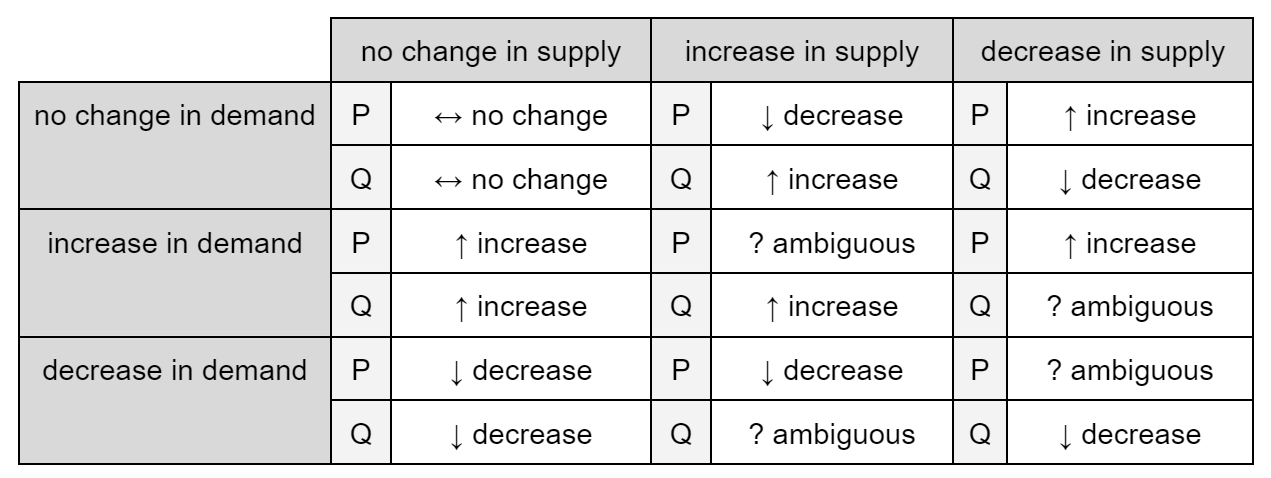
impact of simultaneous shifts of supply and demand on equilibrium price and quantity