AP Human Geography Unit 1 Vocabulary Notes
Human Geography
- The study of the interrelationships between people, place, and environment, and how these vary spatially and temporally across and between locations
Scale
- Generally, the relationship between the portion of Earth being studied and the Earth as a whole
Place
- A specific point on Earth distinguished by a particular characteristic \n
Region
- An area distinguished by a unique combination of trends or features
Formal Region
- An area within which everyone shares in a common one or more distinctive characteristics
Function Region
- An area organized around a node or central point
Vernacular Region
- A place that people believe exists as part of their cultural identity
GPS (Geographic Positioning System)
- This system uses data from satellites to pinpoint a location on earth and help people find their way to a destination
GIS (Geographic Information System)
- A computer system for capturing, storing, checking, and displaying data related to positions on Earth's surface. GIS can show many different kinds of data on one map, such as streets, buildings, and vegetation
Distribution Features
- Patterns in data or features, spread over a designated geographic area \n
Sustainability
- The use of Earth’s renewable and nonrenewable natural resources in ways that do not constrain resource use in the future \n
Physical Systems
- The processes shaping the earth's climate; soils; distributions of plants and animals; landforms, including caves and glacial landscapes; and water, including rivers, lakes, and aquifers
Geospatial Data
- Information that describes objects, events or other features with a location on or near the surface of the earth
Quantitative Data
- Any pieces of information that can be displayed using numbers. Such as populations, distances, prices, and other measurements
Absolute Location
- A place's absolute location is its exact place on Earth, often given in terms of latitude and longitude
Relative location
- A description of how a place is related to other places
Agricultural Density
- The number of farmers per unit of farmland
Arithmetic Density
- The total number of people divided by the total land area. This is what most people think of as density; how many people per area of land
Core-periphery
- Central, wealthy, technologically advanced countries vs. less-developed, poor, and dependant countries
Cultural Ecology
- The geographic study of human-environment relationships
Cultural Landscape
- Forms superimposed on the physical environment by humans Cultural attributes of an area often used to describe a place (Ex: buildings, theaters, places of worship)
Natural Landscape
- The physical landscape or environment that exists before it is acted upon by human activities
Distance Decay
- The theory that states that as the distance between two places increases, the interaction between those two places decreases
Environmental Determinism
- The theory that the physical environment causes social development
Environmental Possibilism
- The theory that the physical environment may set limits on human actions, but people have the ability to adjust to the physical environment and choose a course of action from many alternatives
Diffusion
- The spread of a feature or trend from one place to another over time
Expansion Diffusion
- The spread of a feature from one place to another in a snowballing process
Stimulus Diffusion
- The spread of an underlying principle, even though a characteristic itself apparently fails to diffuse
Contagious Diffusion
- The rapid, widespread diffusion of a characteristic throughout the population
Globalization
- A force or process that involves the entire world and results in making something worldwide in scope
Hearth
- The place from which an innovation originates
Hierarchical Diffusion
- The spread of an idea from persons or nodes of authority to other persons or places
International Date Line
- A line following the 180 degree latitude line running between the South and North Poles and serving as the boundary between one calendar day and the next
Latitude
- The numbering system used to indicate the location of parallels drawn on a globe and measuring distance north and south of the equator
Longitude
- A numbering system used to locate each meridian on Earth's surface
Prime Meridian
- The prime meridian is the line of 0° longitude, the starting point for measuring distance both east and west around Earth
Equator
- A line that runs through the middle of the Earth horizontally, separating the Earth into North and South
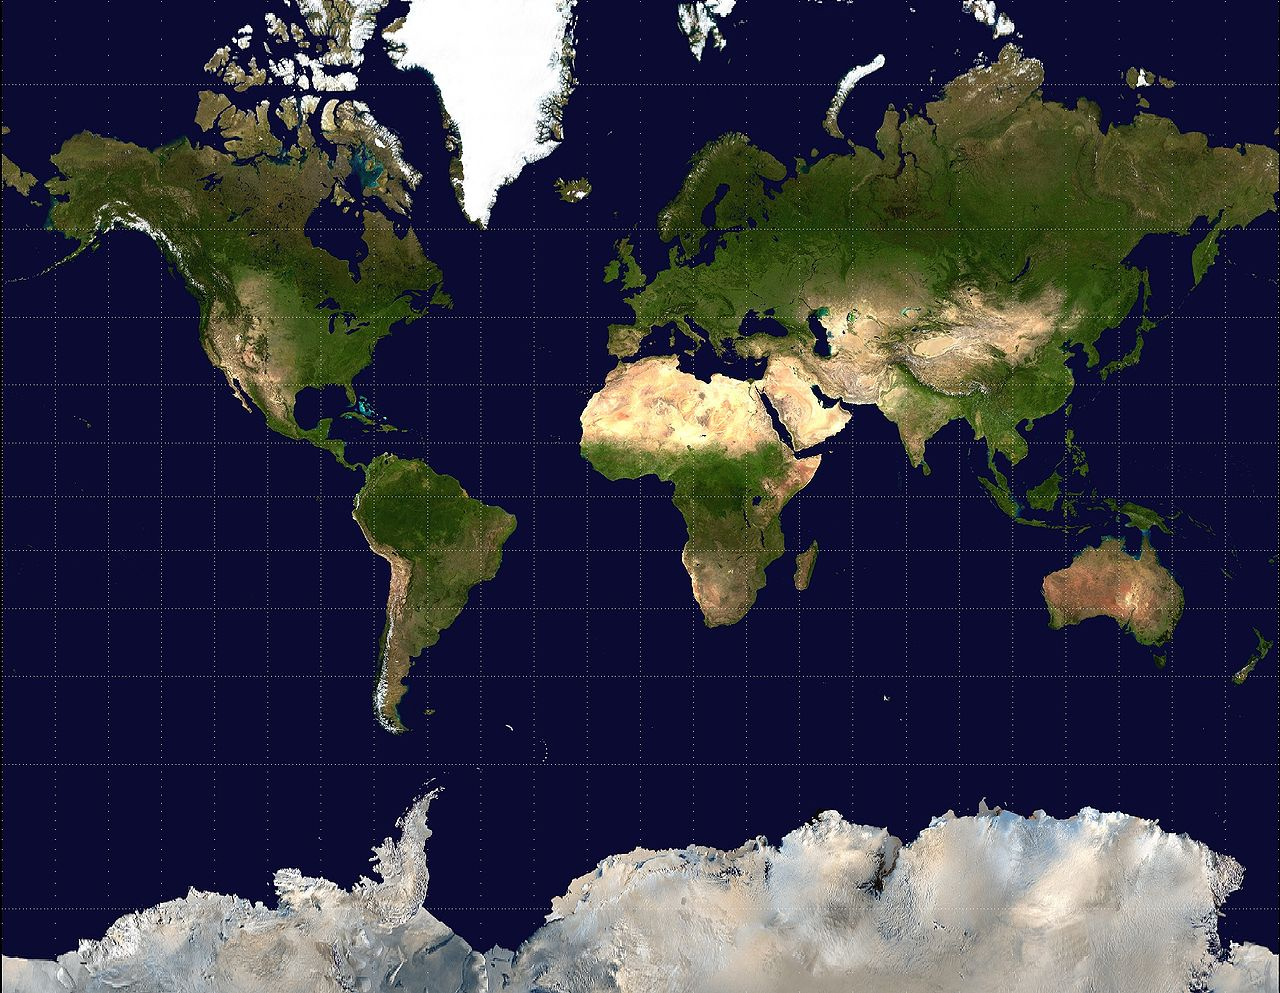
Cartography
- The science of map-making
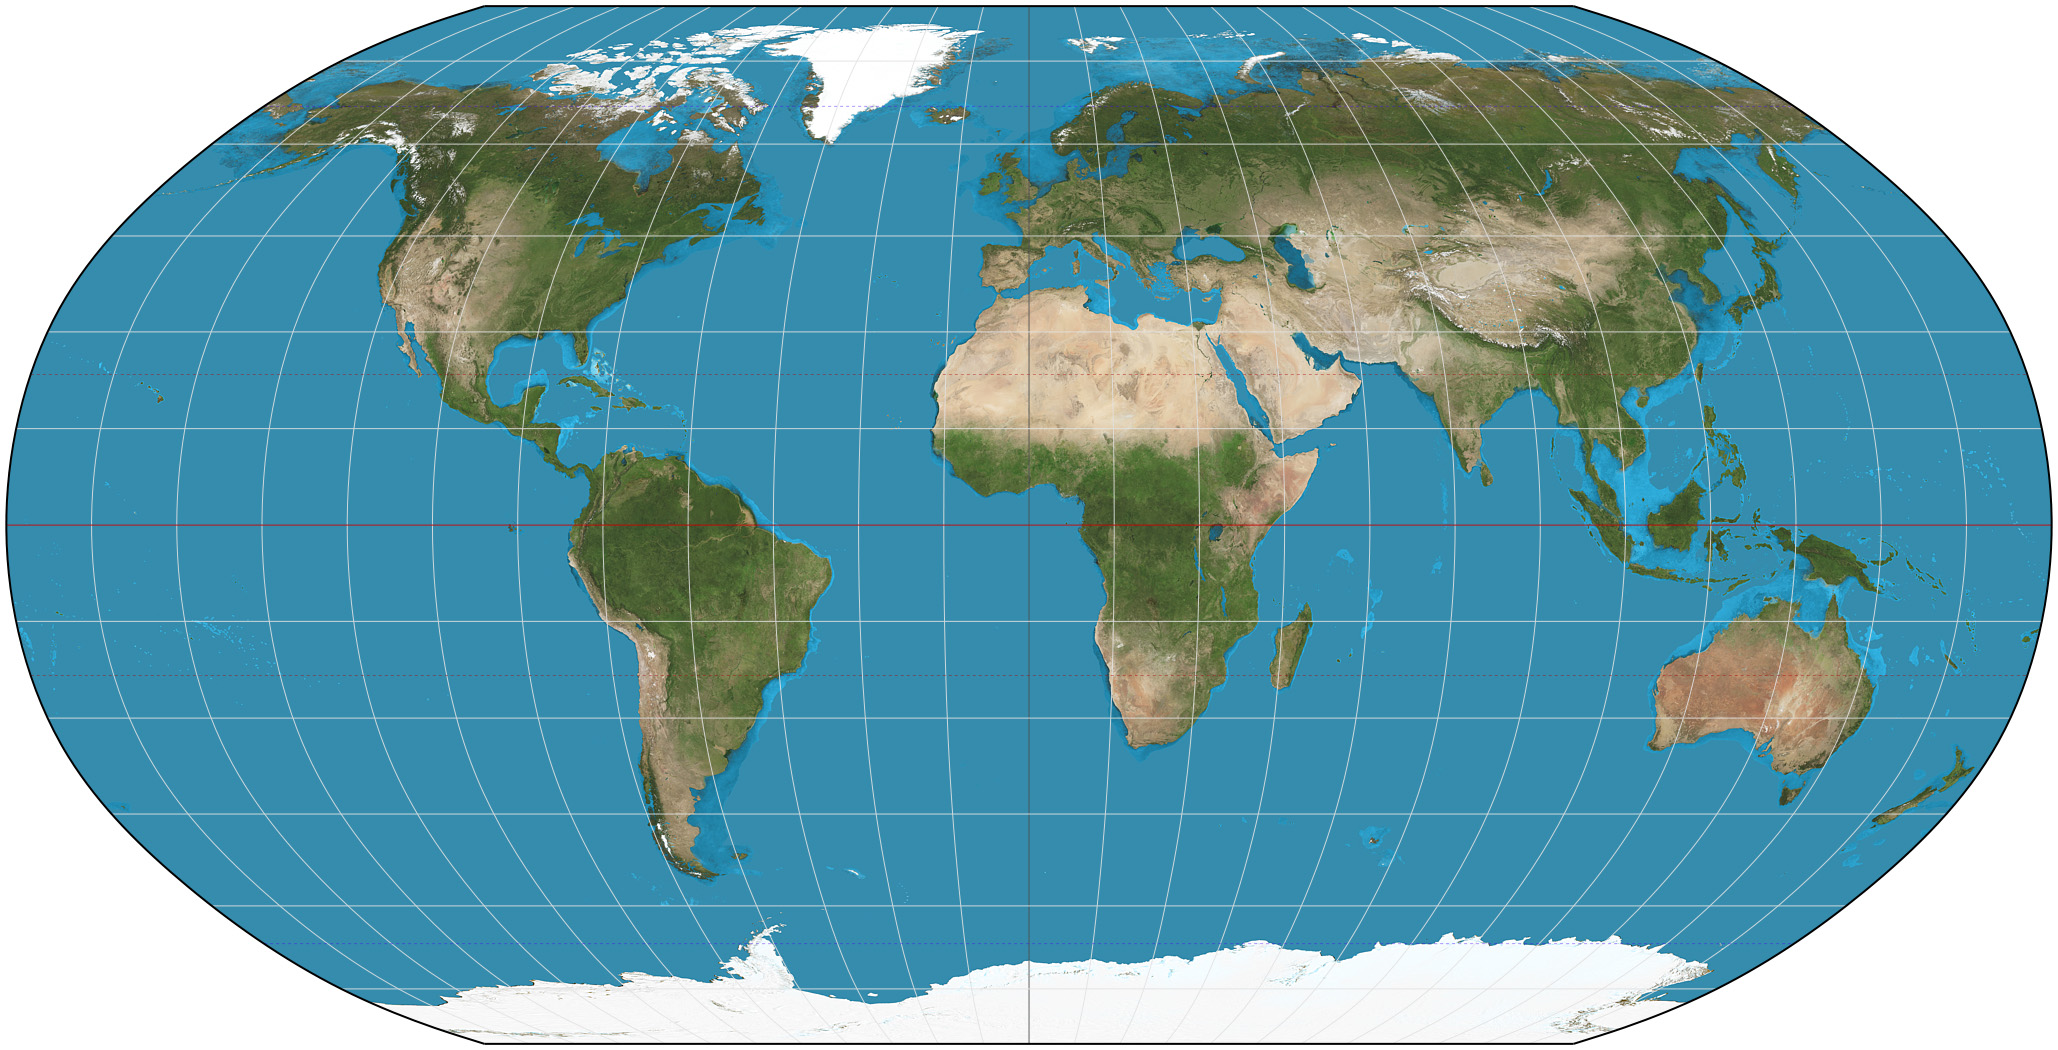
Projection
- The scientific method of transferring locations on Earth's surface to a flat (2D) map
%%Map Projections%%
Mercator Map Projection
- A map projection that fairly accurately shows shape and direction, but distorts distance and size of land masses
Robinson Map Projection
- A compromise map projection showing the poles as lines rather than points and more accurately portraying high latitude lands and water to land ratio
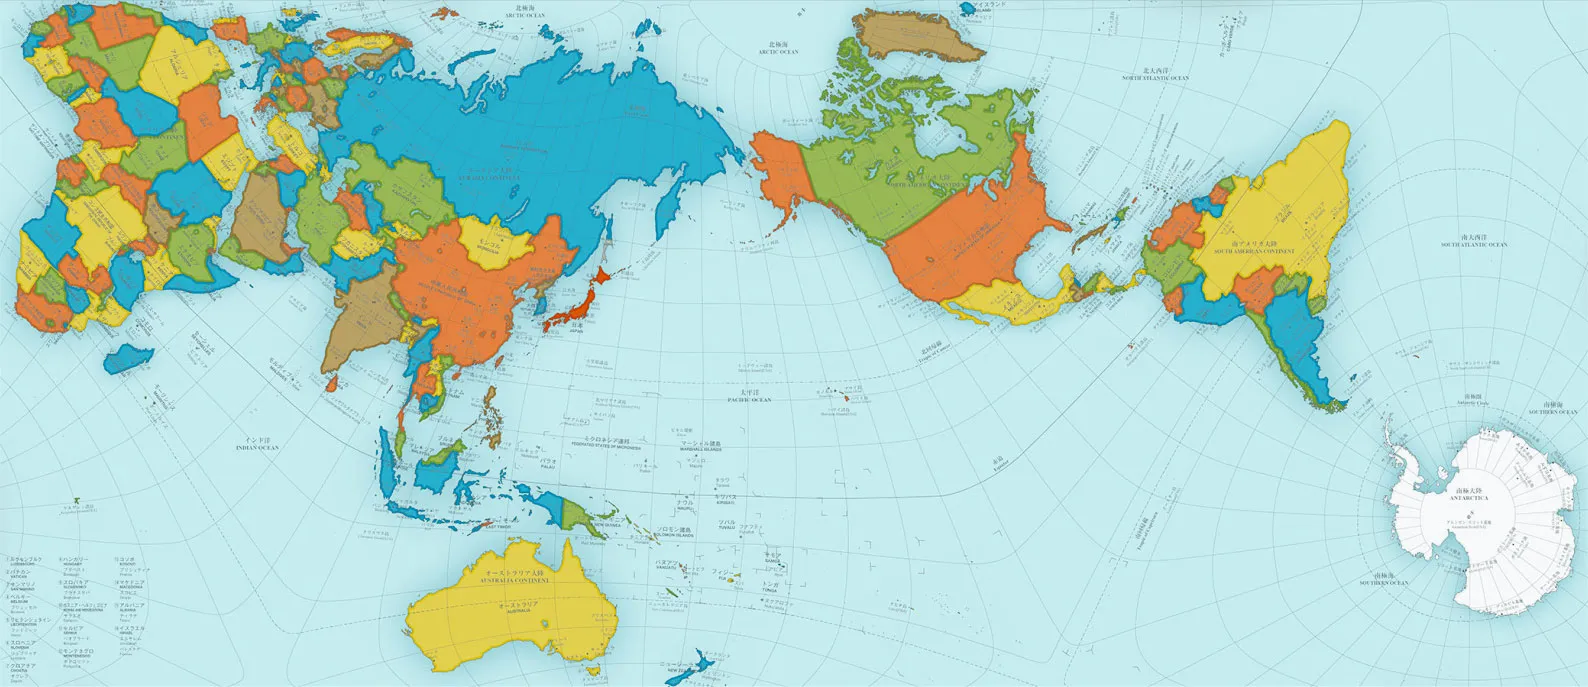
Dymaxion / Fuller Map Projection
- The Dymaxion map is only intended for representations of the entire globe. When presented as a flat map, the land masses are unbroken. The flat map is heavily interrupted in order to preserve shapes and sizes
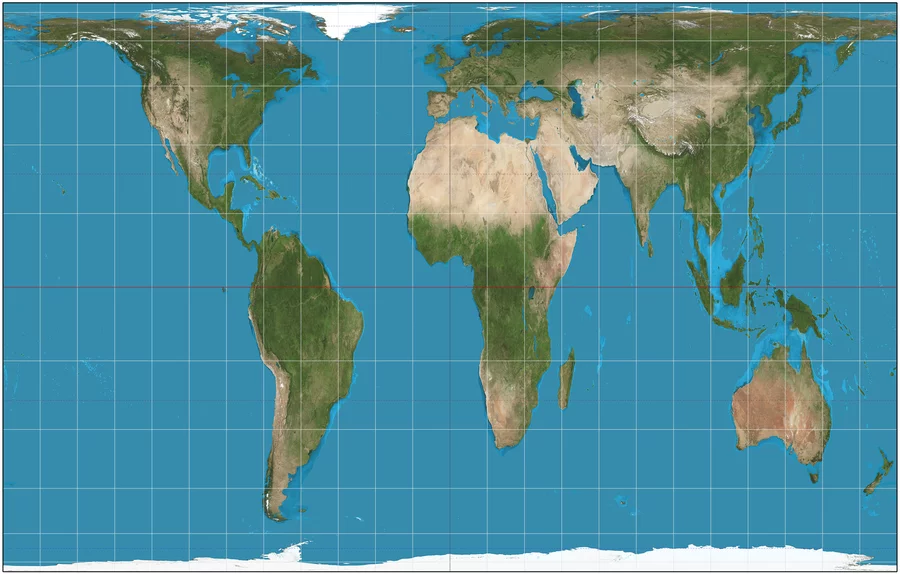
Gall-Peters Map Projection
- The Gall–Peters projection is a rectangular, equal-area map projection. The map shows the correct sizes of countries, but it also distorts their shape
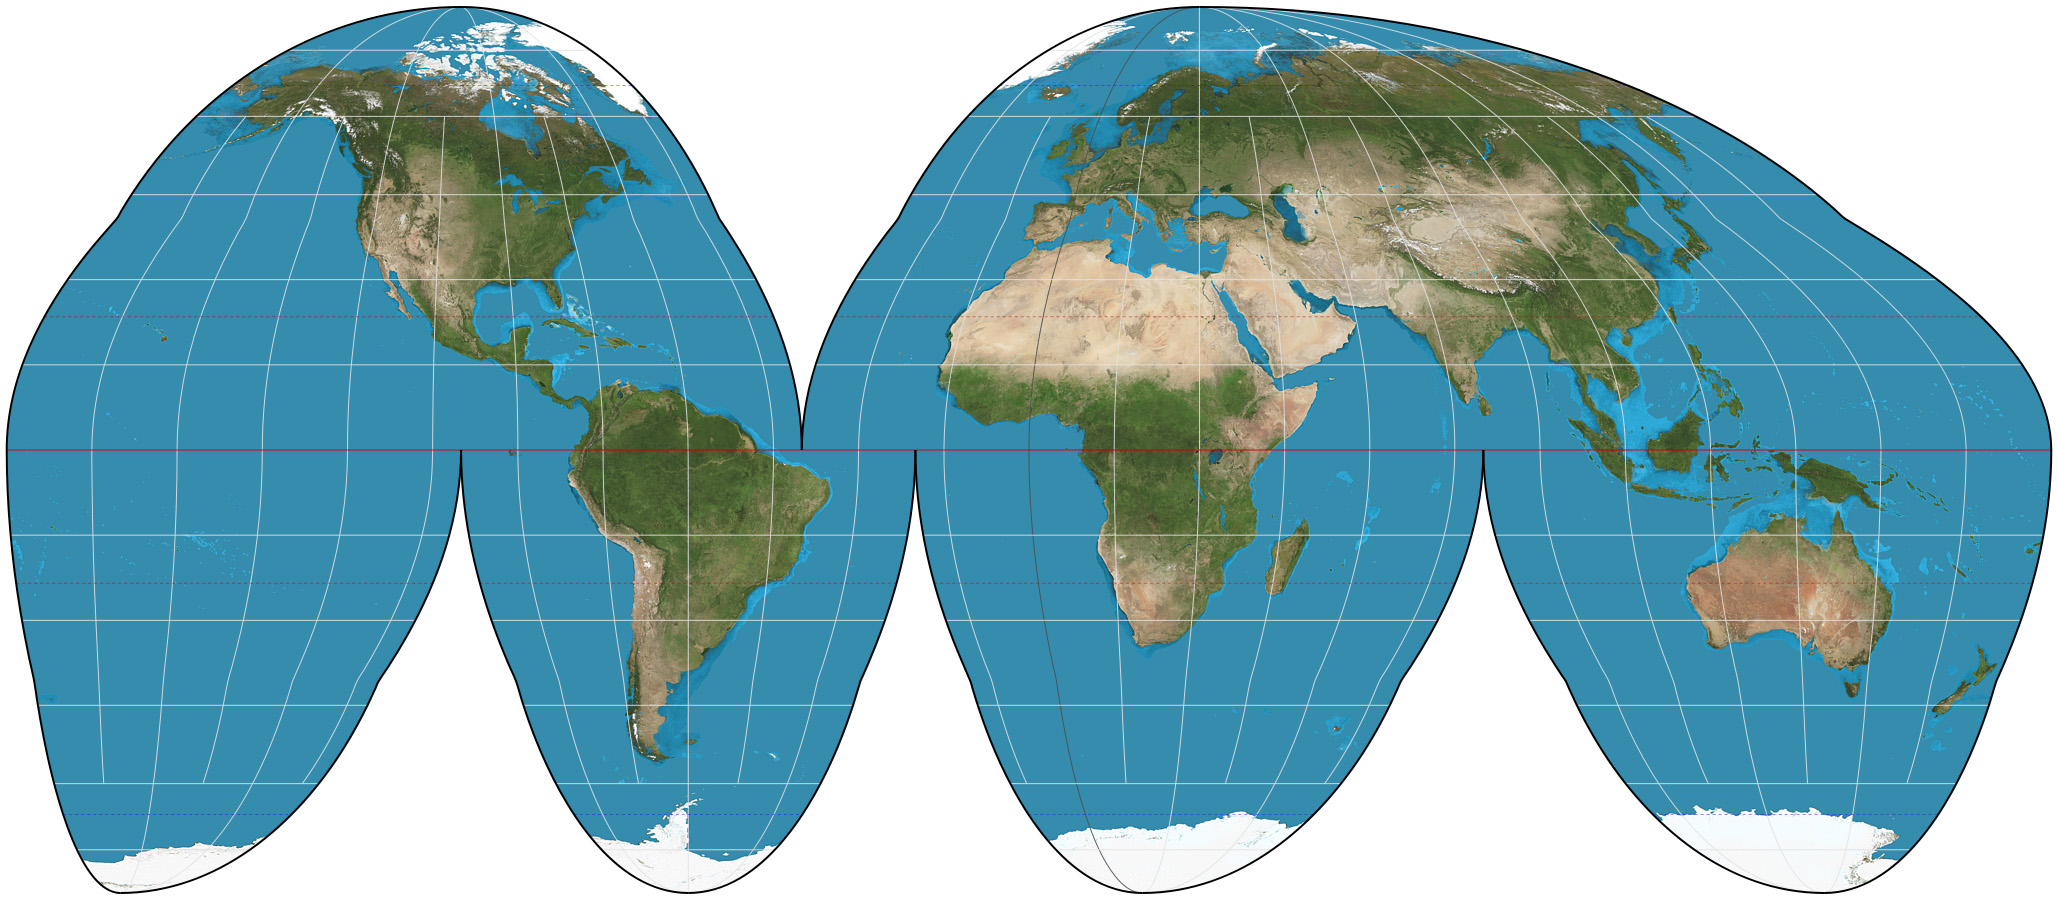
Goode Homolosine Map Projection
- Its ability to minimize distortion for the entire world means it can show the continents proportionally sized to each other. However, it’s use of distances, directions, and angles are not accurately shown because of distortion
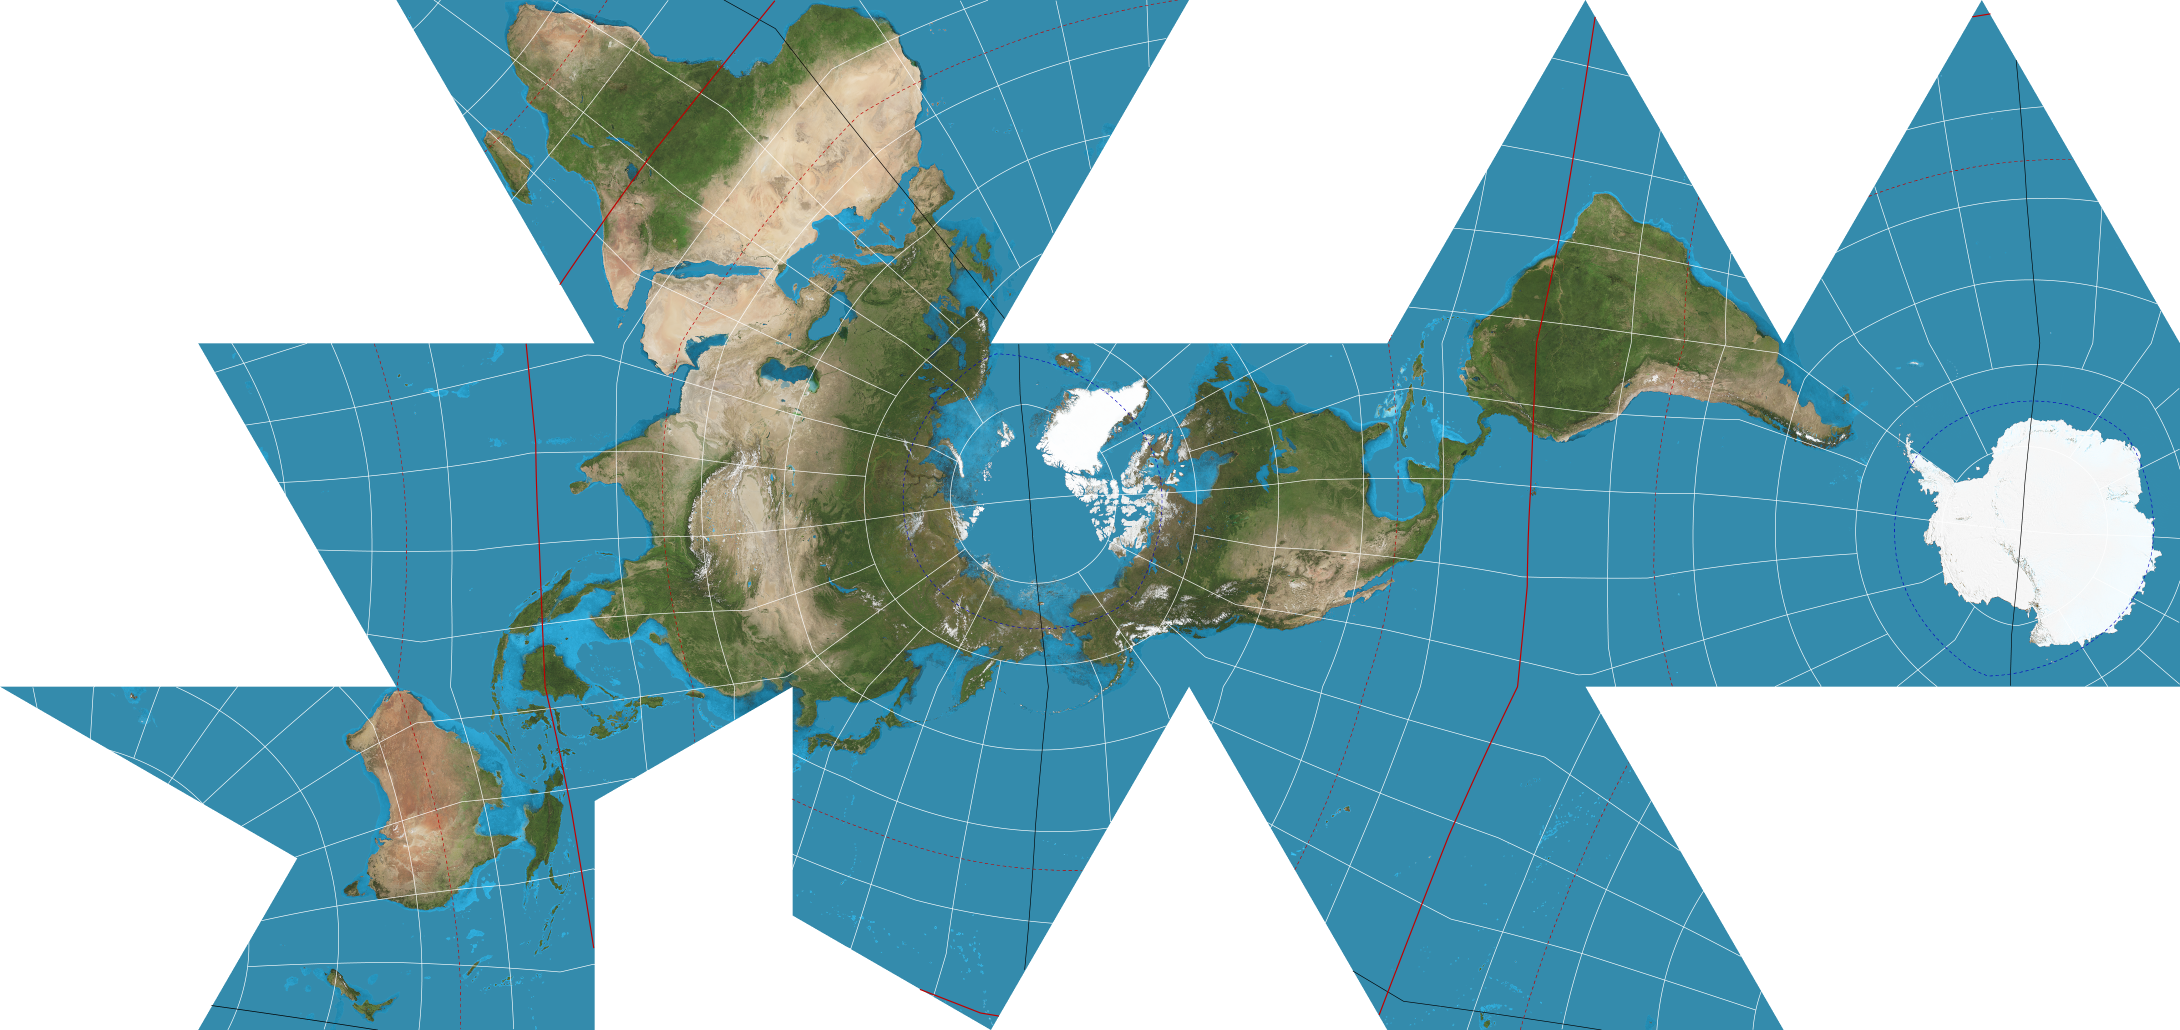
AuthaGraph Map Projection
- It is considered the most accurate projection for its way of showing relative areas of landmasses and oceans with very little distortion of shapes
%%Map Types%%
Thematic Map
A thematic map shows the spatial distribution of one or more specific data themes for selected geographic areas (Ex: Weather maps, population density maps, geology maps)
General Reference Map
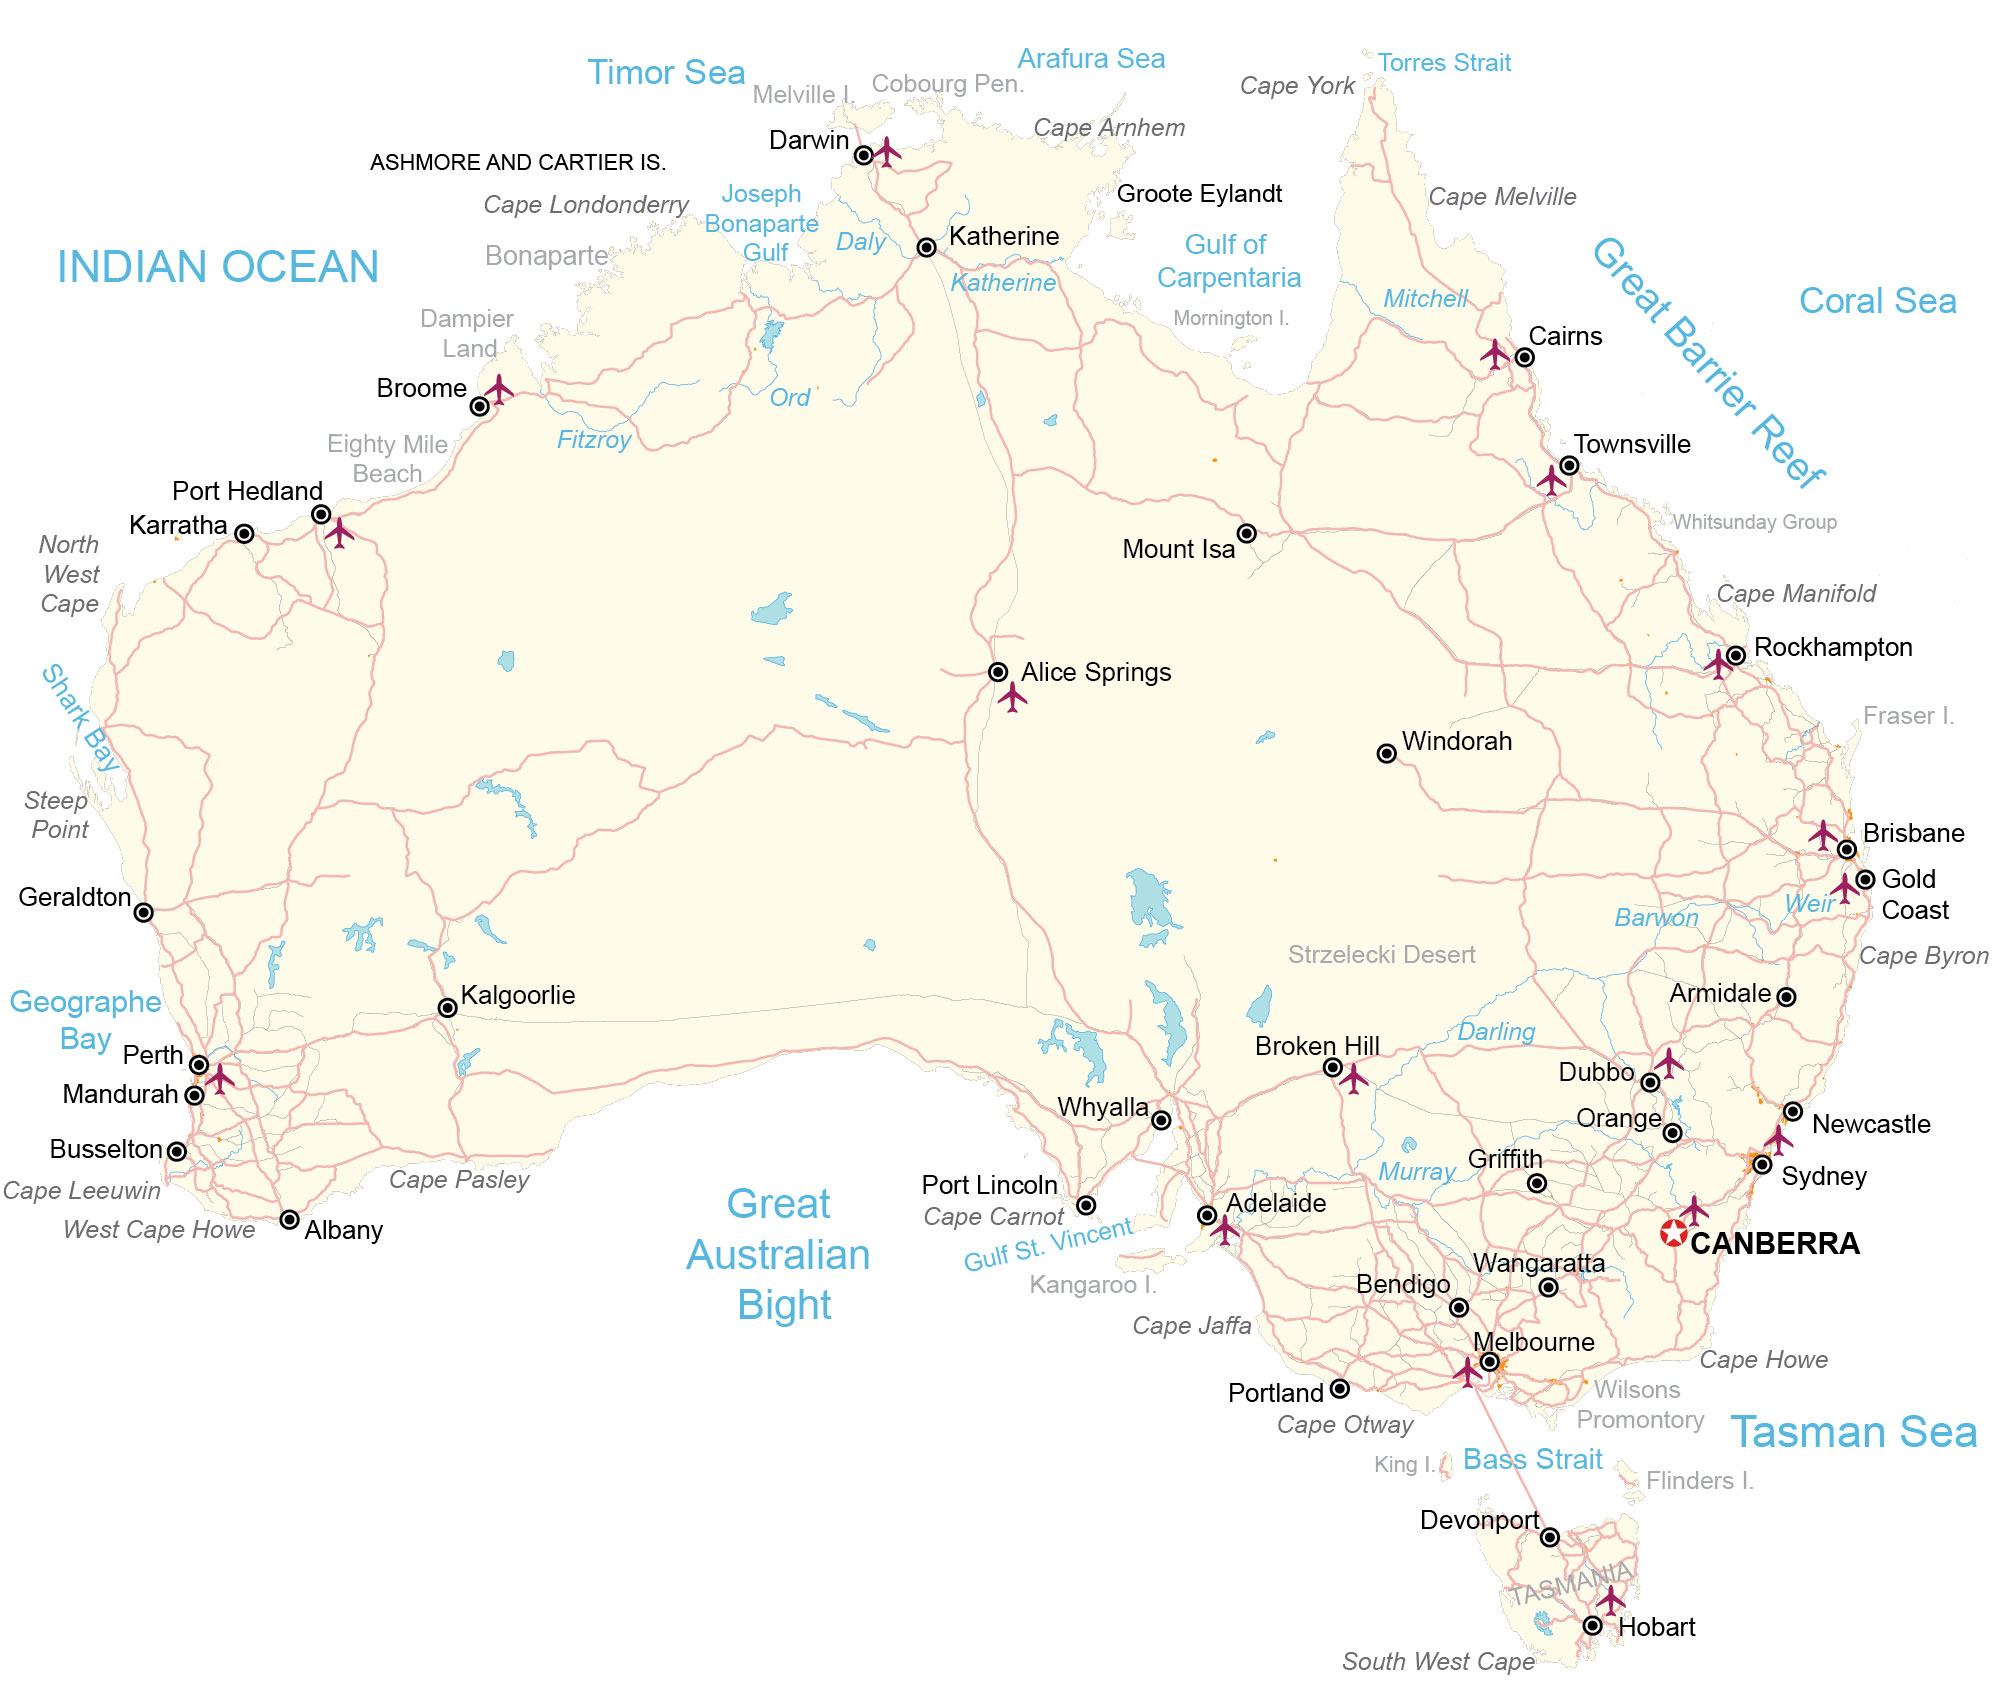
A reference map focuses on the location and names of features, like a political map, road map, or topographic map
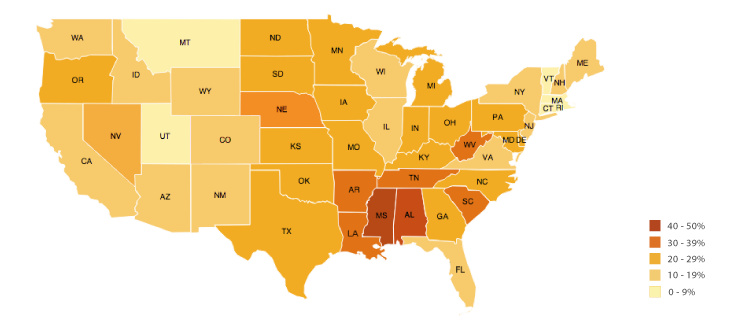
Choropleth Map
- A thematic map using shading to show a pattern of a variable (the darker the shading, the higher the concentration of the variable)
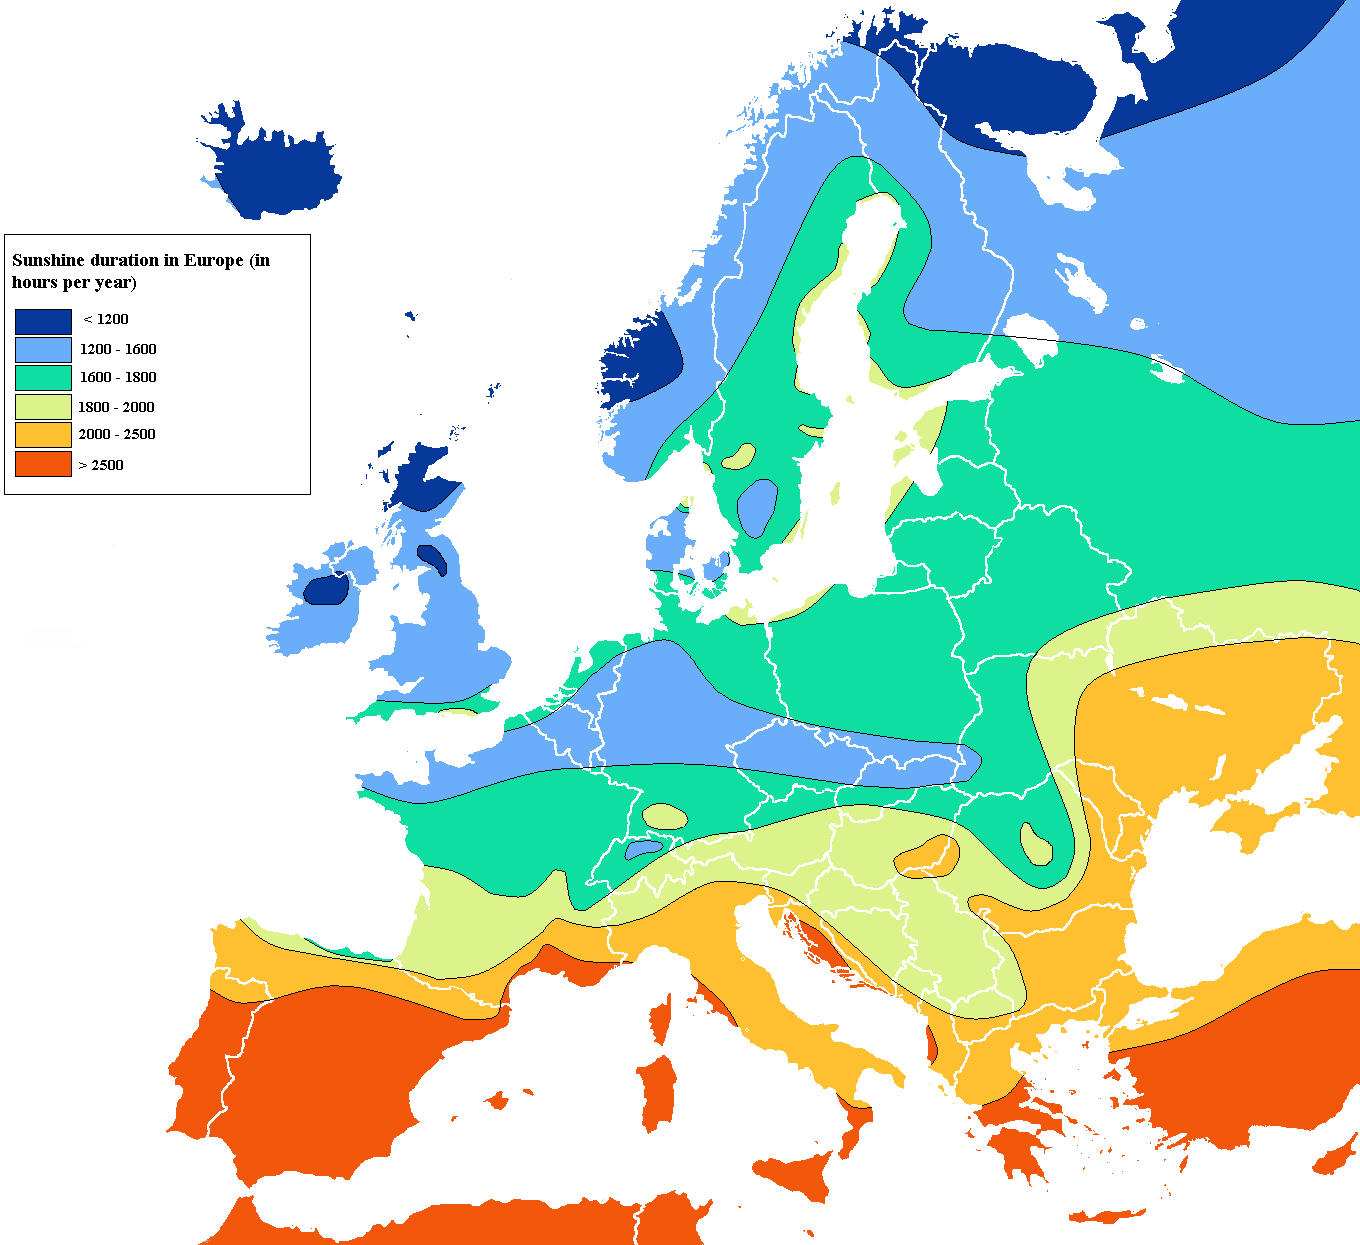
Isoline Map
- Isoline maps are lines drawn on a map connecting data points of the same value
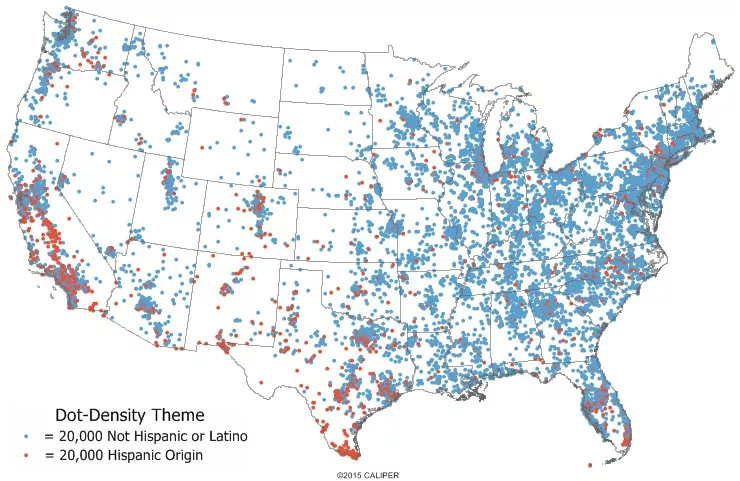
Dot Distribution (Density) Map
- A type of thematic map that uses a point symbol to visualize the geographic distribution of a large number of related phenomena
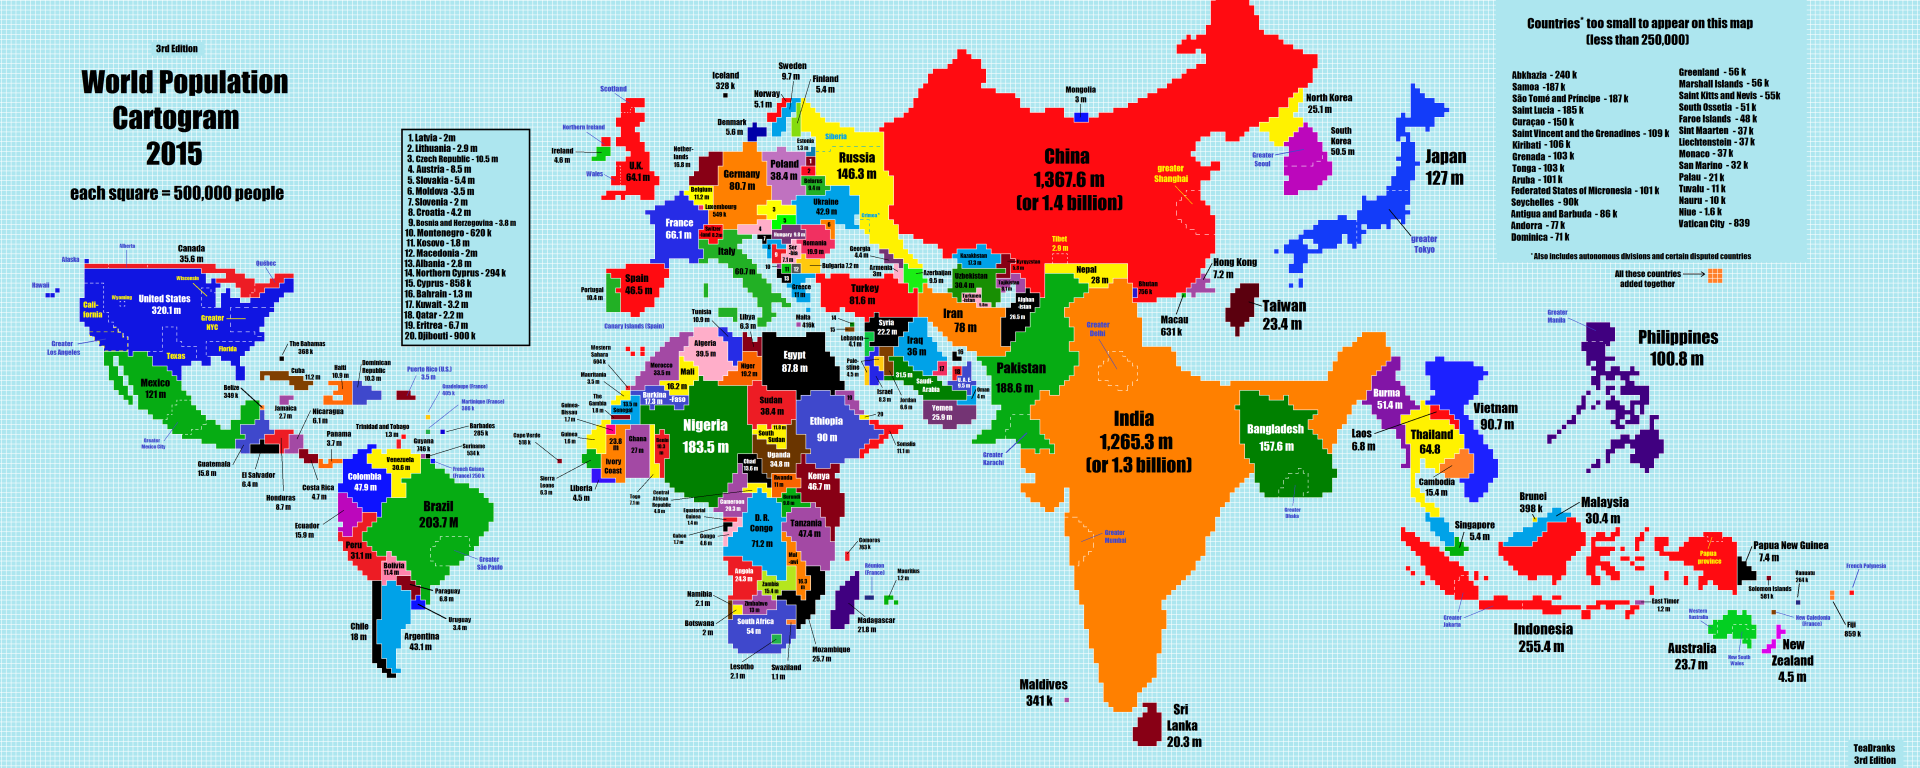
Cartogram Map
- Cartogram maps distort the shape of geographic region so that the area directly shows a specific data variable
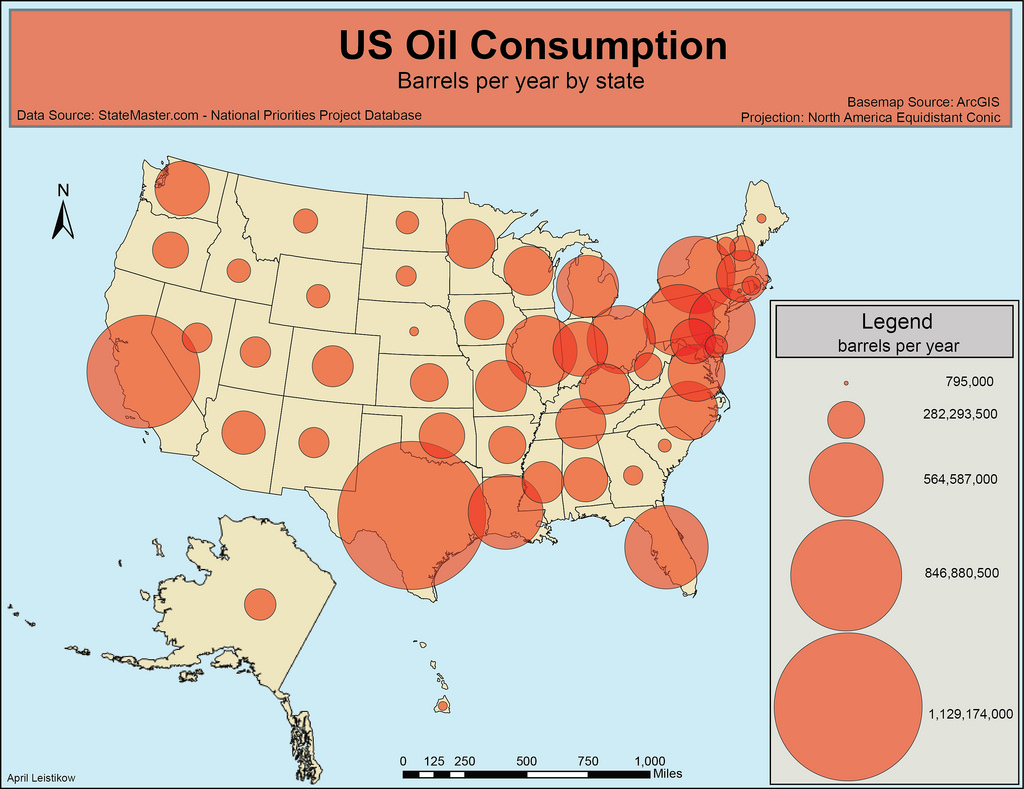
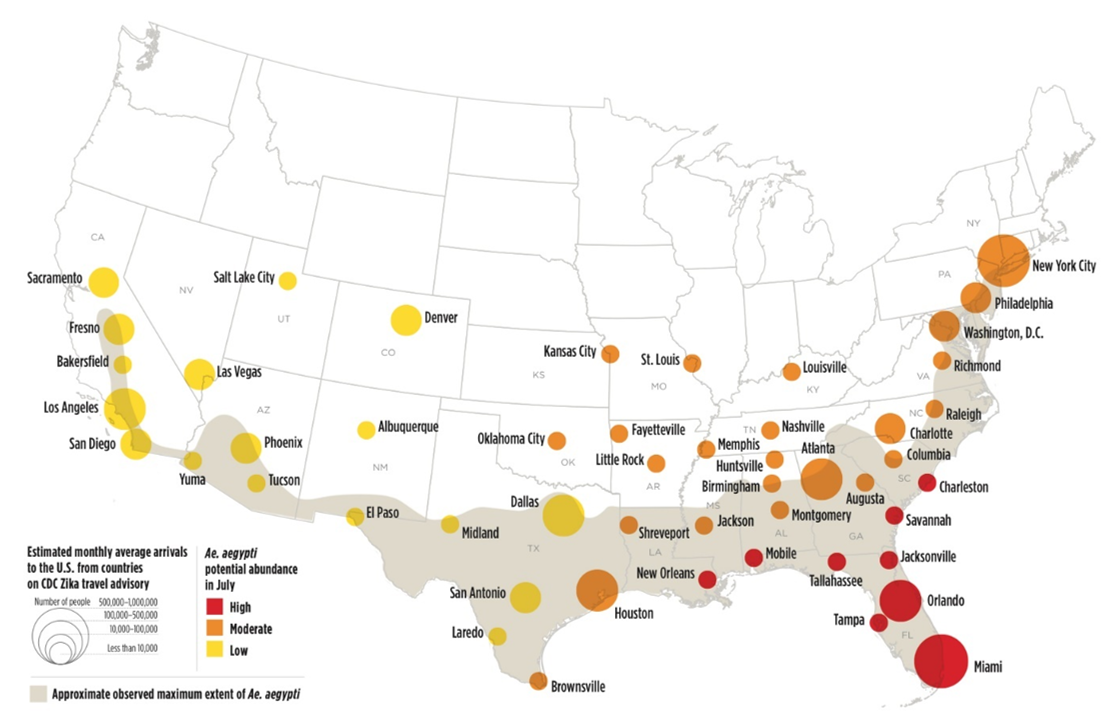
Graduated / Proportional Symbol Map
- A type of thematic map with symbols that change in size according to the value of the attribute they represent. For example, denser populations might be represented by larger dots, or larger rivers by thicker lines
- Many geographers consider graduated symbol and proportional symbol maps to be interchangeable, although they are slightly different. For proportional symbol maps, the size of the symbols are in direct relation to the value that is being displayed. Graduated symbols use symbol sizes to represent classes of data rather than unique or absolute values