Chapter 9: Quantitative Genetics
Quantitative Vs. Qualitative
Qualitative traits: characteristics that show DISCRETE variation
Quantitative traits: characteristics show continuous variation (height, speed) usually measurable through a chart.
Quantitative Traits
Quantitative traits are usually the result of the combined genetic effect of many loci plus the environment. The same genotype can express various phenotypes depending on environmental conditions. The more genes influencing the trait, the more continuous/quantitative it is.
Rather than describing the population in terms of genotypes and allele frequencies, classical quantitative genetics describes traits in terms of variance and mean (uses statistical analysis).
Modes of Selection
Modes of selection: directional, stabilizing, and disruptive
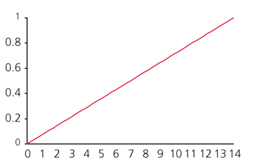
Directional Selection
Direction selection favors 1 extreme of the frequency distribution of the trait over time. The mean value will change. Over time the variance of the trait will decrease. An example of this is drought selected for larger beak size in ground finches.
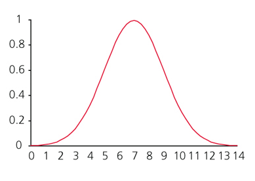
Stabilizing Selection
Stabilizing Selection acts against the extremes of the frequency distribution of the trait, fitness peaks at intermediate values. The mean value will remain the same, the variance will decrease, and the distribution will narrow. An example of this is birth weight in infants.
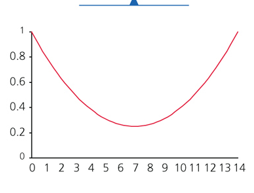
 Disruptive Selection
Disruptive Selection acts against intermediate values of the trait, favoring the extremes. Fitness of intermediate values decreases and increases for the extremes. The mean stays the same and the variance increases. This is NOT common. An example of this is the bill size for Black-Bellied Seedcrakers.