Unit 3 - Populations
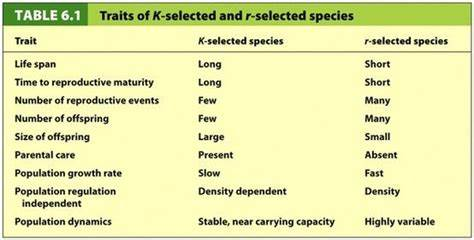
3.2 K-Selected and R-Selected Species
- Identify differences between k- and r-selected species
Quality vs Quantity
K-selected - “quality”
- few offspring, heavy parental care
- high reproduction rates (reproduce many times)
- ex. most mammals, birds
- long lifespan
- long time to sexual maturity = low biotic potential = slow population growth rate
- more likely to be disrupted by environmental change or invasives
R-selected - “quantity”
- many offspring, little to no care
- low reproduction rates (may reproduce only once)
- ex. insects, fish, plants
- shorter lifespan
- quick to sexual maturity = high biotic potential = high population growth rate
- more likely to be invasive
- better suited for rapidly changing environmental conditions
Invasiveness and Disturbances
K-selected
- low biotic potential (rep. rate) = hard for population to recover after a disturbance (env. change)
- high parental care means death of parent = death of offspring
- invasives (usually r) outcompete for resources with high biotic potential and rapid population growth
- less likely to adapt and more likely to go extinct
R-selected
- high biotic potential (rep. rate) = more rapid population recovery after disturbance
- low parental care means death of parent doesn’t impact offspring
- not as impacted by invasive species since their population grows quickly
- more likely to be invasive
- larger population and faster generation time = higher chance of adaptation and lower chance of extinction
3.3 Survivorship curves
- Explain survivorship curves
Survivorship Curves
A survivorship curve is a line that shows survival rate of a cohort (group of same aged individuals) in a population from birth to death
- Faster drop in line = quicker die-off of individuals
- Slower drop in line = longer average lifespan
Type I, II, and III
Type 1 (mostly K-selected)
- high survivorship early in life due to high parental care
- high survivorship in mid life due to large size and defensive behavior
- rapid decrease in survivorship in late life as old age sets in
- ex. most mammals
Type 2 (in between r and K)
- steadily decreasing survivorship throughout life
Type 3 (mostly r-selected)
- high mortality (low survivorship) early in life due to little to no parental care
- few make it to midlife; slow, steady decline in survivorship in mid life
- even fewer make it to adulthood; slow decline in survivorship in old age
- ex. insects, fish plants
3.4 Carrying Capacity
- Describe carrying capacity
- Describe the impact of carrying capacity on ecosystems
Carrying Capacity (k)
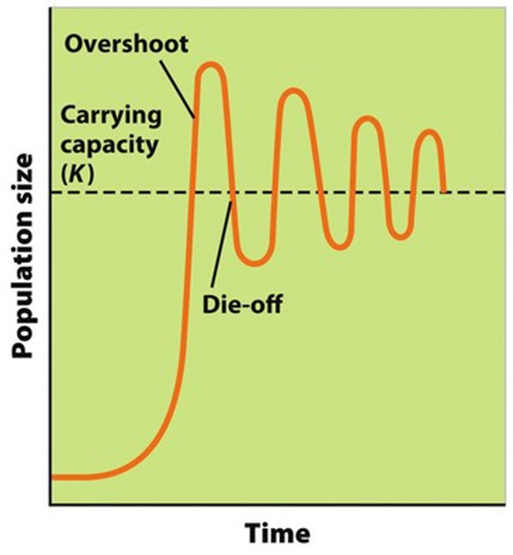
Population briefly “overshoots” (k) and then die-off happens
- the highest population size an ecosystem can support based on limiting resources:
- food
- water
- habitat (nesting sites, space)
Overshoot:
- when a population briefly exceeds carrying capacity
- ex. deer breed in fall, give birth all at once in spring; sudden spike in population = overshoot
Consequence of overshoot:
- resource depletion ex: overgrazing in deer
Die-off:
- sharp decrease in population size when resource depletion (overshoot) leads to many individuals dying
- ex. many deer starve with too many new fawns feeding in spring
Die-off Example
- Reindeer of St. Paul Island
- 25 introduced in 1910
- Growth was gradual (10’ - 30’) then exponential (30’-37’)
- Carrying capacity was overshot
- Sharp die-off lead to population crash as food resource (lichen) were severely depleted
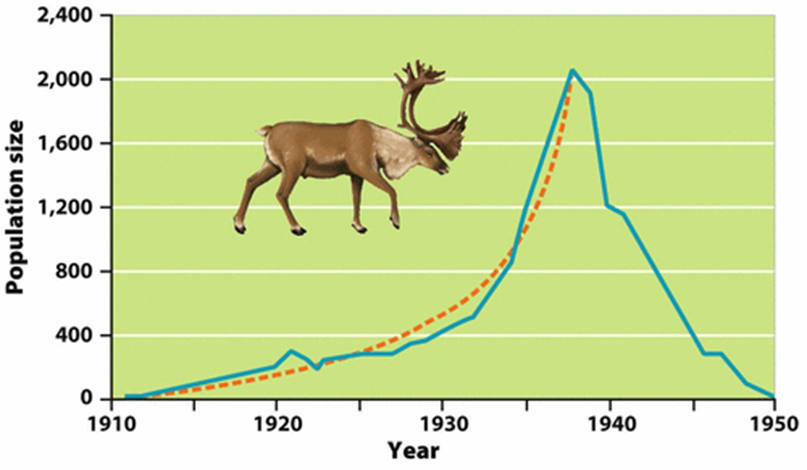
- Real populations don’t always fluctuate around carrying capacity. If resource depletion is severe enough, total population crash can occur
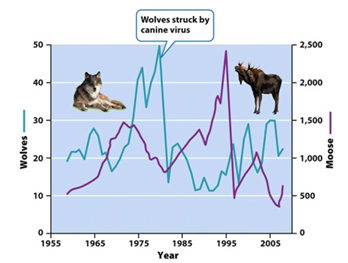
Predator-Prey
- Hare population increase due to low predator population (lynx)
- Lynx population increase due to increase in food (hare)
- Increasing lynx population limits hare population; leads to die-off
- Hare die-off decreases lynx food source, leading to die-off
- Hare population increase due to low predator population (lynx)
 \n
\n 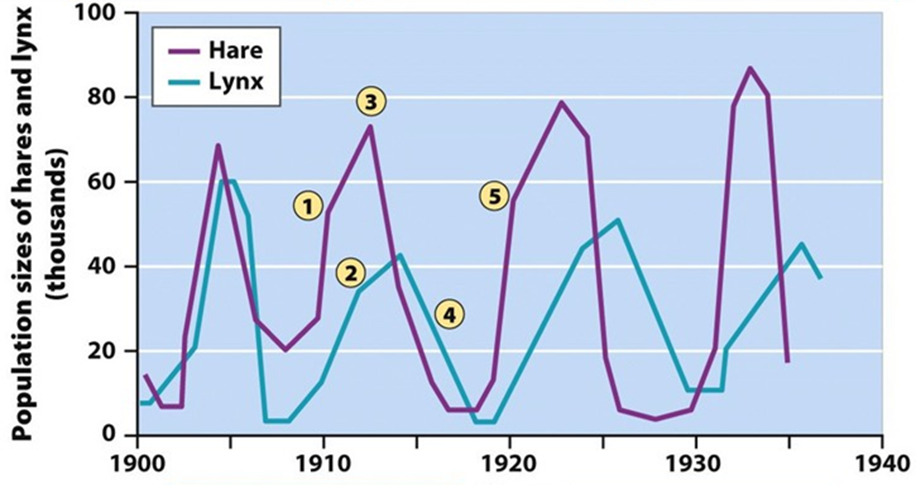
3.5 Population Growth and Resource Availability
Learning Objective
- Explain how resource availability affects population growth
Population Growth
Size (n)
- total number of individuals in a given area at a given time
- larger = safer from population decline
Density
- of individuals/area
- ex : (12 panthers/km^2)
- high density = higher competition, possibility for disease outbreak, possibility of depleting food sources
Distribution
- how individuals in population in are spaced out compared to each other
- random (trees)
- uniform (territorial animals)
- clumped (herd/group animals)
Growth Factors
Sex ratio
- ratio of males to females. the closer to 50:50, the more ideal for breeding (usually)
- die-off or bottleneck effect can lead to skewed sex ratio (not enough females) limiting population growth
Density-Dependent Factors
- factors that influence population growth based on size
- ex. food, competition for habitat, water, light, even disease
- ex. cont. when twice as much food was added, carrying capacity increased by about 2x
- all of these things limit population growth based on their size; aka - small population
Density-Independent
- factors that influence population growth independent of their size
- ex. natural disasters (flood, hurricane, tornado, fire)
- it doesn’t matter how big or small population is, natural disasters limit them both.
Biotic Potential
Biotic potential
- exponential growth
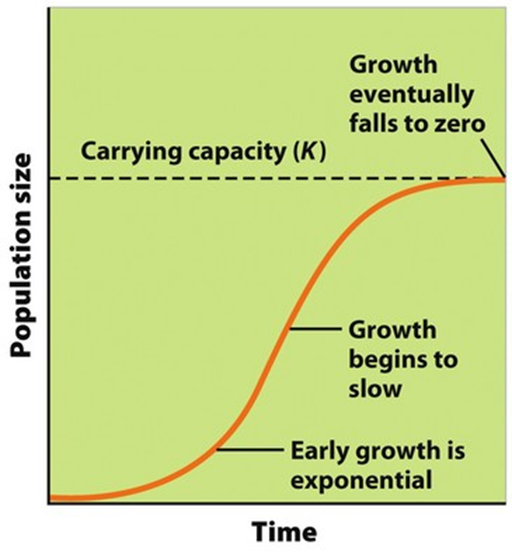
Logistic growth
- initial rapid growth, then limiting factors limit pop. to K
Biotic Potential
- max. potential growth rate, with no limiting resources
- May occur initially, but limiting resources (competition, food, disease, predators) slow growth, & eventually limit pop. to carrying capacity (k)
Calculating Population Change
Population Size = (Immigrations + births) - (immigrations + deaths)
- Ex: An elk pop. of 52 elk has 19 births and 6 deaths in a season, and 5 new \n elk immigrate to the herd and 0 elk emigrate from the heart
3.6 Age Structure Diagrams
Learning Objective
- Explain age structure diagrams
Age Cohorts
Age cohorts & growth
- groups of similarly aged individuals
0-14 = prereproductive
15 - 44 = reproductive age
45 + = post reproductive
- Size difference between 0-14 & 15-44 indicates growth rate
- Larger 0-14 cohort = current & future growth
- Roughly equal 0-14 & 15-44 = slight growth/stable
- Larger 15-44 = pop. decline
Pyramid Shapes
- Extreme Pyramid shape = rapid growth
- Less extreme pyramid = slow, stable growth
- House = stable, little to no growth
- Narrowest @ base = declining pop.
3.7 Total Fertility Rate
Learning Objective
- Explain factors that affect total fertility rate in human populations
TFR & Infant Mortality
Total Fertility Rate
- average number of children a woman in a population will bear throughout her lifetime
- higher TFR = higher birth rate, higher population growth rate (generally)
Factors that affect TFR
- development: more developed or wealthy nations have a lower TFR than less developed nations
- more educational access for women
- more economic opportunity for women
- higher access to family planning education and contraceptives
- later age of first pregnancy
- less need for children to provide income through agricultural labor
- educational and economic opportunities require more time and leave less time for raising children
- government policy can play a huge role in fertility by coercive (forceful) or non-coercive (encouraging) policies
- forced or voluntary sterilization
- china’s 1 (now 2) child policy
- tax incentives to have fewer children
- microcredits or loans to women without children to start businesses
More education = fewer unplanned pregnancies
More education = more job opportunities for women
- alternative to marrying young
Replacement Level Fertility
- the TFR required to offset deaths in a population and keep population size stable
- about 2.1 in developed countries
- higher in less developed countries due to higher infant mortality
Infant Mortality Rate (IMR)
- number of deaths of children under 1 year per 1,000 people in a population
- higher in less developed countries due to lack of access to health care, clean water, enough food, etc.
- Higher IMR = higher TFR, due to families having replacement children
- Lower IMR = Lower TMR
Factors in IMR decline
- access to clean water
- access to healthcare (hospitals, vaccines, vitamins and supplements for moms and babies)
3.8 Human Population Dynamics
Learning Objective
- Explain how human populations experience growth and decline
Does Earth Have a Human Carrying Capacity?
Malthusian theory (what Malthus theorized):
- Earth has a human carrying capacity, probably based on food production
- Human population growth is happening faster than growth of food production
- Humans will reach a carrying capacity limited by food
Technological Advancement
- Humans can alter earth’s carrying capacity with tech. Innovation
- Ex: synthetic fixation of Nitrogen in 1918 leads to synthetic fertilizer, dramatically increasing food supply
Birth Rate, Death Rate, and Growth
Growth Rate (r) = % increase in a population (usually per year)
- Ex: a growth rate of 5% for a population of 100 means they grow to 105
Crude Birth Rate & Crude Death Rate (CBR & CDR)
- Births & deaths per 1,000 people in a pop.
- Ex: Global CBR = 20 & CDR = 8
Calculating Growth Rate (r)
- {{Growth Rate = (CBR - CDR )/ 10{{
Rule of 70
The time it takes (in years) for a population to double is equal to 70 divided by the growth rate
Factors Affecting Human Population Growth
Factors that increase population growth
- higher TFR = higher birth rate
- high IMR can drive up TFR
- high immigration level
- increased access to clean water and healthcare (decrease death rate)
Factors that decrease population growth rate
- high death rate
- high IMR
- increased development (education and affluence)
- increased education for women
- delayed age of first child
- postponement of marriage age
Standard of Living Indicators
Standard of Living
- what the quality of life is like for people of a country based
Gross Domestic Product (GDP)
- key economic indicator of standard of living
- total value of the goods and services produced
- per capita GDP is total GDP/total population
Life Expectancy
- key health indicator of standard of living
- average age a person will live to in a given country
- increases with access to clean water, health care, and stable food sources
NOTE: High GDP and life expectancy are both indicators of developments and low population growth
3.9 Demographic Transition
Learning Objective
- Define the demographic transition
Industrialization
Industrialization
- the process of economic and social transition from an agrarian (farming) economy to an \n industrial one (manufacturing based)
Pre-industrialized/Less developed
- A country that has not yet made the \n agrarian to industrial transition
- Typically very poor (low GDP)
- Typically high death rate & high infant mortality
- High TFR for replacement children & agricultural labor
Industrializing/developing
- part way through this transition
- Decreasing death rate & IMR
- Rising GDP
Industrialized/developed
- completed the transition
- Very low DR & IMR
- Very High GDP
- Low TFR
Stage 1 - Preindustrial
- High IMR and high death rate due to lack of access to clean water, stable food supply, and healthcare
- high TFR due to lack of access to
- education for women
- contraceptives/family planning
- need for child agricultural labor
- little to no growth due to high CBR and CDR balancing each other out
- ex. virtually no country is in phase 1
Stage 2 - Industrializing/Developing
- Modernizations brings access to clean water, healthcare, stable food supply
- IMR and CDR decline
- TFR remains high due to
- lack of education for women and contraceptives/family planning
- need for child agricultural labor
- generational lag (takes time for education and societal change to spread)
- Economic and societal indicators
- low per capita GDP
- shorter life expectancy
- high infant mortality
- high TFR
- low literacy rate and school expectancy for girls
NOTE: rapid growth due to high CBR and declining CDR
Stage 3 - Developed/Industrialized
- modernized economy and society increase family income, so TFR declines significantly due to
- more education opportunities for women
- delayed age of marriage and first child to focus on education and career
- access to family planning and contraceptives
- economical and social indicators
- high per capita GDP
- long life expectancy
- low infant mortality
- TFR near replacement level
- high literacy rate and school life expectancy for all
Stage 4 - Post-industrialized/Highly Developed
- highly modernized countries that are very affluent
- TFR declines even further as families become more wealthy and spend even more time on educational and career pursuits
- increased wealth and education brings even more prevalent use of family planning and contraception
- economical and social indicators
- very high per capita GDP
- longest life expectancy
- TFR below replacement level
- highest contraceptive use rates
NOTE: CBR drops lower that CDR and growth becomes negative (population decline)