AP Micro Unit 2
2.1 Demand
Demand is the different quantities of goods that consumers are willing and able to buy at different prices.
Law of Demand
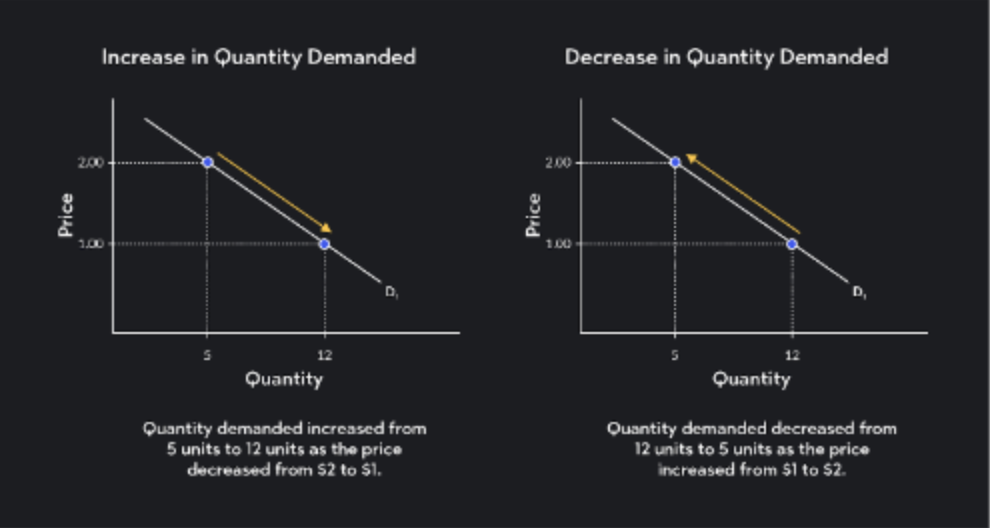
There is an inverse relationship between price and quantity demanded; as the price of a good decreases, the quantity demanded typically increases, and vice versa.
Why does demand change?
The substitution effect
if the price goes up for one product, a consumer will buy more of a substitute product
The Income Effect
If the price goes down, the purchasing power increases for customers, allowing them to purchase more.
The Demand Curve
Downward sloping concave curve
Goes from high to low, inverse relationship to price
Each time price gets cheaper, more people want the product
Shifts in Demand
Ceteris paribus - “all other things held constant”
Price does not change demand, it changes quantity demanded.
5 Shifters of Demand
Tastes and preferences
Number of consumers
Price of related goods
Income
Future expectations
Price of Related Goods
Substitutes
goods used in place of another
Complements
two goods that are bought and used together
Income
Normal goods
ex: new cars
As income increases, demand increases
As income falls, demand falls
Inferior Goods
ex: ramen
As income increases, demand falls
As income falls, demand increases
2.2 Supply
Supply
the different quantities of good that sellers are willing and able to sell (produce) at different prices
Higher the price is, the more you’ll want to supply!
Law of Supply
There is a direct (positive) relationship between price and quantity supplied.
As the price goes up, the quantity supplied by producers will go up.
If supply increases, the original supply curve will be replaced by a supply curve located to the right of the original (the original curve experienced a rightward shift). If supply decreases, the original supply curve will be replaced by a supply curve located to the left of the original (the original curve experienced a leftward shift). It is appropriate to use "right" and "left" to categorize these shifts because supply is measured on the x-axis and numbers get larger as you head to the right on the x-axis and smaller as you head to the left on the x-axis.
5 Shifters of Demand
Price/availability
Number of sellers
Technology
Government action: taxes and subsidies
Expectations of future profit
2.3-2.5 Price Elasticity of Demand
Elasticity
Determines how much more or how much less
Consumers will buy more when prices go down and less when prices go up
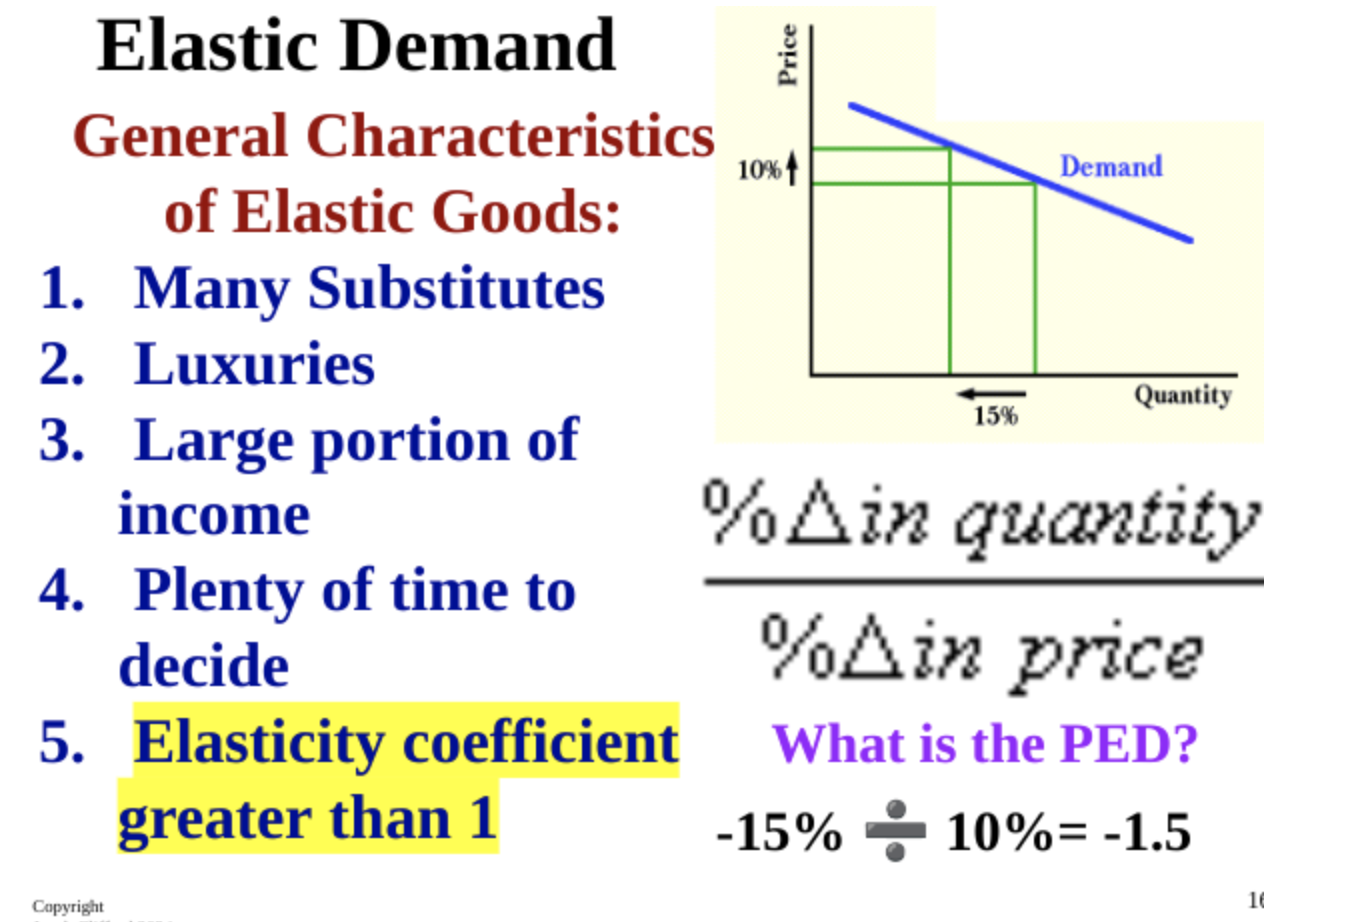
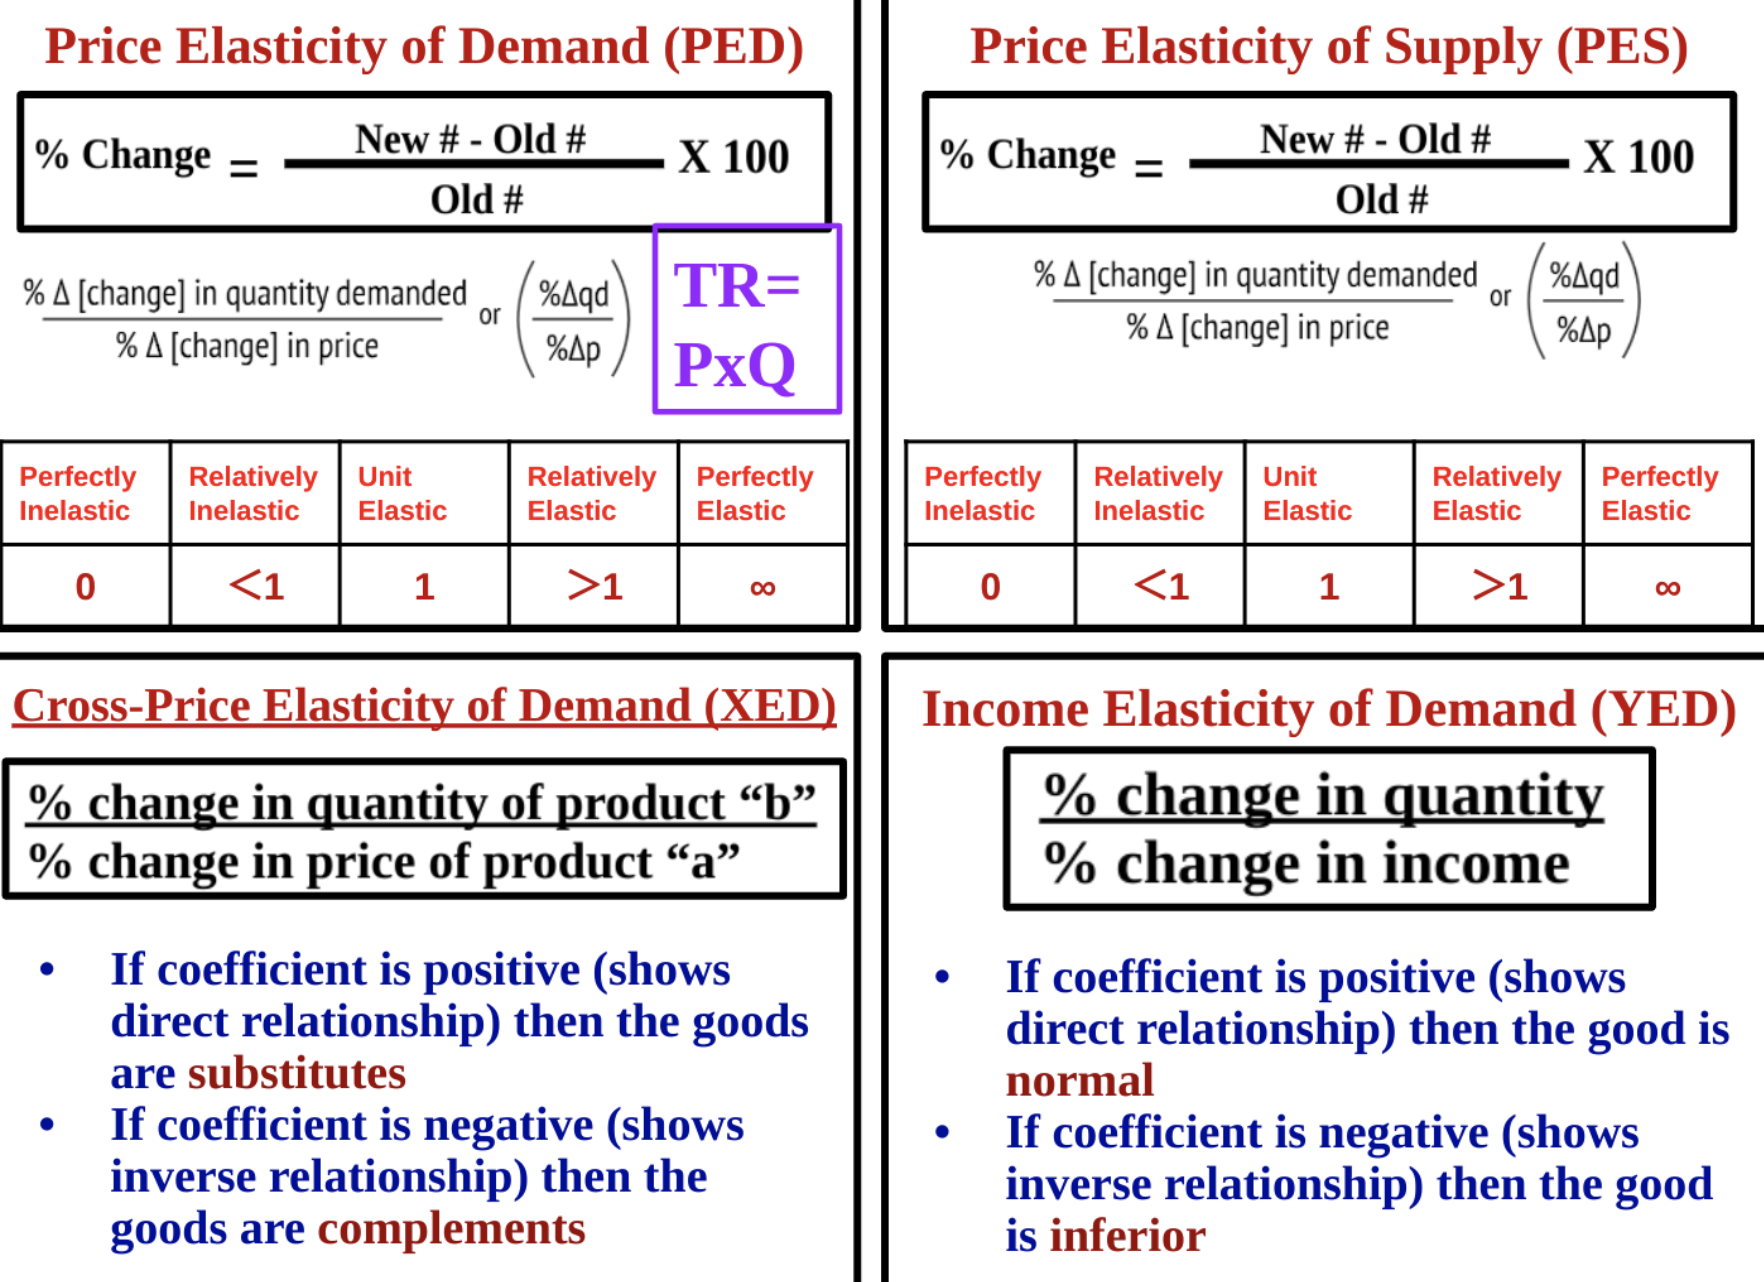
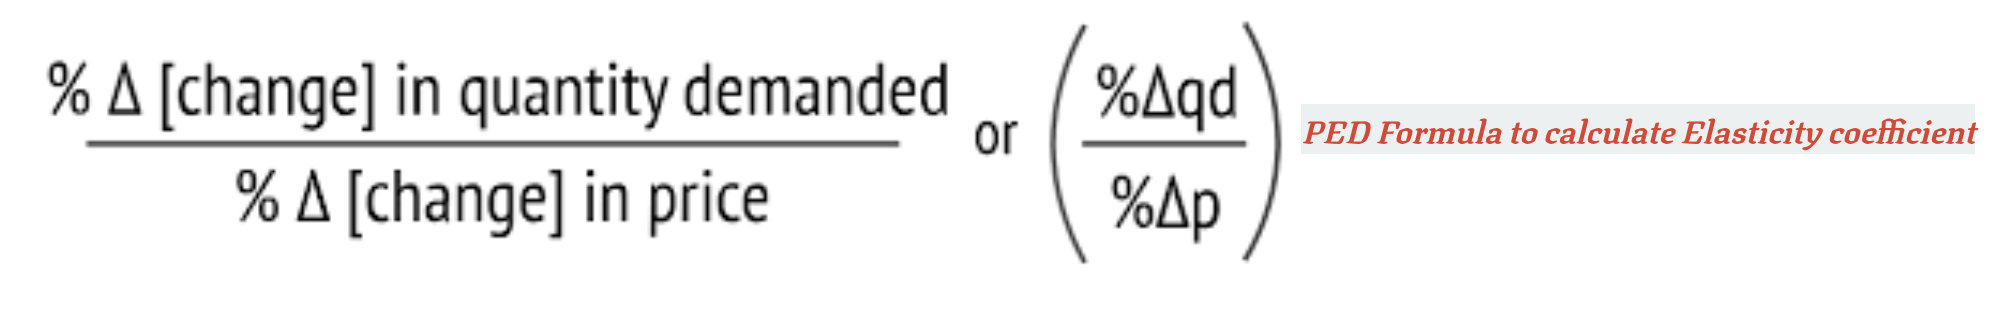
Price Elasticity of Demand
Knowing how much consumers will respond to a change in price is useful to firms
Why it matters:
Helps them decide what to charge and when, if ever, to have sales
Helps them determine substitutes in the market
Can be used by the government to decide when and how much to tax
(Absent Friday)

Total Revenue Test
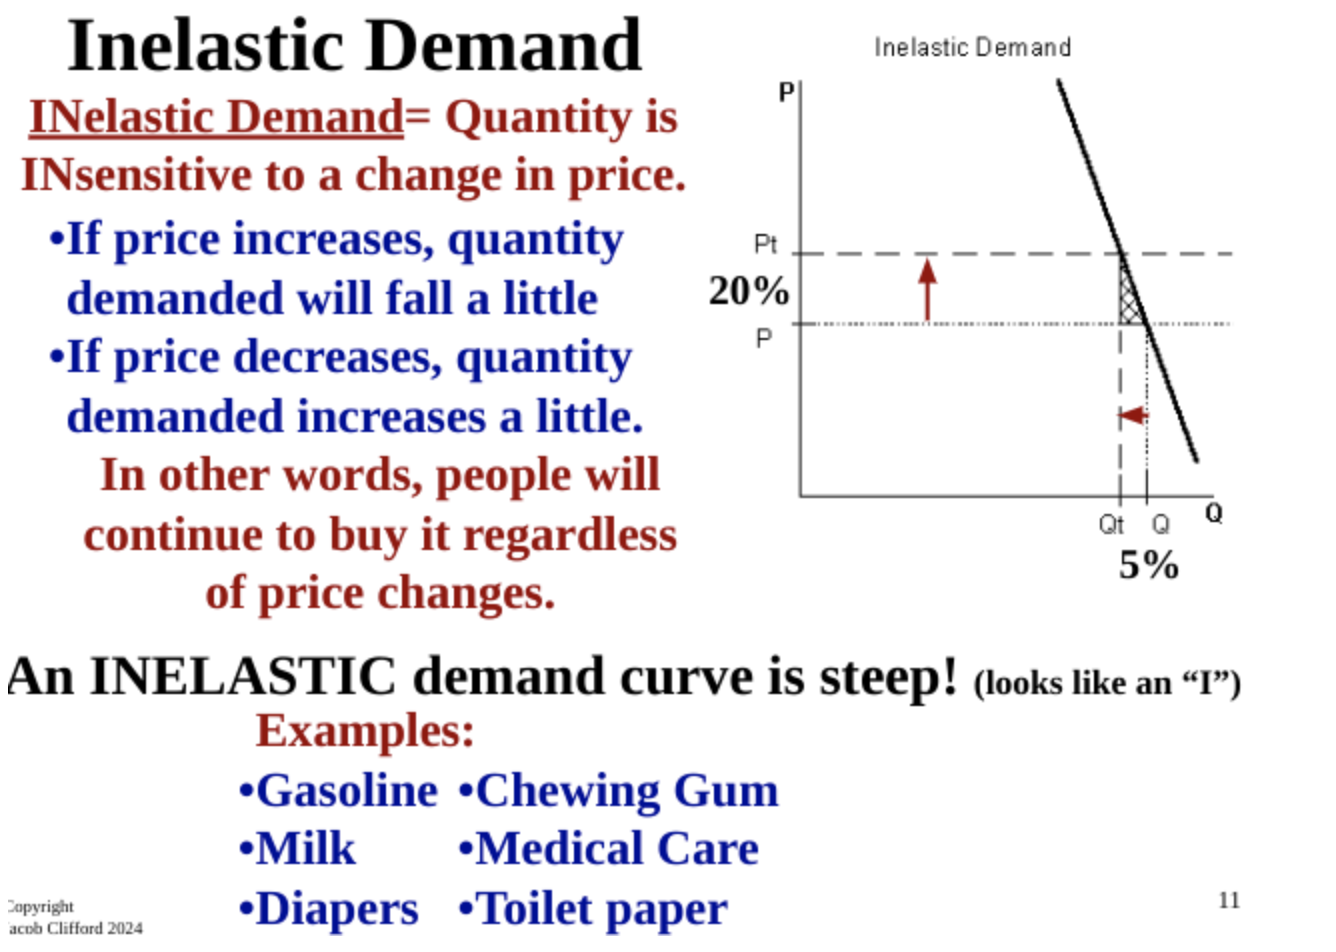
Inelastic
Price increase, causes total revenue to increase
Price decrease, causes total revenue to decrease
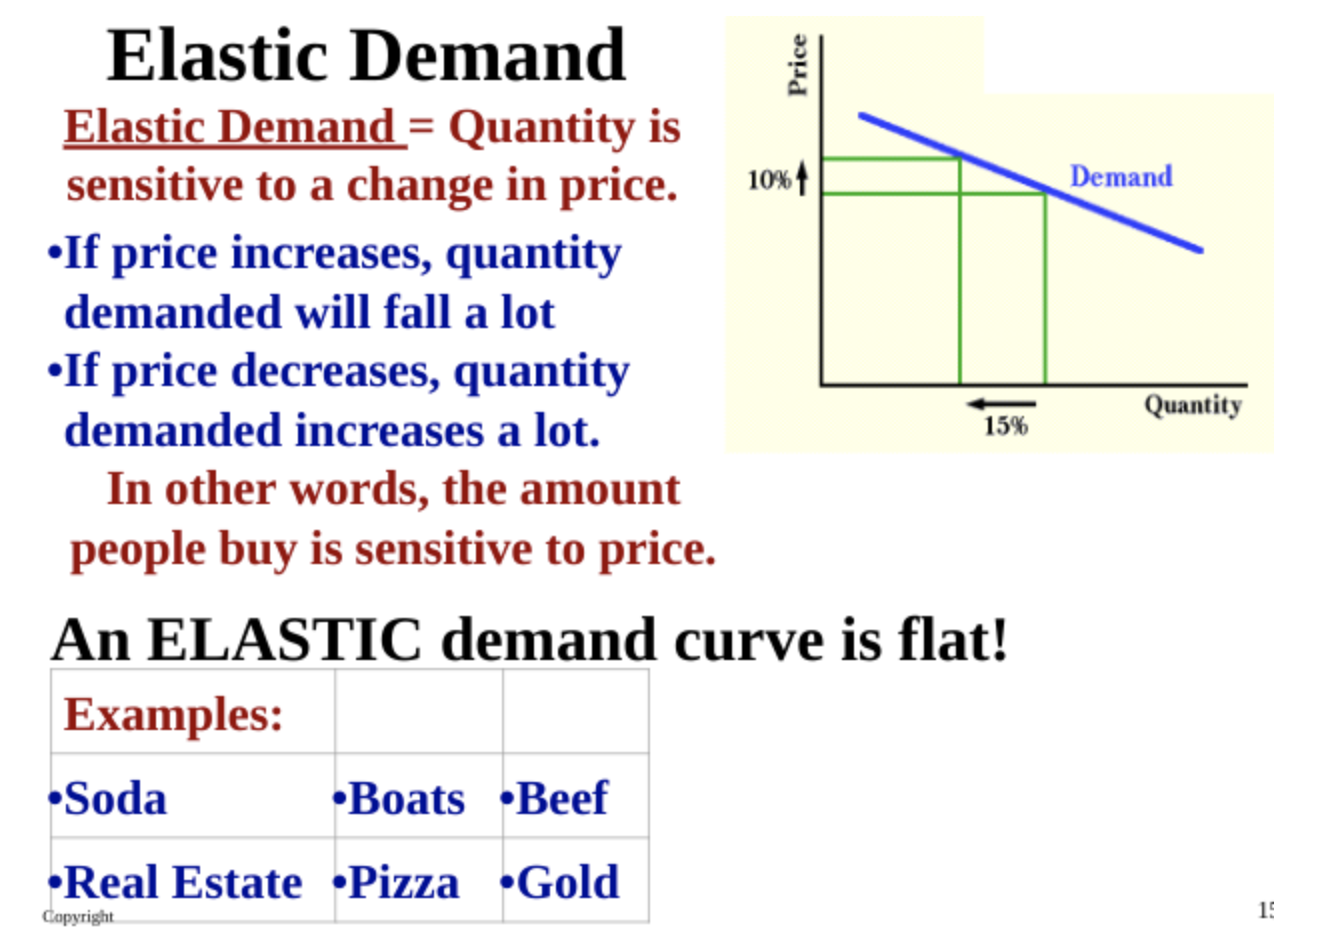
Elastic
Price increase, TR decrease
Price decrease, TR increase
Greater than 1 = elastic
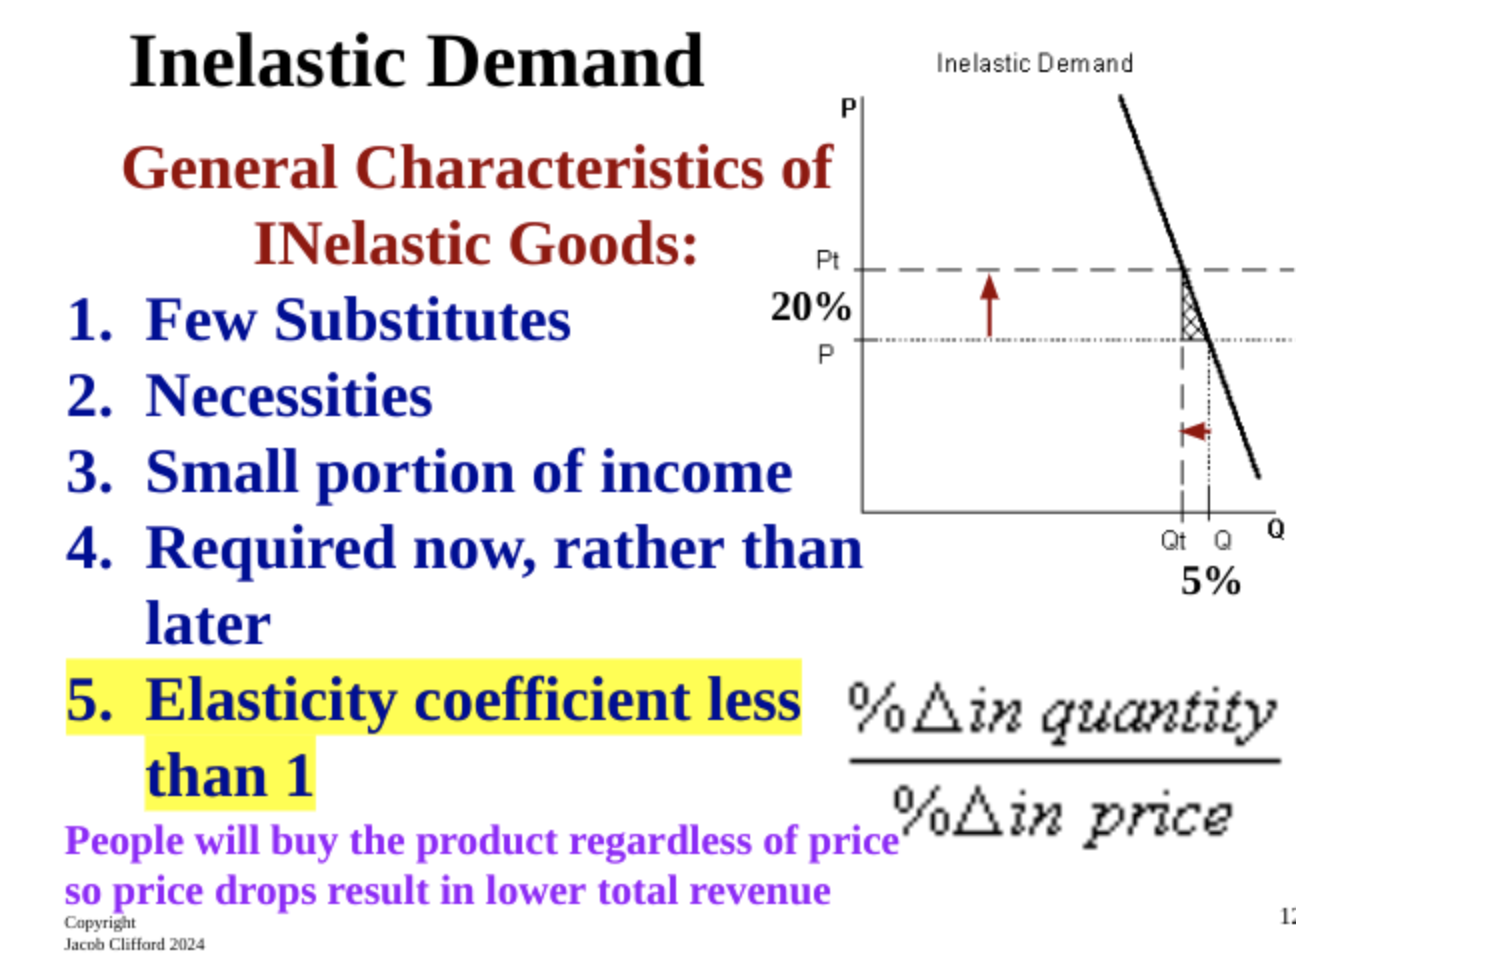
Less than 1 = inelastic
Equal to 1 = unitary elastic
Price Elasticity of Supply
Elasticity of supply shows how sensitive producers are to change in price.
In elastic - insensitive to a change in price
Elastic - sensitive to a change in price
2.6-2.7
Double Shifts
If two curves shift at the same time, either price or quantity will be indeterminate.
Deadweight loss
This refers to the loss of economic efficiency resulting from a market distortion, such as taxes, subsidies, or price controls, which prevent the market from reaching equilibrium. When these interventions are in place, the quantity of goods traded decreases, leading to a reduction in total welfare for both consumers and producers. In essence, deadweight loss represents the lost economic benefit that occurs when the optimal price and quantity are not achieved.
Consumer surplus
the difference between what you’re willingly to pay and what you pay
CS = buyer’s maximum - price
Producer Surplus
difference between the price the seller received and how much they’re willingly to sell it for
PS = Price - Seller’s minimum
2.8 The Effects of Government Intervention in Markets
Price floor - lowest price a product is allowed to be
Price ceiling - highest price a product is allowed to be
Excise Taxes
A per unit tax on producers
For every unit made, the producer must pay money, not a lump sum (one time only) tax.
The goal is form them to make less of the goods the government deems dangerous or unwanted
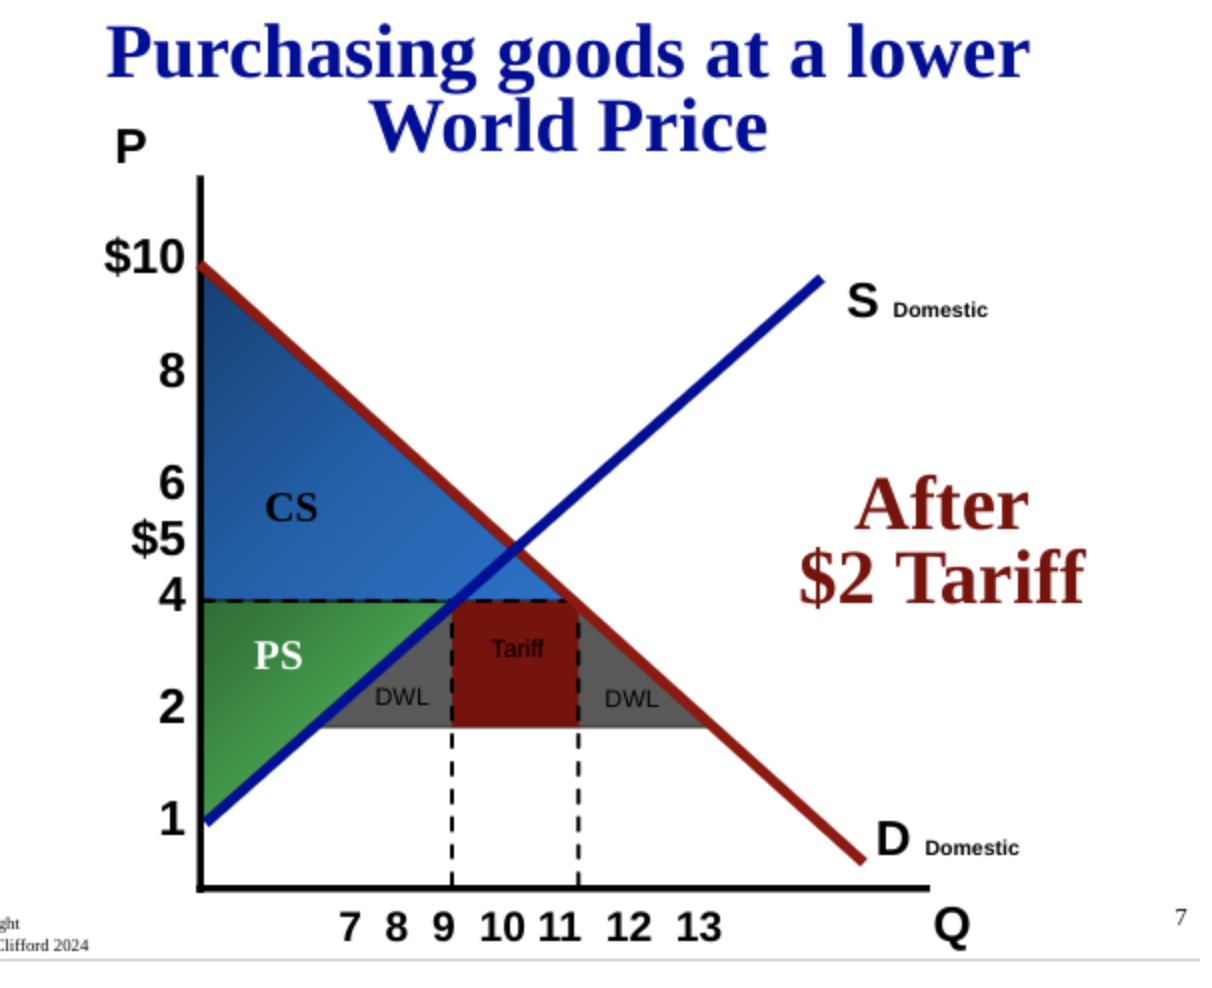
2.9 Tariffs
World Price - countries can buy products at their own domestic price or they can buy the products at a cheaper world price
Tariff - tax on imports that increases the world price
made to protect domestic producers from a cheaper world price
to prevent domestic producers from a cheaper world price
Quota - a limit on number of imports