ISD5 Lecture 4
Lecture FON
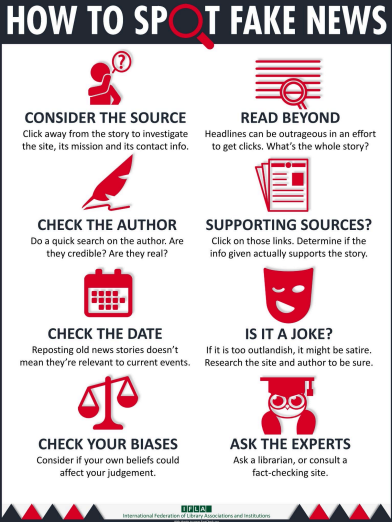
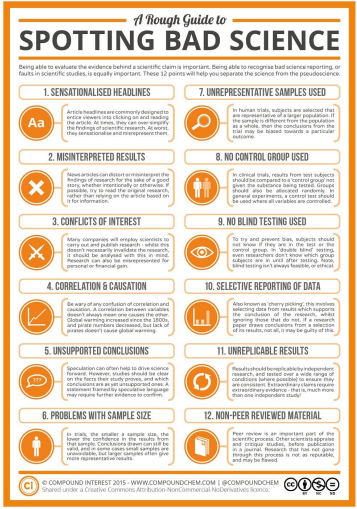
Why is Spotting Bad Science Important?
• Some of your patients believe what they read
• Others may have questions for you to clarify for them
• Part of the professional competencies of the job requires that you are able to spot the difference between information that is correct and that which is misleading.
• It’s even more difficult to spot fake news when actual medical professionals are producing it.
Andrew Wakefield and the MMR vaccine
• 1998 Published paper of 12 autistic children with a link between inflammatory bowel condition and the MMR vaccine. Purporting that MMR vaccine caused IBD which led to autism. The link was anecdotal with the parents saying autism developed after the vaccine.
• Media blitz followed with the study reaching international news.
• Wakefield suggested it was the triple Measles, mumps and rubella vaccine that was responsible and this should be split up into single vaccines instead.
• By 2005, MMR vaccine uptake fell by 81%
BUT
• Paper was fundamentally flawed.
• Media misinterpreted findings
• Wakefield did not mention that he had filed patent applications and started a business to manufacture and sell single vaccines.
• The conduct of the trial was extremely poor – he had no ethics in place, was highly selective about who to include
• He had even collected samples from children at a birthday party without ethical approval
• He was struck off the register by GMC
Why would bias be introduced into studies?
• Personal pressure
• We are all human and subject to unconscious bias
• Commercial pressure
• Industry needs to sell a product that has cost a lot to develop
• Institutional pressure
• Pressure to publish or perish
• Poor scientific approach
• Research conducted with untrained investigators or in unsuitable environments
Types of bias in research studies
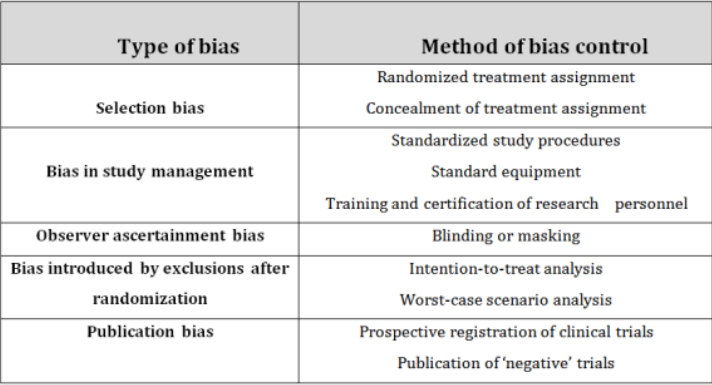
Selection Bias
• Different characteristics in the control group versus the treatment group
• Example – measuring the effectiveness of new tooth whitener against old brand. If the control group contained more smokers it may make the new product look more effective.
Or
• Characteristics of the sample group which are not the same as the true population
• Example – measuring the incidence of tooth decay in the population but only recruiting dental students
Bias in study management
• Comparing two methods of surgery on outcomes after third molar removal.
• Example- having several surgeons doing the procedures slightly differently.
• Need to standardize procedure or keep surgeons consistent.
Observer Bias
• If the observer knows which group patient is in either the control group or treatment group, they may unconsciously rate treatment progress in the treatment group as being better.
Bias introduced by exclusions after randomisation
Example - Removing patients who fail to follow-up from analysis.
Publication Bias
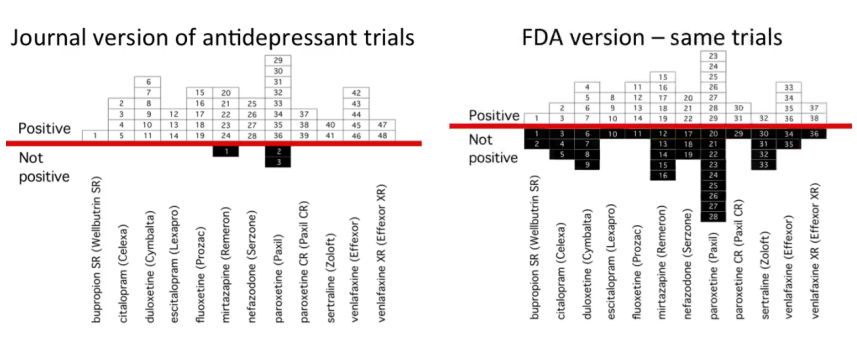
Think about how data is presented
Graph hacking
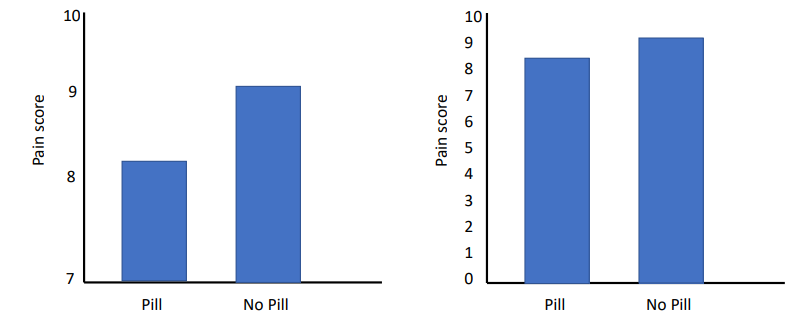
Is this even clinically significant?
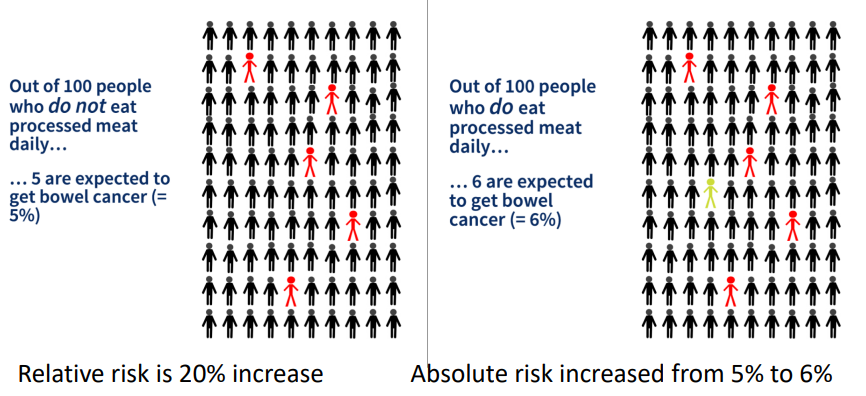
Relative vs Absolute risk
Eating processed meat makes you 20% more likely to develop bowel cancer. Relative risk increased by a fifth
Number needed to treat (NNT)
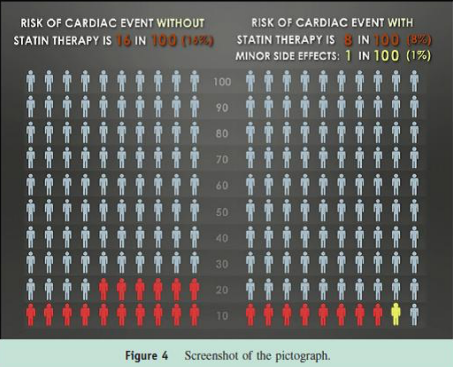
NNT = 100/8 = 12.5
Need to give 12 patients statins to reduce the risk for 1 extra person
NNH = 100
For every 100 patients given the drug 1 extra person develops diabetes
DM Lecture
Epidemiology
The study of the distribution and determinants of health-related outcomes in populations
Quantitative discipline
Measurement of disease/condition/risk factor frequency is central to epidemiology
Results = Many individual measurements made into an understandable story
Types of Data
Categorical
Case descriptor e.g. Disease / No Disease (binary yes / no)
Categories with no order: eye colour, marital status, sex
Ordinal
Categories with some ranking order
Likert scale (1-5)
Hotel star ratings
Continuous
Can be measured on a scale with units
Quantitative data – no cut-offs between values
Height, weight, blood pressure
Guess the Data Type
Self-rated health (poor/fair/good/very good/excellent)
Ethnicity
Caries experience (Y/N)
Serum cholesterol
Having lung cancer (Y/N)
HbA1C
DMFT
Discrete/count data – really ordinal but if >10, usually treated as continuous
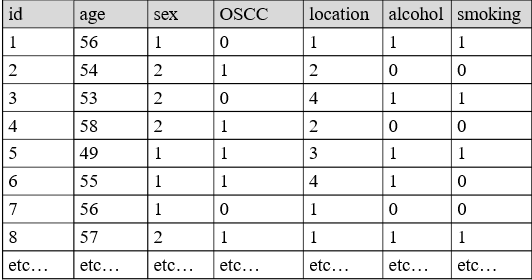
Structure of an epidemiological dataset
In a typical epidemiological study, a range of different information is collected on each participant.
A typical dataset then has:
Rows (normally each participant has one row)
Columns (normally each variable has one column)
Inspection of Data
It is crucial that you get familiar with your dataset before analysis:
Structure
Number of individuals
Number of variables
Types of variables
Range of values
Definitions of categories
Missing data
Outliers
Implausible values…………etc….
Example of a dataset of OSCC
But: What’s the story?
Making sense of the data to get results
Statistics
Descriptive
Inferential
Descriptive statistics
Methods of organizing, summarizing, and presenting data in a convenient and informative way
Graphical Techniques, and
Numerical Techniques
Summary information about your sample data, depending on its type:
Central tendency (mean, mode, median)
Variability (variance and standard deviation, IQR, min-max)
Frequency (counts within the dataset)
Descriptive statistics
Helps identify issues in the data (initial inspection)
Describes sample characteristics
Baseline table
Categorical / Ordinal:
Frequency and percentages
Ordinal:
Mode or median with range
Continuous:
Mean and SD if normally distributed
(Median and IQR if skewed)
Inferential statistics
Moving beyond your sample to make inferences about the broader population – **the definition of research**
Need to account for chance variation in samples - uses probability theory
Chance of errors is greater if the sample is smaller, or there is greater variability in the measure within your sample
But remember – probability theory assumes you have selected a random sample. No accounting for selection bias.
95% Confidence Intervals
Level of uncertainty around an estimate
What are the upper and lower estimates that contain the true value in the population, in 95% of repeated samples?
Dmft in five-year-olds 2022 England: 0.8 (95% C.I. 0.82 to 0.86)
Confidence intervals will be narrower (more precise) with larger samples
Assumes random sample – cannot compensate for poor study design
P-values
Likelihood that differences observed between the groups are due to sampling variation (chance)
P< 0.05 – Good evidence against the null hypothesis.
P< 0.01 – Strong evidence against the null hypothesis.
P< 0.001 – Very strong evidence against the null hypothesis.
A P-value of 0.05 means:
If the null hypothesis is true, you can expect differences between the groups that are as extreme or more extreme than those observed, 5 times out of 100 (just by chance).
Epidemiology
Descriptive:
‘’Describes’’ a health issue
Only 1 group studied
Look at risk factor (exposure) OR outcome
No advance hypothesis / null hypothesis
Hypothesis generating – early stage
Answers: How much, who, what when, where?
Analytical:
Used to understand causes and effects
At least two groups studied to compare
Look at risk factors (exposure) AND outcome
Advance hypothesis is being tested
Answers: Why / what causes?
Descriptive:
Measures of disease frequency in one group
Analytical:
Measures of effect: comparing 2 groups
Oral Cancer
Oral squamous cell carcinoma (OSCC)
Annual incidence of OSCC in 2020 was: 377,713 cases worldwide:
248,360 in Asia
65,279 in Europe
27,469 in North America
Which country has the highest risk?
Numerators and Denominators
The number of cancer cases in the UK is 247,667 whereas in Belgium it is 47,948.
The UK has a bigger problem in numerical terms.
But do Belgians have a lower risk of getting cancer?
Numerators alone are meaningless
We need both numerators AND denominators
UK: 247 667 / 60,000,000 = 0.00413 =
Annual incidence of 413 per 100,000
Belgium: 47948 / 10,000,000 = 0.00479 =
Annual incidence of 479 per 100,000
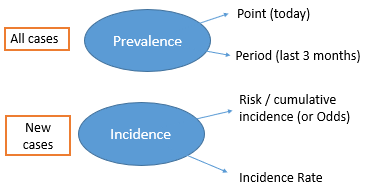
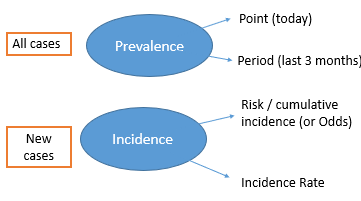
Describing disease frequency
Prevalence
Incidence: Risk (or Odds)
Incidence: Rate
Prevalence
Total number of cases at a defined time point (or period). Common in cross-sectional surveys
Usually reported as a percentage: the proportion of people who have the disease out of 100:
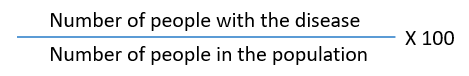
E.g. Prevalence of toothache in previous 3-months in 12-year-olds in England: 19% (CDHS 2013)
Risk / Cumulative Incidence
‘Risk’ or probability of developing the disease over a given time period
Must give a specific time frame (e.g. 2-year risk, 5-year risk, etc)
E.g. One year incidence of head and neck cancer is 11.7 / 100,000 in females and 28.9 / 100,000 in males in the UK
Generally measured in prospective, longitudinal studies (cohort)
More weight is given to longer follow-up periods
Prevalence Vs Incidence
Prevalence is affected by the number of new cases and the time between onset and recovery, or death.
Prevalence = Incidence x Average disease duration
Odds
Risk / cumulative incidence cannot be measured in case-control studies - Because the total population at risk is not known
Odds of disease is another measure of the probability of developing the disease that can be used
Must give a specific time frame (e.g. 2-year odds, 5-year odds, etc)
Incidence Rate
Measures how quickly the outcome is occurring
The numerator is the same as in ‘risk’ but the denominator includes a measure of follow-up time
Must specify time units, e.g. per 1 person year, per 1000-person-years
Person-time denominator: an estimate of the total time-at-risk contributed by all persons in the study, before they developed the outcome
Allows for different follow-up lengths
Common Inferential Statistics
Epidemiology
Descriptive:
Measures of disease frequency in one group
Analytical:
Measures of effect: Comparing 2 groups
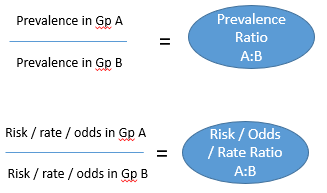
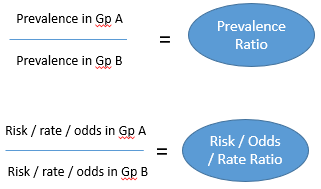
Analysing the strength of effect/association
Compare prevalence/risk/rate/odds in Group A (e.g. smokers) compared to Group B (e.g. non-smokers)
Looking for associations between risk or protective factors and disease (aetiology)
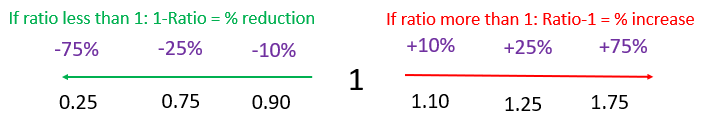
Ratios: How many times more disease is found in one group compared to another (can also be ‘times less’ if protective factor)
Ratios
RR = Risk Ratio
IRR = Incidence Rate Ratio
OR = Odds Ratio
Analysing effect/association
Risk of mortality and occupational grade over 30 years: Whitehall cohort study
Risk in Low Grade = 118/554 = 0.21
Risk in High Grade = 296/2598 = 0.11
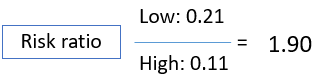
‘’Risk of dying in low-grade civil servants is 1.90 times the risk in high-grade civil servants (risk is 90% higher)’’
Interpreting ratios of effect
A risk/odds/rate ratio of 1 = No difference between the groups
A protective factor may be presented as having a ratio of less than 1 (e.g. 0.67 times the risk/odds/rate).
NB is not correct to say ‘times less risk/odds/rate.’
Ratios further away from 1 indicate larger effects/associations
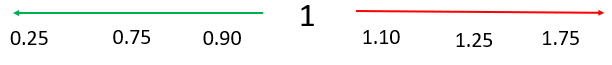
Can interpret ratios as a percentage of increased or decreased Risk / Odds / Rate
ORs will seem more extreme than Risk or Rate Ratios (i.e. further away from 1)
“Statistics must have a clearly defined purpose, one aspect of which is scientific advance and the other, human welfare and national development”
Remember – clinical significance not just statistical
Qualitative and Mixed Methods Research
WHAT IS QUALITATIVE RESEARCH?
• Qualitative methodology is used to understand people's beliefs, experiences, attitudes, behaviour, and interactions.
• It is a research method that generates non-numerical data.
Research Paradigms
Realism: The world is real, science can examine it, there is a single truth, facts exist and can be revealed.
Relativism: scientific laws are created by people to fit their view of reality, many truths, and facts depend on the observer's viewpoint
Nominalism: Reality is entirely created by people, there is no external truth, facts are all human creations
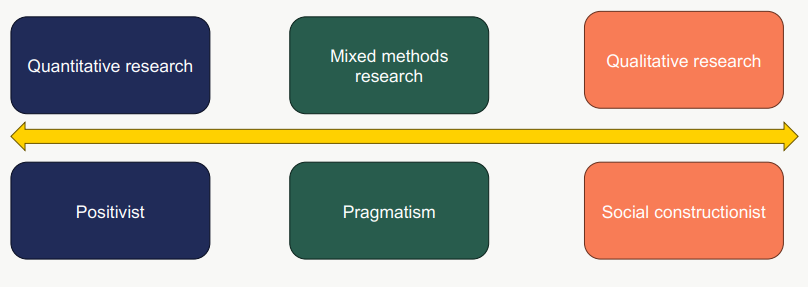
Research Paradigms Epistemology
Positivism: Objective methods, observations.
Pragmatism: knowledge is based on experience
Social constructionists: acknowledge the social nature of human life. Focus is feelings, beliefs and thoughts
Research Paradigms – Impact on Research
When to Use Qualitative Methods
Aim of the study/research question
Underlying philosophical stance of the research
Preference
Skillset
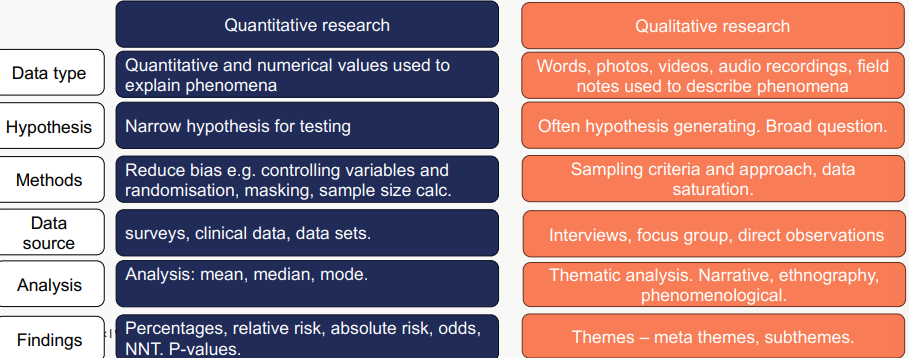
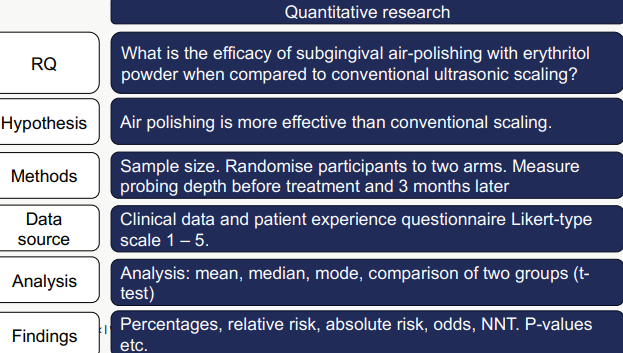
Research Quan vs Qual
Approaches to Sampling Participants
- Guided by research question
- Phenomenon of interest
- Data saturation/sufficient richness
- Is the sample size realistic?
- Time constraints/financial constraints
Approaches to Sampling Participants
Convenience – based on availability
Purposive – most informative
Snowballing – referral from other participants
Theoretical – no a priori sample size. Theory generating
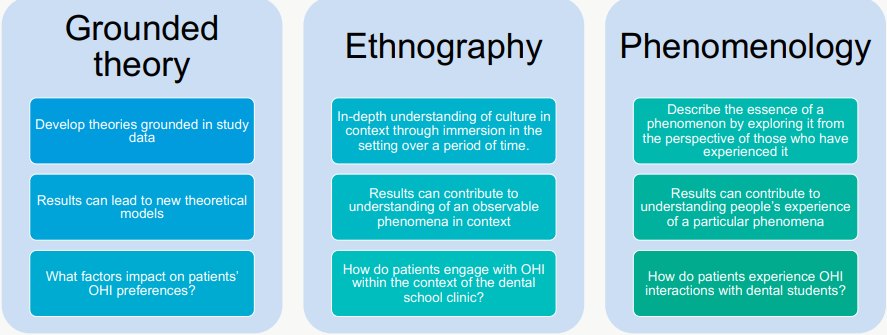
Choosing your Qualitative Method(s)
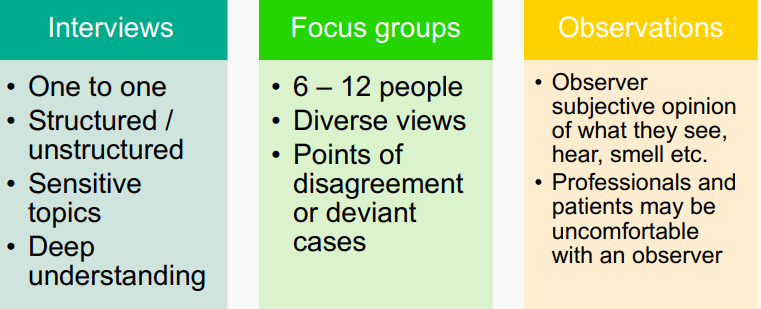
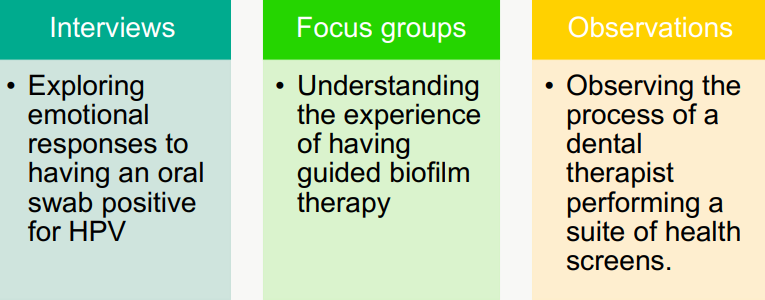
Different Types of Qualitative Research
Research Quan vs Qual Research
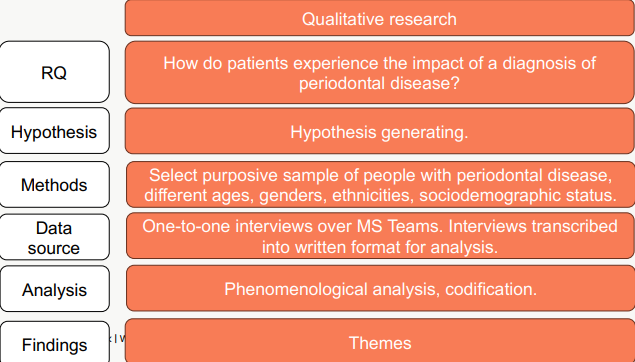
Qualitative Data - PATIENT EXPERIENCES
Case 1: It has just affected my self-confidence really and how I feel about myself. I was a pretty confident lad you know before that but it has affected my confidence in a big way’
Case 2: Other people always complimented me on my winning smile, and my teeth are part of it. I can run off and hide in the woods, but my teeth are a personal matter. Yes, they are part of what makes up my personality, they are a part of me…The first thing I worried about was what it was going to cost. I wasn't sure whether I was prepared to sell my flat to rescue my teeth in my appearance. I would have done it if it had been necessary, rather than being toothless. It's that important.
Qualitative Outcomes – THEMES
ANALYSING QUAL DATA - CODING PROCESS
Not just labelling; it is linking of data to the research idea and back to other data. Organises data so you can examine and analyse them in a structured way
Coding
• “How you define what the data you are analysing are about” (Gibbs, 2007) A process of identifying a passage in the text or other data items, searching and identifying concepts and finding relations between them.
Inductive coding
• No preconceived ideas / not sure what you’re looking for
• Allows theory to emerge from the raw data
Deductive coding
• Provisional list of codes based on research question, framework or key variables.
QUALITATIVE OUTCOMES – THEMES
Traditional approach
CAQDAS
Qualitative Analysis – Codification
Case 1:
OH = self confidence
Change in feelings about self
=Grieving former self
Case 2:
Social validation/reward
Good smile = pride
Isolate self
Teeth = identity
Weighing up the value of oral health against Tx cost
High value of visible oral health
= Status loss
= Efforts to preserve the sense of self
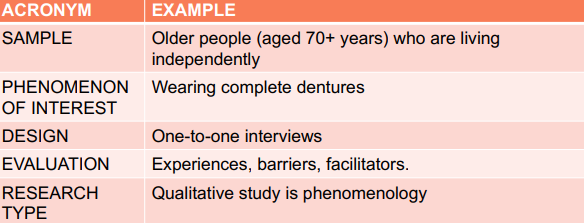
QUALITATIVE (OR MIXED METHODS) – Systematic Reviews
Sample
Phenomenon of
Interest
Design
Evaluation
Research type
QUALITATIVE – Systematic Review
How do independent older people who wear complete dentures experience and maintain their oral health?
Issues with Qual Research
- Subjectivity – interpretation of data
- Sample size and data saturation vs richness of data. Ethical issues.
- Issues of generalisability - Influence of researcher (positionality)
- Impacts of choosing the “wrong” method
- Researcher safety
- Systematic reviews – subjective lens applied to subjective interpretation of published data.
POSITIONALITY - RESEARCHERS ARE NOT NEUTRAL!
Characteristics
Power dynamic
Topic
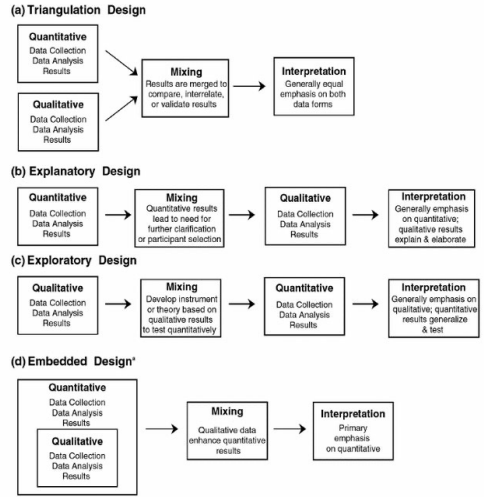
WHAT IS MIXED METHODS RESEARCH?
“The overall purpose and central premise of mixed methods studies is that the use of quantitative and qualitative approaches in combination provides a better understanding of research problems and complex phenomena than either approach alone.” i.e. BEST OF BOTH
MIXED METHODS – When and How do we “mix”?
• At least one point of integration in a mixed methods study
- Emphasis:
- QUAL> quan / QUAN>qual / QUAN=QUAL
- Mixing data can be used to
o Compare: QUAN and QUAL
o Sequence: QUAL can explain QUAN finding
o QUAN can be used to generalise QUAL findings to a larger population
o QUAL can be used to design a QUAN instrument
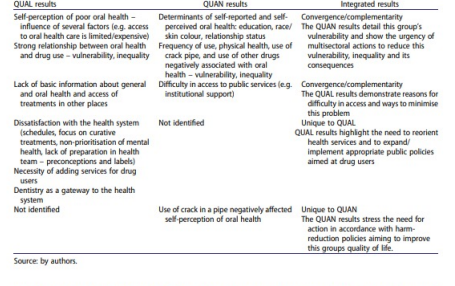
Mixed Methods Study – An Example
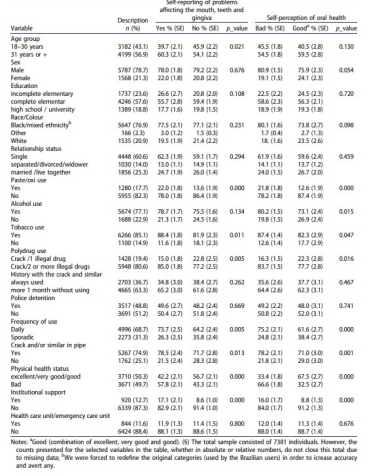
“This study aims to describe the associated factors and perceptions of oral health among crack users in Brazil, using a mixed-method approach that allows a broader view of the problem, triangulating findings from a large survey of open drug scenes and a qualitative study”
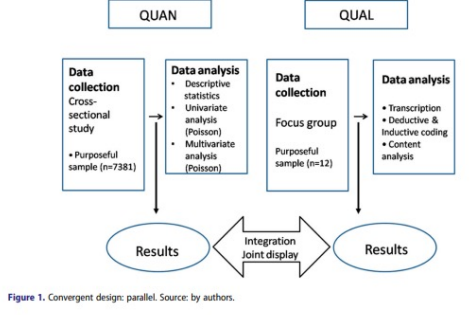
Qualitative themes
Definition of oral health/disease
“With age, especially for a man, two things are embarrassing to us, hair and teeth … Think how when you are a child, everything is new, right? So, we lose our teeth, it’s natural.”
Qualitative themes
1. Definition of oral health/disease
2. Relationship between drug use and oral health
“I think that drugs and tobacco are bad for the teeth, but what is worse is people’s self-neglect when using … if the drugs did not weaken us so much, our oral health would be good - not good, but it would be a little better. But what is destructive is personal self-neglect”
3. Access to health services
“… I would like to give my opinion because I think the public services are very unreliable … You get there, and if you are not in pain, you will not be helped.”
4. Health professionals
“There are health professionals who have preconceptions. They do not know how to deal with people. They think we are shameless!”