The Production Possibilities Frontier (PPF) Model
Explain PPF model
describe meaning of productive effieicency
explain how PPF illustrate opportunity cost
calculate opportunity cost from production possibilities diagram or data
describe factors that could lead to a shift of the PPF
describe importance of economics sustainability
Models in economics
model: simplified description of the real world
used to understand & predict relationship between variables
used to estimate what will happen to 1 thing when we change another thing
economic model: verbal desc, numerical table, graph, maths equation to describe what’s expected to happen in reality
Why aren’t models perfect reflections of reality?
Econs is social science involving humans & behaviors
models can never be perfect
can’t predict how humans will react to changes in lives
models help estimate
usually have assumptions
must make assumptions to simplify model since real life → too complicated
Example:
analyzing production production possibilities for firm using Production Possibilities Frontier (PPF) model
assume only 2 possible products to produce → on x-axis & y-axis
for firm that can produce more: harder to map possibilities (need >2 axis)
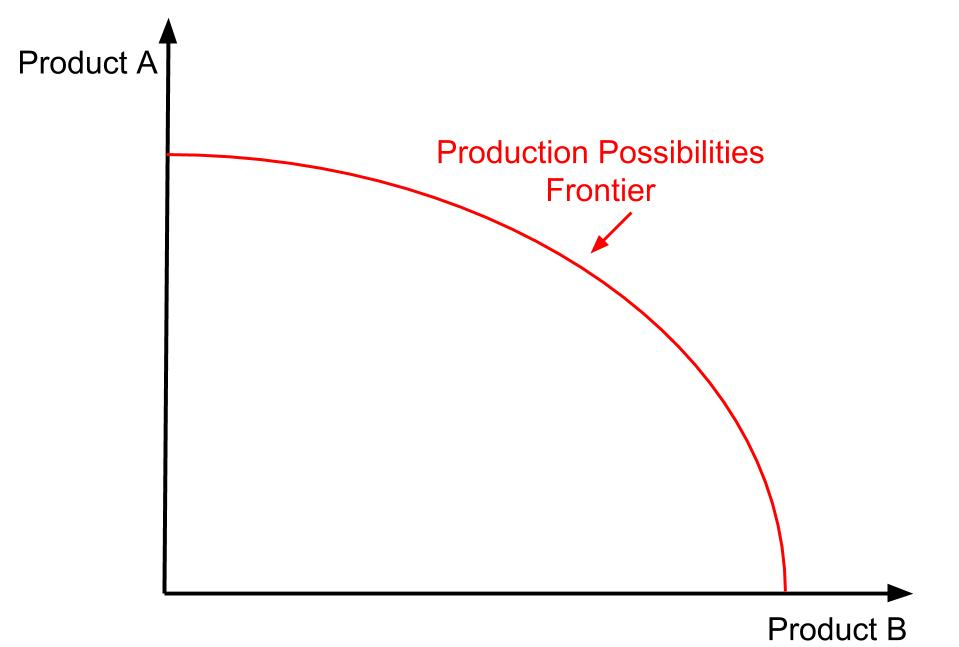
PPF model
definition: a curve depicting all maximum output possibilities for 2 products
fixed quantity of available resources & technology
product possibilities frontier: economic model showing relative scarcity, choice, opportunity cost
resources limited, W&N unlimited
The PPF assumptions are as follows:
maximum combinations of two products that can be produced,
assuming a fixed level of resources is available and
Assuming technology remains constant.
(Note: A further assumption is that there are only two options for products that can be produced.)
What does 'ceteris paribus' mean when learning about the PPF Model (see more below about ceteris paribus)?
What does 'ceteris paribus' mean?
Latin phrase meaning "all other things remain unchanged."
only variable changed
Essential in Economics for predicting effects of a variable change.
Requires changing only one variable at a time when analyzing models.
Examples:
What happens to banana price with decreased market supply, ceteris paribus?
What happens to quantity demanded of Product A with a price decrease in substitute Product B, ceteris paribus?
Economic models assume only one variable changes at a time to allow for reasonable predictions, as multiple variables often change simultaneously in reality.
Example 1
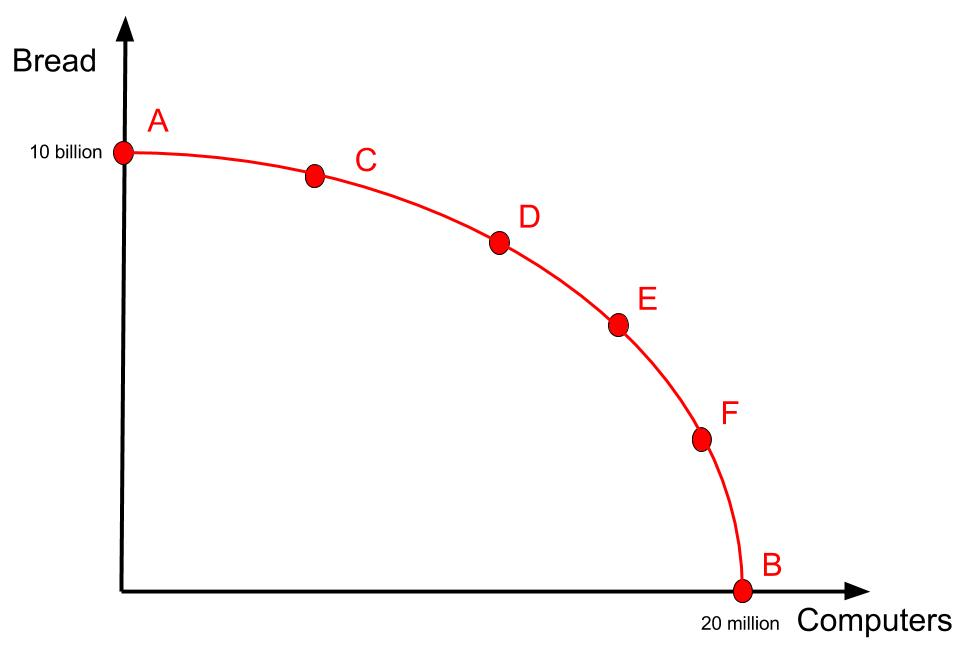
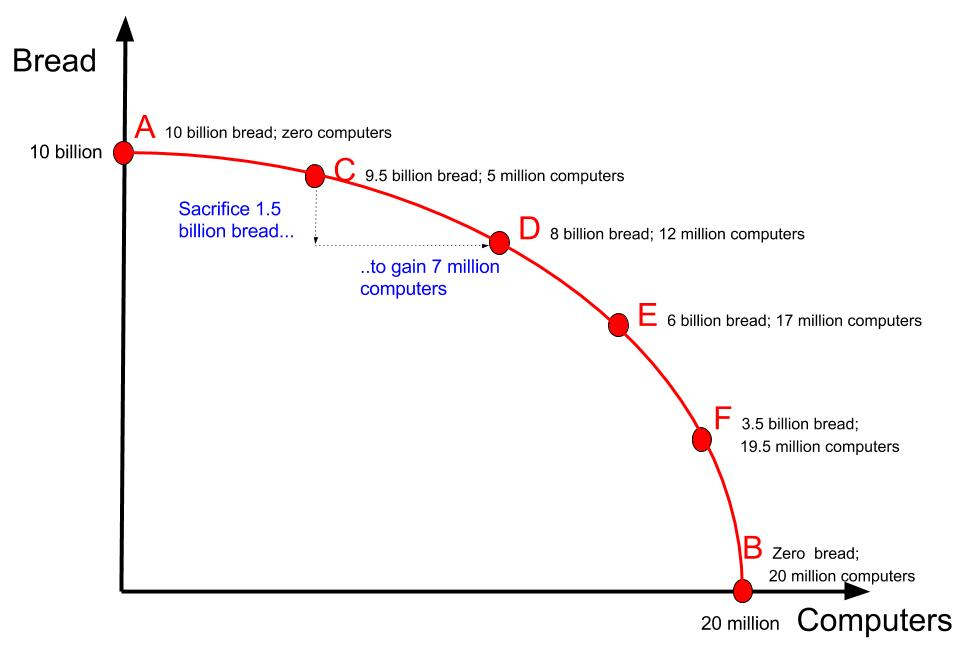
Figure 1 illustrates production possibilities using computers (x-axis) and bread (y-axis).
Point A: If all resources are allocated to bread, 10 billion loaves can be produced with zero computers.
Point B: If all resources are allocated to computers, 20 million computers can be produced with zero loaves of bread.
The firm can also produce various combinations in between these extremes, such as:
19.5 million computers and 3.5 billion loaves of bread.
5 million computers and 9.5 billion loaves of bread.
The PPF curve displays all maximum possible combinations of bread and computers that can be produced with the firm's limited resources.
All points on the PPF curve represent possible and achievable production options for the firm.
What do the points on the PPF represent?
All points on the PPF are considered to be productively efficient.
must be productive effieicency due to relative scarcity and to fufill max wants & needs
resources fully utilised
They represent the maximum output from the available level of input.
So, is it possible to produce 8 billion loaves of bread and 17 million computers? NO
Points outside the boundary are considered impossible to attain.
The firm doesn't have enough resources to produce combinations beyond the PPF, as shown by Point G on Fig 3
All points outside (beyond) the PPF are considered unattainable/impossible.
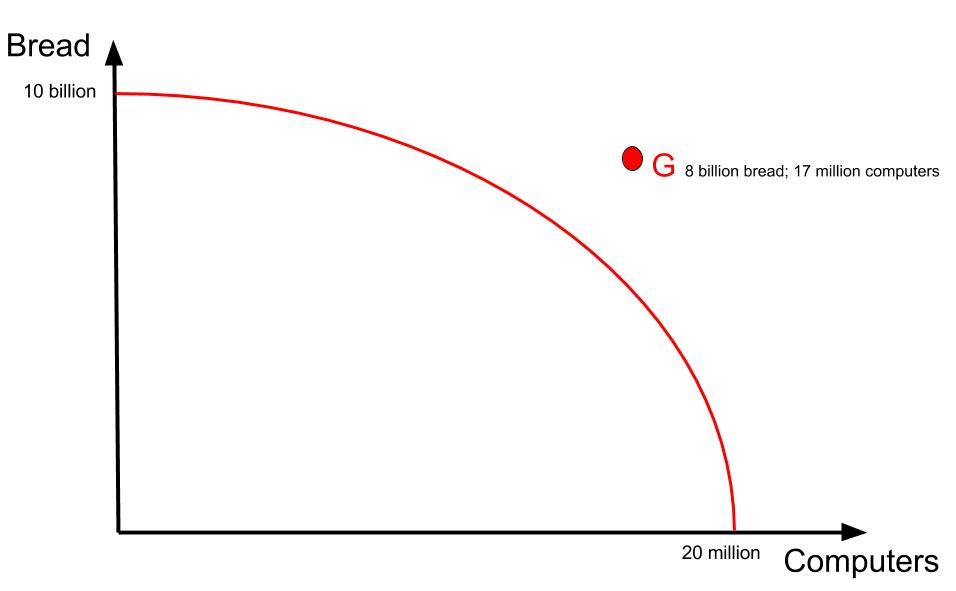
Point G would be considered unattainable/impossible.
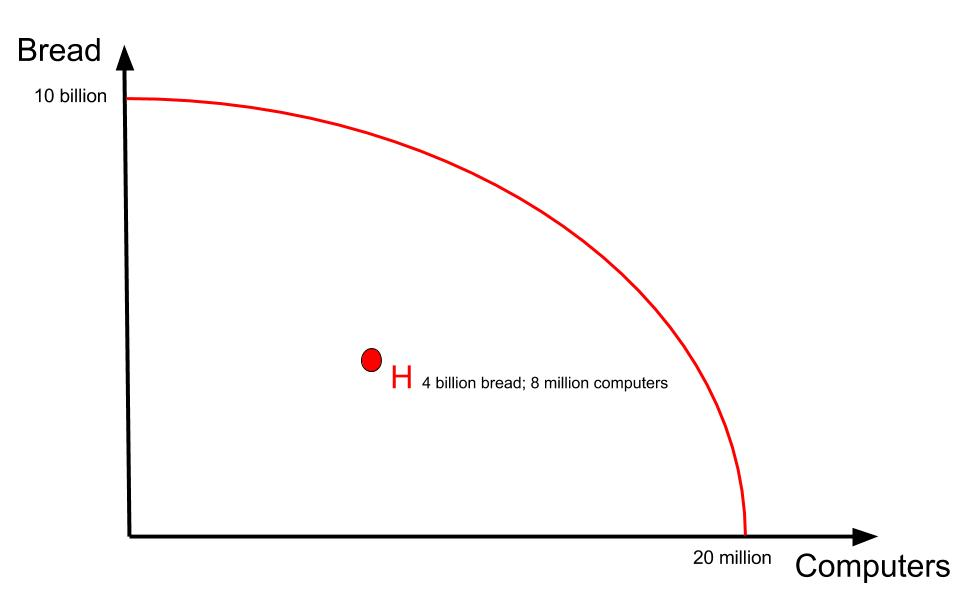
Is it possible for this firm to produce 8 million computers and 4 billion loaves of bread? YES
because there are enough resources to achieve this.
would be considered an inefficient level of production because not all resources are being used fully.
If firm is producing at a point inside the boundary, assume some resources are not being used to their full potential for production.
How can the PPF diagram be used to show opportunity cost?
The PPF diagram can be used to revise your understanding of opportunity cost.
opportunity cost is the value of the next best alternative lost when making decisions.
e.g. Fig 5, if AustBus is producing 9.5 billion bread & 5 million computers
(point C)- chooses to produce 8 billion bread & 12 million computers
(point D), the firm will gain 7 million computers.
Still, it will lose 1.5 billion loaves of bread. Therefore, the opportunity cost of those additional 7 million computers is 1.5 billion loaves of bread.
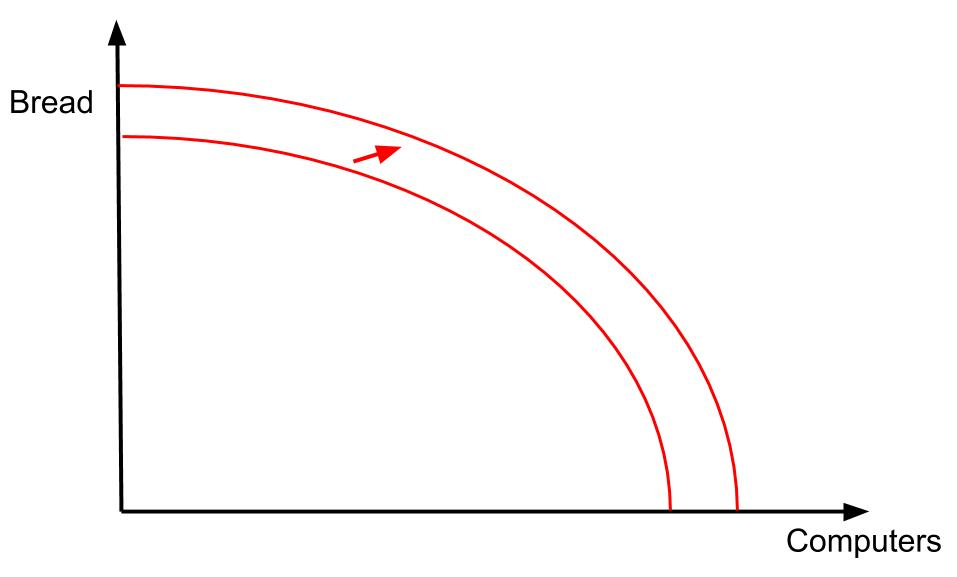
Shifting of PPF
shifting outwards
increase in quantity of resources
increase in natural resources
e.g. new oil reserves found offshore
increase num of workers (e.g. through immigration
more capital goods available (e.g. increase in the number of factories available)
improvement in quality of resources
level of education, training increases leading to more productive labour
invention of better capital resources
more efficient use of existing resources
methods/process
shift outwards = firm producing more products than before
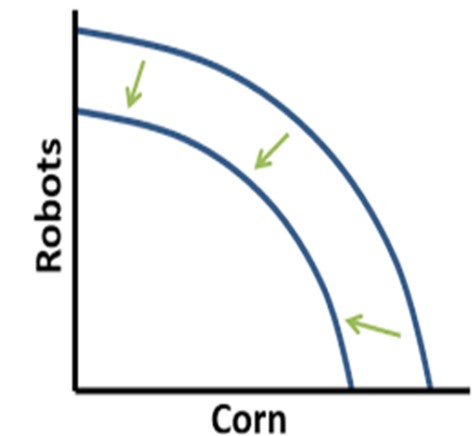
shifting inwards
decrease in quantity resources
decrease in natural resources (e.g. depletion of oil reserves)
decrease in number of workers (e.g. through emigration)
fewer capital goods available (e.g. decrease in num of factories available)
decline in quality of resources
Inefficient use of existing resources (for example, poor technology or lack of education )
Economic sustainability
ability to use existing resources in the best possible way in order to support existing/optimal levels of production in the long term
Why: improve current standard of living w/o sacrificing future generations’ standard of living
e.g. environment & natural resources
to ensure availability for future generations
limits logging (deforestation)
future economic activity & pop growth
sufficient education for current gen for continued access to variety of products in future