Evolutionary Biology Term Test 2
Lectures 9-16, Chapters 6-10, Weeks 5-8.
Table of Contents
Population Genetics (Ch. 6, lecture 9 & 10)
Quantitative genetics (Ch. 7, lecture 11 & 12)
History in our Genes/Evo-Deco (Ch. 8/9, lecture 13 & 14)
Natural Selection (Ch. 10, lecture 15 & 16)
Population Genetics
AChE1 (acetylcholinesterase): an enzyme being inhibited in France, esterase breaks down a wide range of toxins, including organophosphate insecticides. A high level will kill them. Ester allele thus gets passed down to offspring, and there was a shift of organisms with shorter lifespans.
Higher fitness in coastal areas (insecticide use), and carrying Ester1 inland proved detrimental, escaping spider predators. Ester4 has less protection against insecticides, mitigates fitness consequences.
Natural selection: increases frequency of alleles that contribute to reproductive success in a particular environment - only natural selection produces adaptation. There is a variation in the phenotypes of individuals in a population, this variation causes some individuals to perform better than others (survival, reproductions).
Genetic drift: the change in frequency of an existing gene variant in the population due to random chance
Gene flow: individuals leave one population, join another, & breed
Migration: moving and bring alleles into a new area, changing the genetic frequency
Population: groups of interacting and potentially interbreeding individuals of a species. Made up of individuals who carry alleles, typically varying from individual to individual.
Population genetics: study of allele distributions and frequencies
Individual genotype: contains alleles for millions of genetic loci carried in its chromosome.
Genetic locus: use the term genotype to refer to the combination of alleles carried by an individual at a particular genetic locus
We have created an extension of Mendel’s model towards analyzing population genetics.
As long as parents mated with each other randomly, gametes would mix predictably.
Mendel: mating consequences of two individuals with certain genotype.
Changing over Time
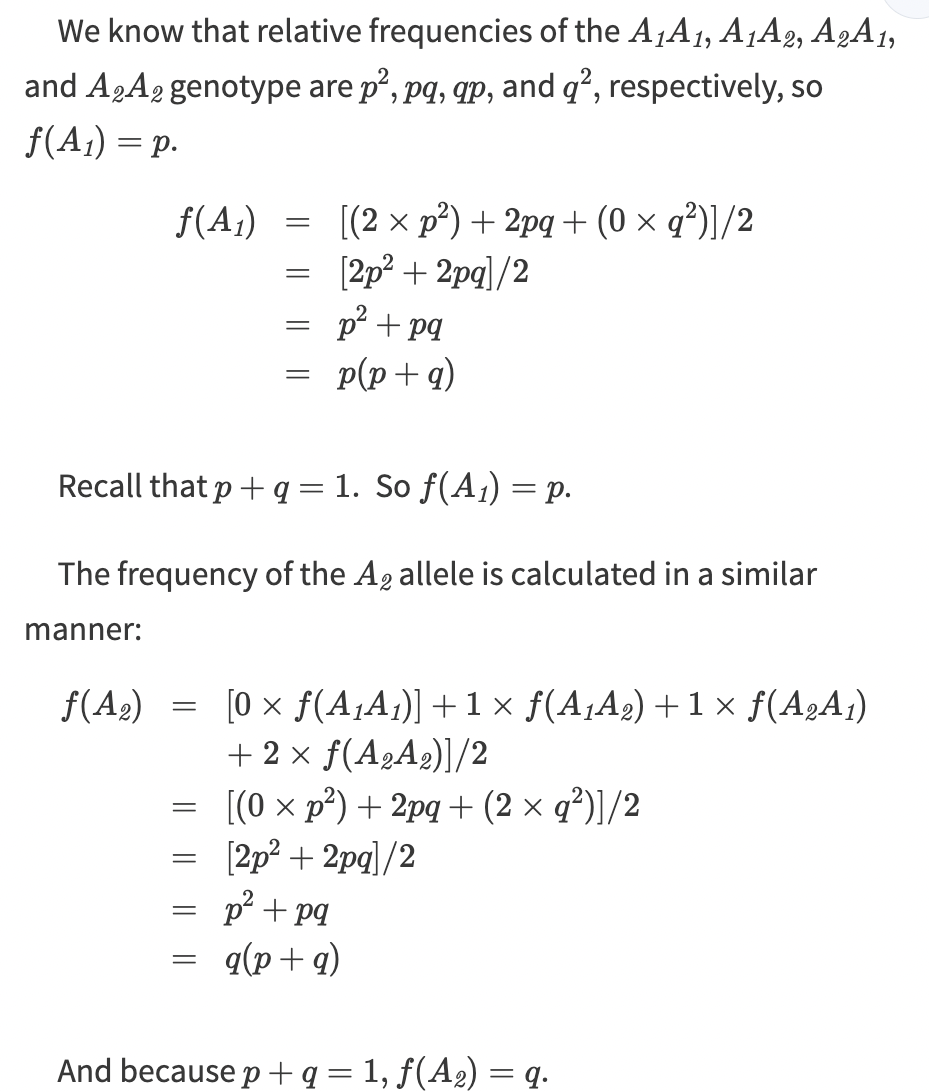
1 = p² + 2pq + q² —> prediction of new genotypes
1 = p + q —> prediction of old genotypes
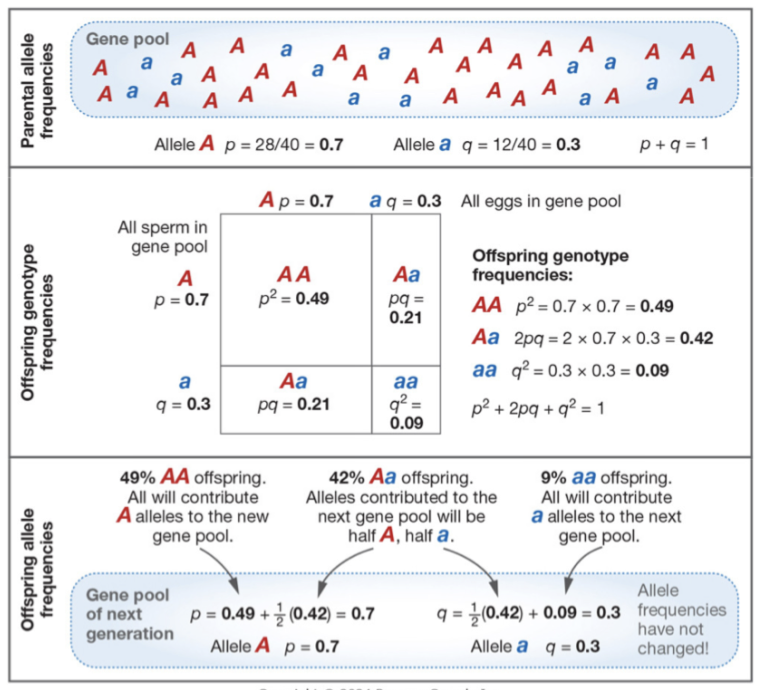
Assumptions of the Hardy-Weinberg Principle
Population is infinitely large
All of the genotypes at a locus are equally likely to survive and reproduce
No alleles enter or leave due to migration, genetic drift, bottleneck, none of it.
Organisms are diploid
No overlapping generations
No mutations
Evolution Null Hypothesis
Evolution will not occur in the absence of selection, drift and mutation. Theorem serves as a useful null hypothesis. It can tell us about the state of evolution and what may cause it. We can thus assume when HW principle is violated, we know at least one of the assumptions is being violated.
With no change and flow, we can use H-W and have it follow the null hypothesis
Random sampling
If flies were infinitely large, there would have been no change at all. When there was no selection, it was correct. We see heterozygosity skew completely to the far ends of the graph.
Genetic drift: How alleles frequencies “drift” randomly away from starting value. Has eliminated alleles in small populations. Pulling only a few things does not represent a sample, and can greatly affect the population makeup. Causes allele frequencies to randomly change.
A type of sampling error.
After the generations keep going, we start to see some movement. you may have a normal population, and then end up moving in two different directions. Purely due to chance they lost the white allele or red allele completely.
Small populations experience strong drift, some becoming fixed. Drift is in every population. Can interfere with process of natural selection.
Fixed alleles: you lose diversity in alleles and can only pass down one type of allele. Small populations see huge changes in frequency over time, alleles become fixed or lost quickly.
Bottleneck and Founder Effects
Genetic bottlenecks: affect populations that are only temporarily reduced to low numbers.
Probability of an allele being lost each generation is a function of the severity of the bottleneck and also how rare the allele is. When a population returns to a stable normal size, variation remains low, often for many generations.
Probability of surviving a bottleneck:
Frequency of allele before bottleneck
Severity of bottleneck (i.e. number surviving)
Founder effect: Kind of bottleneck, where a small number of individuals leave a larger population and colonize a new habitat. Plant seeds sometimes stick the feet of migratory birds and are carried thousands of miles away.
Small number of founding individuals results in a genetic bottleneck. Only a small subset of the genetic diversity of the source population is likely to be included. If you include a rare allele in a bottleneck, it will end up being more present in the population as it grows than the original.
Selection
Fitness - the reproductive success of a particular phenotype. It is hard to actually study and measuring is preferably done through tallying the lifetime reproductive contribution of an individual. Fecundity, mating success, survival to reproductive age.
Issues/complications with the relationship between phenotype and genotype. Complex morphological traits, behavioural traits involved as well.
Relative fitness (w): consistently contributing more offspring than other variations makes this to be greater than 1. Fitness of individuals with one genotype compared with population average or most fit genotype.
Average excess of fitness: we must weigh how many individuals with each genotype are actually present in the population and contributing offspring to the next generation, shows how the net fitness contributes to the allele.
Natural selection has more power than genetic drift. Selection is free to alter allele frequency despite genetic drift conditions.
Pleiotropy: mutations often have more than one effect on an organism. A single regulatory gene, for example, can influence the expression of many other genes.
Antagonistic pleiotropy: the effects of a mutation have opposite effects on fitness. Conditions that occurs when a mutation that causes beneficial effects for one trait also causes detrimental effects on other traits.
Negative selection: Common phenotypes selected against, rare phenotypes are favoured
Negative frequency-dependent selection (NFDS)
The rovers and the sitters: Rovers survive best with more sitters, sitters survive best when there are more rovers. This was tested by putting them under threat in different ratios.
Epistasis: Beneficial mutations are only beneficial when they follow certain other mutations.
Dominance
Additive alleles: alleles that code for the same thing, and so having multiple copies will increase what you have and how much is present. Allelic effects can be predicted by summing number of copies present. One allele genetically dominant to another allele.
Dominance: dominant allele masks presence of recessive allele in heterozygotes.
Vulnerable to selection: deleterious additive alleles can be entirely removed from a population
Additive and recessive alleles can reach absolute frequency, whereas dominant alleles can never quite reach absolute frequency (always have recessive alleles present in the background).
Deleterious dominant alleles will be affected and get put away.
Heterozygous advantage: occurs when selection favours heterozygous individuals over either the dominant homozygote or the recessive homozygote. Heterozygosity confers greater fitness than homozygosity.
Cystic fibrosis - autosomal recessive, chromosome 7, CFTR gene. Excessive mucous production causes damage (pancreas, liver, kidneys, and especially lungs). Pancreatic issues leads to poor nutrient absorption. TTT coding for phenylalanine means people lose it when they delete it our - proteins is less effective.
Heterozygous advantage - high prevalence of the mutations, kept around because of how it helps with other things. Fighting different diseases.
Inbreeding
Inbreeding - decrease in heterozygosity. Cannot change allele frequency, but can change the distribution and decrease heterozygosity.
Inbreeding depression: High degree of homozygosity exposes deleterious alleles. Increases in individuals with cystic fibrosis.
Allele frequencies do not change in the population as a whole, but genotype frequencies change. Does not directly cause evolution, but can speed the rate of evolutionary change.
Inbreeding coefficient (F) - probability that two alleles at any locus, are identified by descent.
Inbreeding increases the percentage of genetic loci that are homozygous for alleles. Inbreeding changes genotype frequencies but not allele frequencies and therefore is not a direct mechanism of evolution. Inbreeding can, however, set the stage for strong selection on rare recessive alleles that typically would be masked in heterozygous individuals.
Genetic bottlenecks and inbreeding go hand in hand - especially in small populations. These “founding events” can be important episodes of rapid evolution because genetic drift has noticeable effects, and the increased homozygosity arising from inbreeding exposes recessive alleles to positive and negative selection. If the new population survives this bottleneck, it may be very different from its parent population.
Landscape Genetics
Population structure: also known as population subdivisions. When the constraints of landscape and distance restrict the movement of individuals from place to place, this is the result.
Subdivision: pockets with different variation, maybe entering an extreme subdivision where they’re whole new populations.
Many organisms occupy discontinuous ranges, can lead to population differentiation. Relatively little gene flow. It can adapt, but decrease survivability.
Genetically distant: subpopulations are separated and become more different. Measure of how different populations are from each other genetically. Informs population geneticists about levels of inbreeding within a population or about the historic relationships.
FST - measure of genetic distance. The values increase as the local subpopulations diverge from each other. = (HT - HS)/HT
Measures extent of subdivision among subpopulations (genetically distance)
Influenced by population size and time since divergence.
Compare FST between subpopulations, identify regions under selection (outliers)
Gene flow counteracts the effects of population subdivision, increasing genetic variation within subpopulations and homogenizing allele frequencies across the landscape. Extreme gene flow eliminate differentiation.
Bighorn sheeps live on mountains, and are very different from other populations, lynx move so much that gene flow is crazy. Barriers to gene flow (like a highway) strongly reduce gene flow.
Quantitative Genetics
Most genes are complex and quantitative (intenstity, height, length, etc.), rather than simple/discrete and qualitative traits. Most individuals have the average trait value (true in most populations)
Quantitative genetics: study of genetic mechanisms & evolution, continuous, complex phenotypic traits.
H-W extended to polygenic traits - 50% are heterozygous. The more genes contributing, the more spread you have.
Complex traits vary continuously. Low variance has a very tall bell curve.
Polygenic: expression is influenced by many genetic loci. Many traits are important for survival.
This is why phenotypic difference is usually quantitative over qualitative.
Evolutionary quantitative genetics: study of the evolution of complex phenotypic traits. Build models, view genetic and environmental variation, and environmental interactions.
Variance: estimate of the amount of the variation in a trait in populations - larger variance = practically identical in every individuals
Calculate how far each is measured deviation, and then square the deviations, and then divide the sum of the squares by the number of individuals in the sample.
VP = total variance in a population, sum of several kinds of variances
VP = VG (genetic difference among individuals) + VE (environmental conditions in which individuals develop)
VE > VG - In cases where environmental factors play a bigger role the alleles for.
VP ~ VG - Environmental factors are negligible
Broad sense heritability: proportion of total phenotypic variance of a trait that is attributable to genetic variance (differences among individuals). Relationship between parent and offspring. Variance in genetic divided by variance in phenotypes means they are in a ratio.
Includes additive effects, dominances effects, epistatic effects, maternal/paternal environment effects.
H2 = (VG/VP) = (VG / (VG+VE))
VG is made up of VA (additive genetic variance), VD (variance due to dominance effects of alleles), VI (variance attributable to epistatic interactions among alleles at the various genetic loci).
Narrow sense heritability (h2): proportion of the total phenotypic variance of a trait attributable to the additive effects of alleles. Looking for small increments that contribute to a trait. VG replaced by VA on the numerator. Variance in the additive effects of the alleles. Heritability helps understand similarities between parents and offspring.
h2 = VA / (VA + VD + VI + VE)
Parent offspring regression: slope is equal to the heritability. High h2 means they are very close to one another. Slope represents how much the offspring resembles the parents
Evolution
Directional selection: When a species on a far end has selective success. Most of this variation of assembling all the individuals together. There was never any corn with oil content before, but they drove it up so hard.
Stabilizing selection: Species in the mean of a trait has a selective advantage
Disruptive selection: A species on either far end has selective advantage. Can lead to a bimodal distribution (two means)
Selection =/= evolution - to see evolutionary response we need to measure the selection on a phenotypic trait and how that effects fitness genotype.
Selection differential (S): difference in mean of trait in reproducing individuals & mean of trait for general population. How strong individuals are. Higher S, stronger selection. = XB - XP
h2 - If height is highly variable, is it super heritable. Proportion phenotypic variance due to genetic differences among individuals.
s → selection coefficient; S → selection differential; XB → mean phenotype of breeding individuals; XP → mean phenotype of all the individuals in the parent’s generation.
Selection for large bodies: XB >>> XP
High heritability results in larger change
R - evolutionary response / Breeder’s equation. Calculating evolutionary response to selection.
R = h2 * S
h2 (phenotypic characteristics to offspring → heritability (narrow sense)), S (phenotypic variation that influences fitness → selection differential, selection coefficient.).
When selection and heritability are large: most rapid evolutionary response.
Linkage
Alleles get mixed and matched during meiosis. Independent assortment gives a 50:50 chance that the copy of any given chromosome is selected. Genetic recombination allows for an insane amount of allele swapping which makes humans so drastically different.
r = recombination rate. Probability of recombination occurs between a given pair of loci.
Parent 1 and 2 has offspring which are heterozygous. If this parent has this and this parent have that, the prediction is that we should be able to separate A and B alleles - we recombine. r is 50% for these gamete, which is the max value we can get with recombination rate.
0.5 comes down to how close they are on the chromosome, independent assortment will separate - on same chromosome we can only separate based on a crossing over event.
Only recombination event drops down to 3% when they are that close to one another. We call them linked, they’re basically glued together.
Linkage equilibrium (LE): allele are one locus is independent of presence or absence of allele at second locus. No linkage. Relationship between loci on different chromosomes are mixed and matched so readily that the chances of maternal and paternal alleles being inherited together
Linkage disequilibrium: allele at one locus is nonrandomly associated with the presence or absence of allele at second locus. Physical linkage. If chromosomes were always passed down unchanged from one generation to the next like beads on a string. Pattern of variation that decays predictably overtime, it is an accident of history.
Physical linkage: The adjacency of two loci on a chromosome strand, they are more likely to be inherited together.
Finding LD - gives observed and expected frequency (if they are independent), how different is it from expected, leaves 50:50.
LD (D=0.5), LE (D=0). Linkage equilibrium means there’s no linkage, when there is disequilibrium there is linkage.
All of the alleles unique to maternal species occur on the maternal copy of the chromosome, all of the alleles unique to paternal species exist on paternal copy.
Visualizing linkage: taken chromosome and mapped it across itself. We’ve plotted 3 different loci. Right along diagonal, we see a mirror. Darker red has higher disequilibrium. Close to each other, LD.
Supergenes: group of functionally related genes located close enough together that they segregate as a single unit. Plant has to start for seed each year, all of these traits are found together on one chromosome.
Detecting linkage disequilibrium is necessary tool for for biologists to point to parts of the genome where interesting biology occurs.
We would ideally like to have a large individual with all the large allels, and one with all of the small alleles. We have variants in size. Do a selection experience, only mating largest and smallest fish together. Selection in nature picks for average size, because of artificial selection, we get phenotypes we may not normally see.
Now that they’re inbred we’re gonna shuffle them up and they will do this in chunks. Recombinant inbred lines become sign posts, at any given marker, the fish may tend to be larger or smaller.
Quantitative Trait Locus Analysis
Quantitative trait locus (QTL): stretch of DNA with variation for phenotypic trait, the regions contain genes or are linked to genes
Is there an association with marker type 1 and 2. If we plot markers across the bottom, is there an association. We plot it and see that we have heritability and should look in and around so we can see there is at least one gene contributing to trait of interest.
There is a significance threshold and markers spanning genome
QTL analyses can map numerous traits. Most colours are found on more than one trait.
Things may look different based on association of a paternal and maternal inherited alleles
Mouse coat colour has different alleles we see prominently for different regions of the body. We find genes that contribute to light vs dark mice. They didn’t have to do the selection, the species could already hybridize, selection has already given us white and brown mice.
Agouti and MCR1 = interacts together and affect fur colour. Peak of colour difference occurs at the Agouti allele. Active receptor of Mc1r is brown at active receptor (eumelanin) and repressed receptor (pheomelanin). Expression during development influences area.
Epistasis: when alleles at two loci interact together. Intermembrane receptor between the membrane. Different alleles of Mc1r that reacts different with Agouti and will do low or high interaction to determine level of melanin.
Genetic manipulation of dark mice makes them lighter, beach land and mainland differ a bunch.
Genome-wide association (GWA) mapping: detailed maps of entire genome of a species as well as genotype information for very large numbers of individuals. Mapping different traits in diseases. Takes genome sequences and asks about how they are at different loci-comparing to someone who doesn’t
QTL analysis requires a complete map of the genome, whereas GWAS mapping does not.
Phenotypic Plasticity
Response abilities to be plastic. Phenotypic plasticity represents the capacity for a genotype to express more than one phenotype depending on the environment.
Polyphenism: extreme form of plasticity. Multiple discrete phenotypes from single genotype. In response to environmental cues.
Temperature can effect age of maturity. Fertility can be affected by fertility, or can’t be.
Reaction norm: visualize the responses of organisms to the environment. Allow individuals across an entire population to produce phenotypes that match a wide range of environmental conditions.
Extra variability: we can add V(GxE) which shows the precise interaction of genes and their environments abbreviated. If greater than 0, the plastic responses of organisms to their environments can evolve.
History of our Genes / Evo-Devo
In order to assess genetic history within a species, we need a modified interpretation of phylogeny.
We use molecular trees same was as morphological trees. Selection and drift can drive variant fixation or elimination.
Morphology: presence of absence of feathers.
We track paths of alleles over time. Certain alleles my go missing or evolve into more alleles or continue.
Synapomorphy: derived form of a trait that is shared by a group of related species (that is, one that evolved in the immediate common ancestor of the group and was inherited by all its descendants).
Morphological synapomorphies: help determine relationship of a species and clades
Phylogenies studied at allele level may have paths of descents of 10 different alleles of a gene over 8 generations. Not all alleles are passed down, and not all alleles stay same at locus of interest.
Genetic loci have own genealogy.
Gene tree can reveal information about past, such as, bottleneck events, directional or stabilizing selection.
Nodes: points at which two lineages converge or coalescence into a single ancestral lineage
Coalescence occurs at the most recent common ancestor of any two alleles. Process in which the genealogy of any pair of homologous alleles merges in a common ancestor.
Tracking history of alleles through time
Move back through time to determine when/where alleles arose.
Nodes in gene trees are coalescence events (common ancestry).
Coalescence time for mtDNA is very slow because it is maternally inherited so it is hard to recombine unless it mutates. But we are really good at catching mutations, so it takes a lot longer.
Timing of events vary greatly. Whether alleles are under selection or not.
Alternative alleles can persist in populations for long time periods. Such alleles may be passed down to daughter species ways that do not reflect the actual branching history of species. Researchers use details of many genes or whole genomes when reconstructing species-level phylogenies.
Positive selection: Can accelerate the rise in frequency in an allele, shortening time to fixation and to a short coalescence
Gene trees and species trees
Orthologous gene or orthologs: one of two or more homologous genes spearated by a speciation event (as opposed to paralogs - homologous genes, produced by gene duplication, that are both possessed by the same species).
Introgression: hybrid offspring survives and mates with either original species, you can introduce genes from other species to another. They may be favoured or eliminated.
Incomplete lineage sorting: Gene tree does not equal species tree. When a genetic polymorphism persists through several speciation events. Fixation of alternative alleles occurs in descendent species. Retention of alleles may yield a gene tree that differs from the true phylogeny of the species.
Coalescence event happens before speciation event. The path can change based on genotype. Many loci are polymorphic when speciation occurs.
Divergence graphs have a lot of overlap in reality because alleles have a lot of crossover between species. Why we don’t base speciation events based off only one gene/loci.
Molecular Phylogenetics
Large scale morphological analysis. New trove of information of past DNA (which rarely persists longer than 100 000 years).
There is a source of error in homoplasy, issues with parsimony.
Purifying selection: changes that occur in exon regions typically evolve very slow
Negative selection: removes deleterious alleles from population, common form of stabilizing selection.
Bootstrapping: random sample of characters from their full data set, much like drawing a character from a hat. Keep sampling until they get the same number as in the original set. Use to evaluate how reliable the support is for each branching event (node) in an evolutionary tree.
Distance-matrix methods: convert DNA or protein sequences from different taxa into a pairwise matrix of the evolutionary distances (dissimilarities). Clusters taxa based on genetic distance (closely related sequences grouped together.
Maximum likelihood: determines probability of the data, given an evolutionary model and a hypothetical tree (usually starts with parsimony tree)
Bayesian methods: determines probability of a tree topology (shape), given an evolutionary model and data set.
Neighbour joining: distance matrix method, scientists pair together two least-distant species, by joining their branches at a node. Protein sequence alliance. Listing different allele sequences and seeing how many differences there actually are.
Bootstrapping: assigns measures of accuracy to sample estimates.
Origin of tetrapods
Used DNA analysis of lungfishes to show they are the closest relative to tetrapod and coelacanths as the next-closest sister clade
Homo Sapien evolution
1980s and before, almost entirely limited to morphology
Africa and diversification after moving out of Africa
Multiregional model: homo sapiens evolved gradually across the entire Old World over the last 1 million years from an older species of hominin
Out-of-Africa model: homo sapiens evolved in Africa alone. Other hominin fossils from the past million years represent extinct branches.
Origins of Human Immunodeficiency virus
HIV is most closely related to strains of lentivirus that infect monkeys and apes, SIV. Different HIV strains have different origins.
HIV-1 connected to chimpanzees disease
Structure of HIV tree allows scientists to pinpoint specific adaptations that may have allowed HIV to infect humans
Natural Selection vs. Neutral Evolution
Non-synonymous substitutions are much more subject to selection than synonymous substitutions. This changes an allele while synonymous switches a codon that keeps allele the same. Third site can wobble. Most evolutionary change is neutral with respect to drift.
Motoo Kimura (1968) - most evolution at the molecular level is neutral due to drift, neutral mutations become fixed in lineages at a regular clock-like rate.
Nonsynonymous are faster (positive) or slower (purifying)
Molecular Clock: estimating how long ago ancestors branched off based on amount of genes that differ between closely related species
With a line of best fit on most common ancestor and amount of substitution different in Cyt-C gene. Predictable amount of nucleotide differences there will be between them. Point reference of whether genes are changing fast or slowly.
Linkage equilibrium: when a mutation becomes fixed
Selective sweep: the elimination of polymorphism near a beneficial mutation that has spread to fixation. Allele experiences strong natural selection and quickly spreads through a populations
Genetic hitchhiking: selected for cuz it was close to selected allele
dN/dS ratio: rate of nonsynonymous to synonymous substitutions
<1 - most N mutations are deleterious and are removed (purifying selection)
=1 - neutrally evolving both
>1 - many N differences between species are fixed by positive selection
30% of people ended up with lactose tolerance. LCT allele is more common in northwest Europe.
Look into genome evolution and the bacterial genome shows how they are mostly genes. Genomic advances have been made, sizes vary greatly with no real conclusive evidence on what this means.
FST outliers and analysis of SNPs can be useful in identifying loci under positive selection. May reveal details of local adaptation.
Genes to Traits
Evolutionary changes in regulatory gene networks provide great opportunity for facilitating adaptations. Bryan Fry - what genes underlie the venom.
Gene control region: upstream of DNA has promoter region and other regulatory sequences. Influences transcription.
Repressor: protein that binds to DNA or RNA sequence, and inhibits expression of one or more genes.
Transcription factor: protein that binds to specific DNA sequences, like a light switch — turns sequences on or off.
Complex adaptation: suite of coexpressed traits. Experience selection for a common function. Multiple components must be expressed together for the trait to function..
Gene recruitment: co-option of a particular gene or network for a totally different function as a result of a mutation. The reorganization of pre-existing regulatory network can be a major evolutionary event.
Promiscuous proteins: protein capable of carrying out more than one function, such as catalyzing reactions of different substrates.
Scientists altered a gene called HistA, which encodes an enzyme that produces histidine, synthesized tryptophan. Natural selection ended up making the second gene, which made it good.
Defensins originally evolved in a common ancestor of snakes and mammals.
Hox genes determine body segment identity - hierarchical, arranged in order of expression. Development of limbs and the posterior. Divide gene and you get different sections.
Antennapedia: usually in thorax if you mutate expression time and location you get legs where the antenna are supposed to be.
Pleiotropic genes: capable of carrying out more than 1 function, especially likely to take on new functions if duplicated.
Paralog: homologous gene arising from gene duplication
Ortholog: homologous gene in different species that originate in common ancestor
E. Coli
Survival on limited glucose. Freezing colonies along the way (i.e. preserving transitions). 74 000+ generations. Grow them on bad food to see how they would adapt. As optical density increase, more e. coli present. Their ability to use citrate helped iron uptake.
Citrate: added to help with Fe uptake, not normally metabolized by bacteria, back-up energy source during stress. Cit 2 - genes get turned on, functions anaerobically.
Microbes are ideal for studying complex adaptation evolution (diverse, rapid reproduction). Novel traits evolve via co-option of genes capable of pleiotropic effects, gene duplication, changes in gene regulation.
Snake venom
Regulatory mutation led to expression of defensin in the mouth.
Snake venom genes have been recruited from genes expressed in many other organisms. Venom evolved before snake evolved. Series of duplication events + co-option of proteins originally involved with other body functions.
Directional terminology
Hox genes are a conserved genetic toolkit among animals. A common ancestor in early animal evolution passed in this toolkit to animals. Found in species ranging from fruit flies in elephants. Networks make up an ancient genetic toolkit inherited by all animals with bilateral symmetry.
Hox genes and other patterning genes participate in regulatory networks that demarcate the geography of developing animals, determining the relative locations and sizes of body parts.
Flies and mice: homologous genes for D-V patterning, but expression differs “mirror images”.
Phylogeny of animals informs as to how toolkit was deployed: three independent evolutions of D-V patterning and single nerve cord.
Leg genes: derivation from a common ancestor. Blocking Shh expression stops limb patterning. It does the dorsal cells, proximal-distal axis, and ventral cells.
Hoxd13 expression in zebrafish and mouse embryos do basically the same things. Also shows evolution of tetrapod limbs from fins, an example of subtle changes of developmental genes having a dramatic alteration of phenotypes.
Antagonistic pleiotropy: mammals have seven cervical vertebrae in their neck … including giraffes. Shouldn’t giraffes have many more vertebrae? no they’re just bigger.
Antagonistic pleiotropy: mutations have positive effects for one trait but negative effects for another trait (trade-off). Can cause some phenotypes to be unsuccessful even when mutations may be beneficial.
Natural selection often retools the form and function of characters within a population, leading to complex adaptations that are far from perfect but that still provide fitness advantages. Examining traits that converge can reveal the genetic and developmental underpinnings of similar adaptations.
Natural Selection
Where Darwin studied finches, there were many islands formed by volcanoes, relatively short time ago the island popped up (4.2 mya), and even shorter the first finch popped up (1 mya). Darwin was only there for 5 weeks.
Endemic animals: animals found here and nowhere else, evolving in those locations.
Darwin noted all the variants, wasn’t until years later did a man look at his specimen and reveal they were all finches. Evolution and adaptive radiation.
Birds are most common in the Galapagos because it is only 900km from Ecuador, a bird can make that trip. Daphne major was the most important.
Isla Daphne Major: Small, no introduced animals (eg. goats), not appealing to people, low vegetation, undisturbed, trek to get there. Vegetation is knee height. Variety and choices went down after drought, only big and tough seeds left, little to no mating, lots of eating. Seed abundance went down. Forced to eat Tribulus.
Medium ground finch: generalist feeders, variation in beak size influences efficiency at eating different types of seeds. G. fortis likes spurs (easy to find and eat), while tribulus are hard to eat, but they can in a pinch. G. magniostris prefers tribulus because of its big beak.
Tribulus: each is a schizocarp. Within is 3-5 seeds, but it is a pain to get open. High effort, low payload if beak is not strong enough to crack open.
Big peaks in selection make big change in mean beak size, however low selectivity will bring numbers back to stabilization. Selection is variable and moments like drought drive microevolution.
Peter and Rosemary Grant - first scientists to make rigorous long-term measurements of natural selection. Studied Darwin’s finches, saw how DNA indicated island arrival and saw bird rapidly evolving into many different forms.
Parent offspring regression:
h2 - additive genetic effects of alleles.
R = h2 S, average beak size = additive genetic effect * S
0.3 is average heritability in nature. 0.9 is very congruent of parent and offspring, responds relatively high to genetic responses.
S is the selection coefficient, if selection is strong, heritability will be strong.
The diet changed based on beak size, and it would get smaller cuz it didn’t need to be as large for small seeds, these mechanisms explained how they survived in drought conditions. Dry seasons of drought years favoured big beaks and evolution can happen surprisingly fast. Populations evolved in a matter of generations.
Mice
Requirements for evolution by natural selection
Phenotypic variation in population (variation)
Variation is heritable (heritability)
Differential survival or reproductive success of variants (fitness)
Non-cryptic environment: prey are more at risk in these environments. Being cryptic increases survival and favoured in these environments (explained by multiple origin of light colour hypothesis).
Using quantitative trait locus (QTL) mapping to identify a few key genes involved in determining the colour of the coats of mice. Study how hair colour effects the likelihood of reproductive success (getting killed by predator).
Need differential reproductive success among individuals in a population.
Thousands of years ago - amino acid switch in melanocortin-1 receptor (Mc1r), decreasing dark pigmentation added to by another gene called the Agouti gene, which resulted in two genetic changes → reduced levels of melanin synthesis and lighter overall coat colour. Dark mice mainland, white mice coastal.
Climate-Drive Selection
Snowshoe hares molt their brown fur and grow a white coat matching the winter snow. Pacific northwest snowshoe hares produce a brown coat after molting, because they don’t experience a lot of snow.
As a result of climate change, populations molt and stay brown, the winter brown hairs.
Agouti around FST. Extended phenotype, effects associated with the corresponding DNA sequences that are manifested by an organism whose cells do not contain that gene. It effects another organism.
High FST is very different from each other. Low FST is genetically very similar to each other. Chromosome 4 has one of the differences come down to the allele.
Genome wide tree: all the dots show winter brown snowshoe hare, with jack rabbit as outgroup
Sequence of Agouti itself groups hares together. Same in winter brown and jack rabbits than in winter white hares. Introgression and hybridization stops transition and stays brown all the time. Hares hybridizing with jack rabbit brought out this change in phenotypic expression.
Gene flow and drift do not cause mutation, but the mutation fitness consequences amongst variants has the effect of genetic drift and makeup.
Predator vs. Prey
More than one agent of selection can drive natural selection. After eggs hatch, larve bores into the bud of goldenrod, larva secretes proteins and the goldenrod make a bulbous gall to cradle the larva.
Extended phenotype: the gall is made of plant cells, and yet is controlled by the flies (their size).
Gall fly: female has an ovipositor, pincher at the back end that gets inserted into goldenrod and lays their eggs. Reaction forms a gull around the larvae. Our body would wrap stuff in mucus. The goldenrod pumps food and is protected.
You can see galls on goldenrod, you can see a fly maggot. Gull becomes woody in winter, and you can find a pupae waiting for spring to emerge.
Woodpeckers can get to it. Wasps like smaller galls, and humming birds like bigger galls. Conflicting pressure.
Stabilizing selection: these are the ones not being eaten or killed off by much.
Replicated Natural Experiments
Three spined stickleback: dorsal fins and small little spine, erects spine to avoid being eaten by predator. The armour length of marine (ancestral) form is long and armour plates are protective. Freshwater (derived) form are shorter and don’t have as much protection (individual sections are bigger).
Independent populations experience parallele environmental changes. Ideal for evolutionary studies.
Eda is associated with divergence between marine and freshwater fish. They did genomic mapping and one peak forward one peak down, Eda gene is the most important for water conditions. Specific alleles form spines and armour and varies with degree of it. Relatively shorter spines compared to marine.
Rowan Barnett
Low-Eda allele favoured in freshwater
Two alleles of Eda - Low (L) and complete (C).
Producing armour is energetically costly, and little predation pressure counterbalances this.
Marine forms came back after all being killed, and brought the C allele back (After it had been eradicated in the ocean).
CL - partial morph (middle of the back)
Populations that independently experience parallel environmental changes represent replicated natural experiments. Ideal for evolutionary studies.
Artificial Selection
Genes and alleles are often already present, and we hand drive selection (breeder) to impose incredibly strong directional selection.
Extreme selection: are you able to mate to create the next generation.
Pigeons, dogs, corn, Brassica.
Teosinte: ancestor of all modern corn, largely formed by Mexican farmers. Fossil corn shows in corn change in size in areas where corn lived.
Flies become resistant fast and we give them this by spraying them all at once.
Glyphosphate chemical: interferes with essential amino acids - EPSPS in plants under selection, leading to resistance against round up. It is vital, very little room for it to change without it disrupting vital function. We have seen selection of individuals having resistance to EPSPS. Palmer amerancth - 160 copies of EPSPS and it just mounts up, best chance at surviving roundup. Spray Bt crops, and use refuges.
Frogs - grew largely from 1940-1980 in north east coast of Australia. They’ve done a lot of bad to other things. Rather quickly, African can toads for smaller, but relatively longer legs. They had better access to prey.
Richard shine (been studying the frogs): Overtime a predator emerged (Australia black snake), making the frog become larger, making snake head smaller with a larger body. Cane toads you can go after.
Human selection on big horn sheep, they want the largest big horn sheep (males have larger horns), so they were age corrected by horn length. Smaller individuals are surviving, and then outlawing it, we saw a rapid increase in stabilizing.
Fisheries target older, larger fish. Selected for alleles resulting in earlier maturation and smaller size. Mature earlier = reproduce before caught, but small fish produce fewer eggs. Cod was the most abundant fish and they used to take awhile to become sexually mature. Fisheries want the largest fish, largest payload. Smaller fish produce smaller eggs, fewer fish in next generation, 6 years maturity falling down to 4.5. It will be a long time till the cod industry recovers.
The speed of evolution depends on the amount of genetic variation and strength of selection, which leads to rapid resistance in pest population. An understanding of evolutionary biology can lead to novel management practices.