Z Scores
what is a z score?
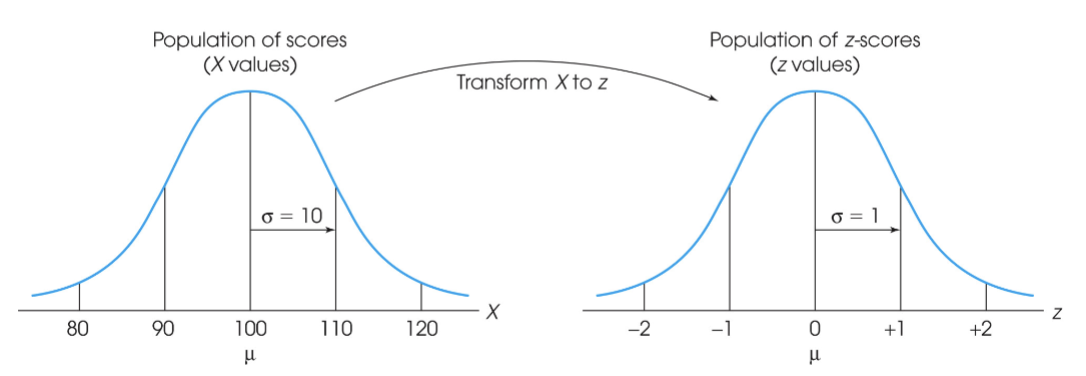
Z SCORE: a measure of how far from the mean a data point is in units of standard deviations rather than in units of the original variable
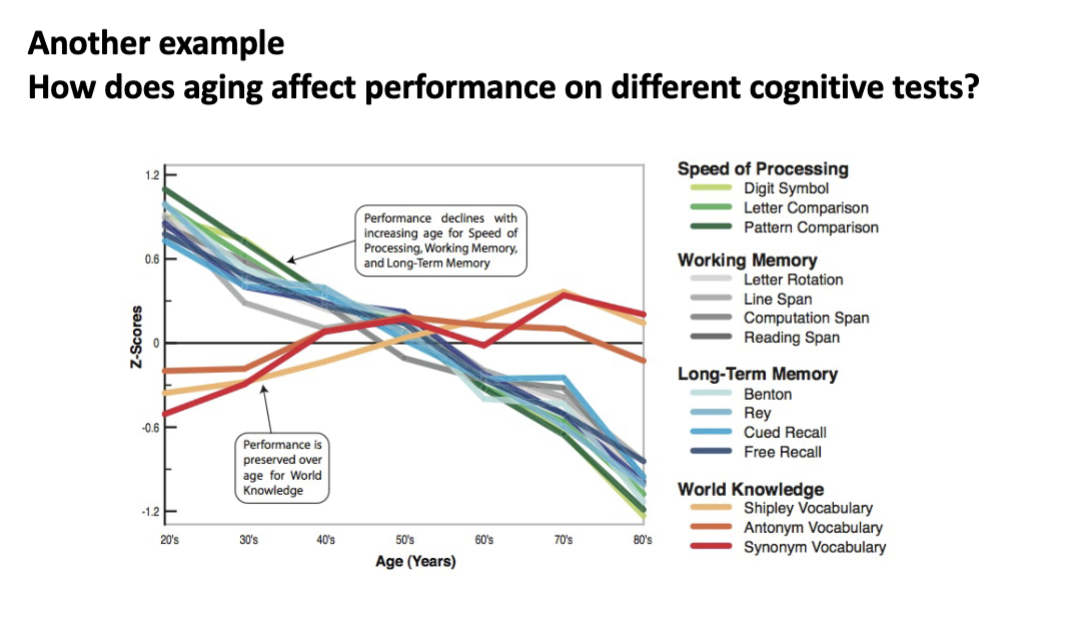
very helpful for comparing across measures with different units of measurement
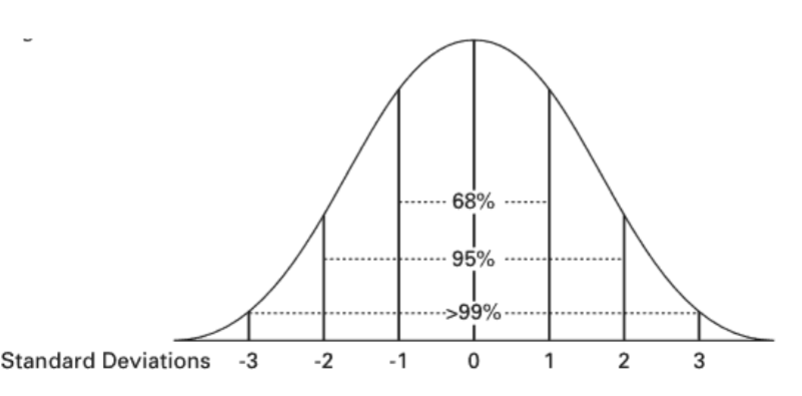
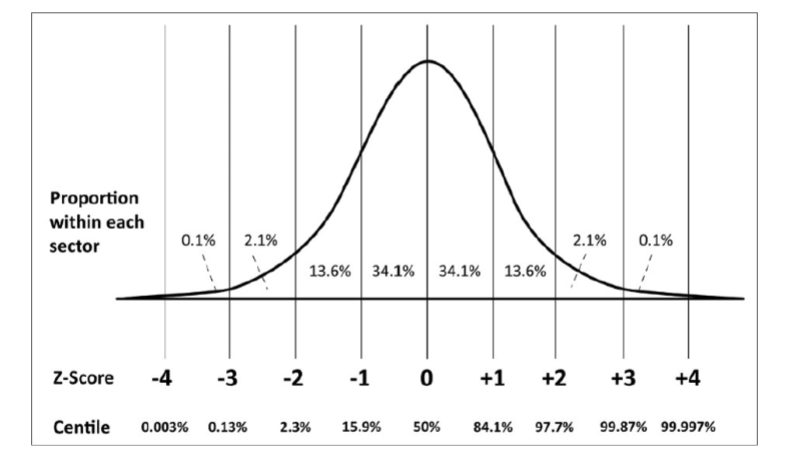
STANDARD NORMAL CURVE: a theoretical normal distribution with a mean of zero and a standard deviation of 1
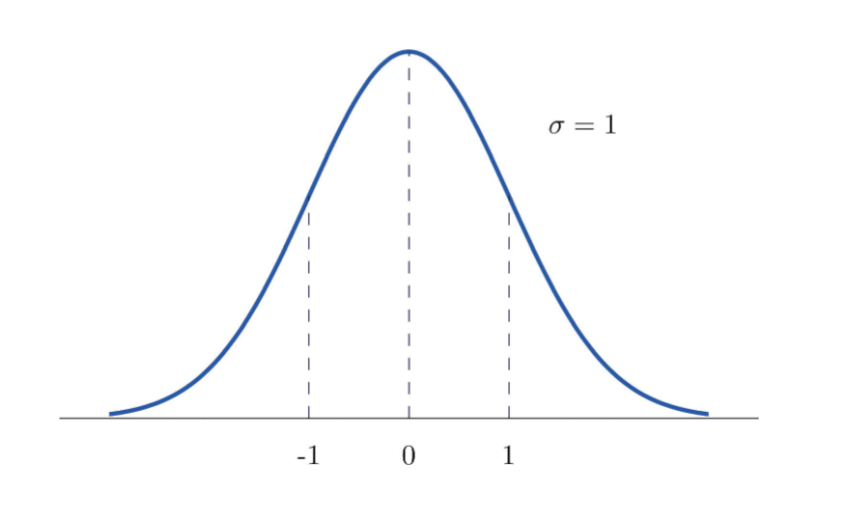
the standard normal is one set of parameters for a normal distribution
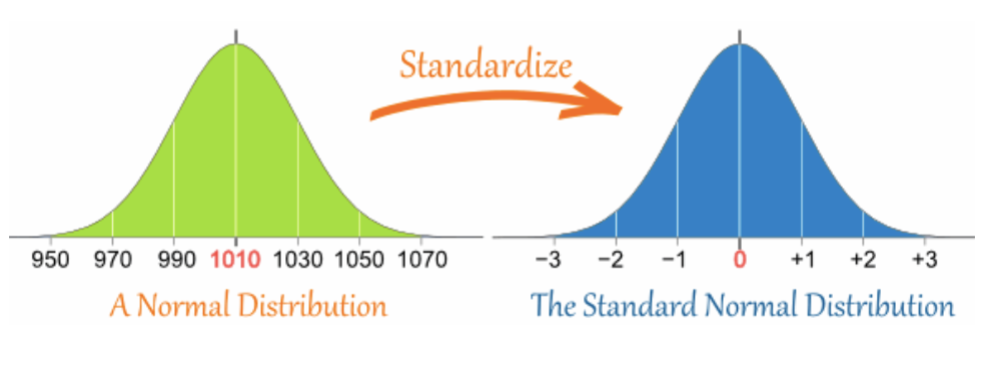
example of curves with different means and standard deviations
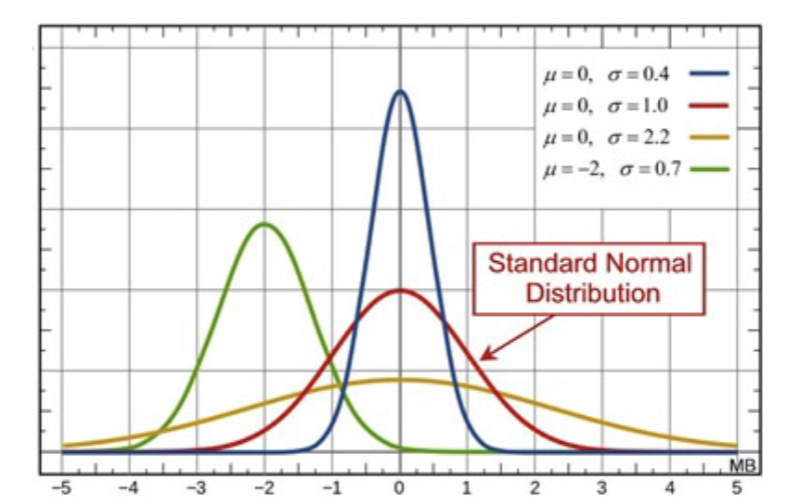
any normal distribution can be standardized to a standard normal distribution which is defined as having a μ=0 and σ=1
a z score expresses a score as a standardized score indicating where it lies on the standard normal curve
z scores refer to scores in terms of distance in standard deviations from the mean and initial units are ignored
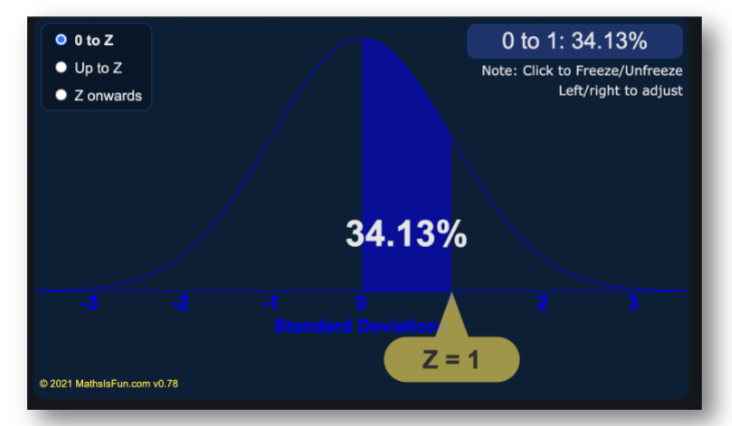
a z score of 1 always means 1 standard deviation above the mean
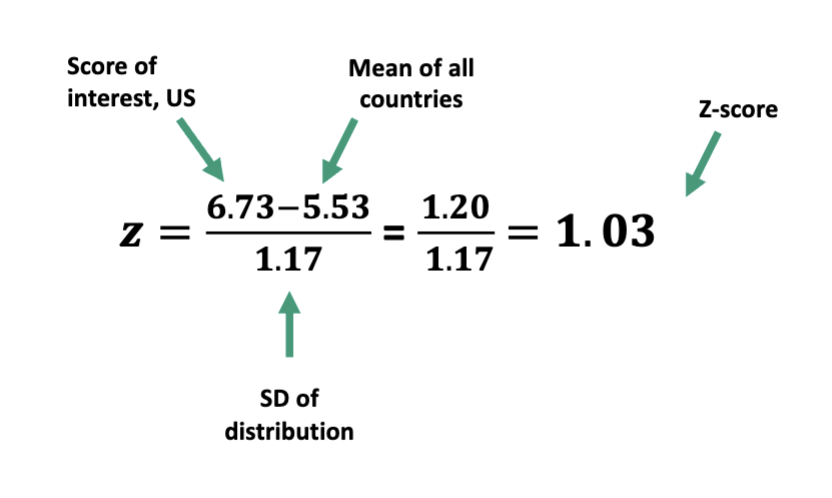
computing z scores
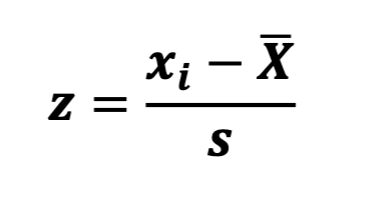
to compute a z score you need-
the score you want to convert to a z score (xi)
the mean of the distribution (x bar)
the standard deviation of the distribution (s)
example with world happiness data
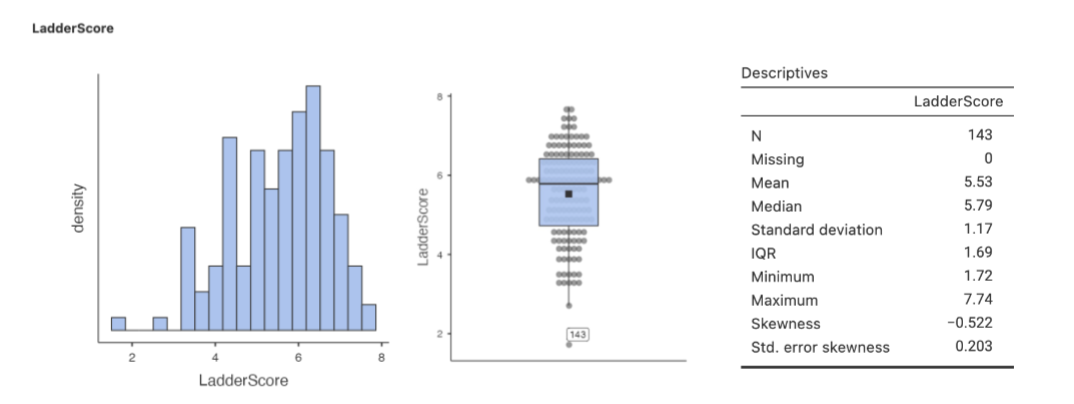
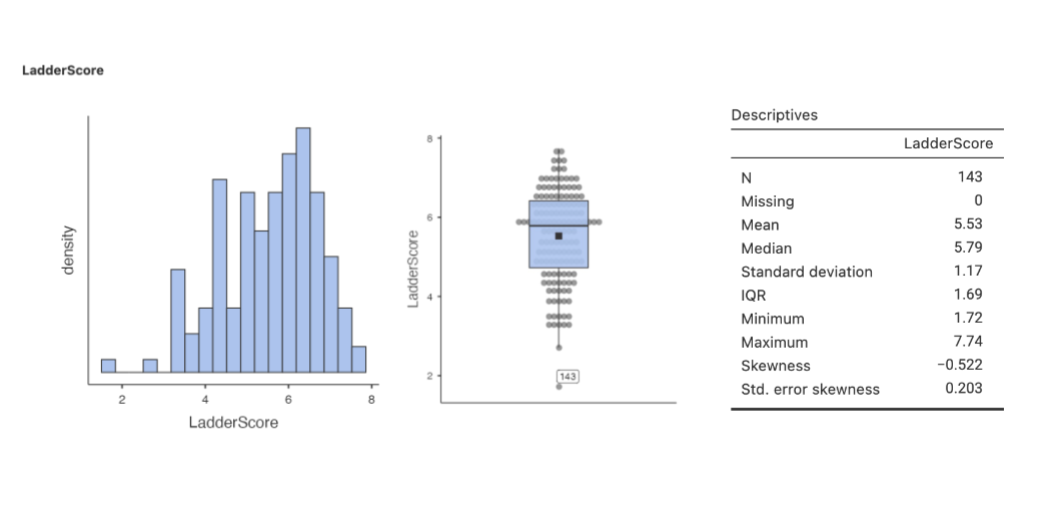
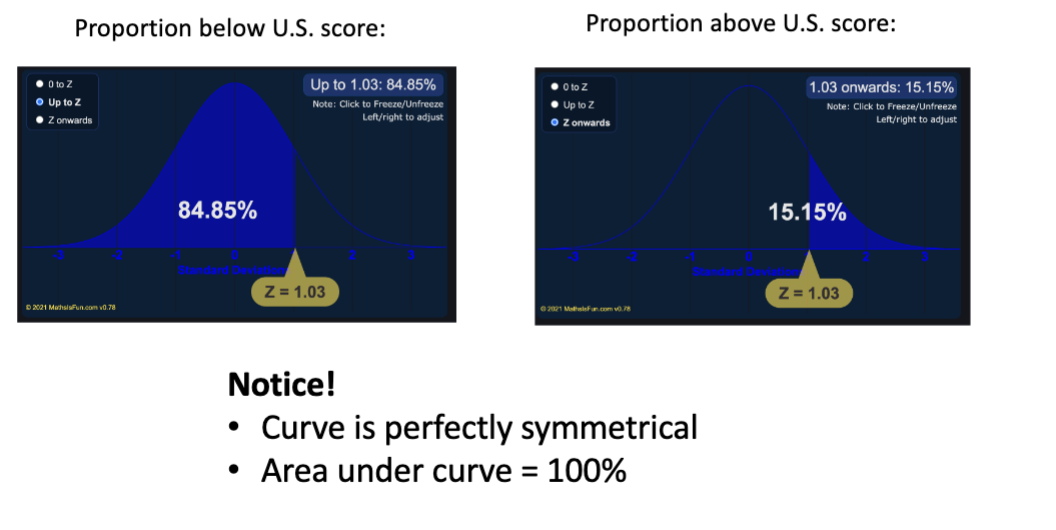
standard curve gives us easy access to information about proportion under the curve
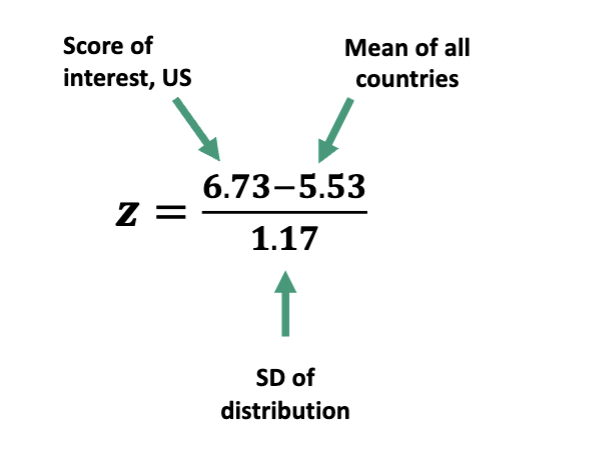
to calculate a z score for a given raw score
divide by the standard deviation, then add the mean
divide by the standard deviation, then subtract the mean
subtract the mean, then divide by the standard deviation
subtract the mean, then divide by the variance
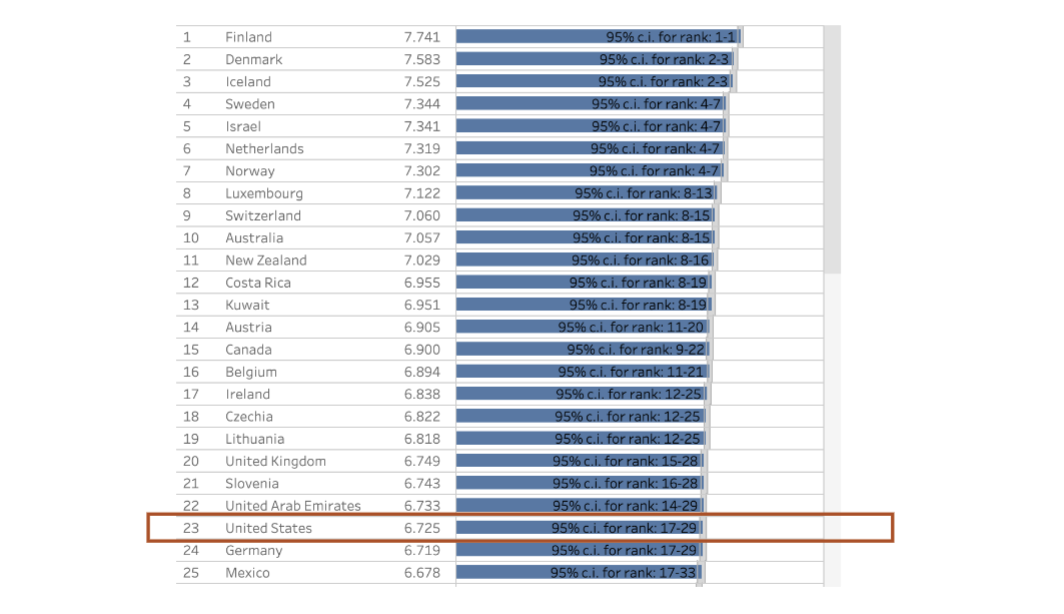
example application with Gallup Poll
in 2012 the United States had an average self-reported happiness of 7.27
did we become less happy relative to other countries?
how can we compare our happiness relative to the world for the latest report (score of 6.73) to our score about 10 years ago in 2012 (score of 7.27)?
Z SCORE!!!!
z scores give you a tool to make comparable scores for variables that are on different scales of measurement
z scores can help identify highly unusual scores that are “outliers”
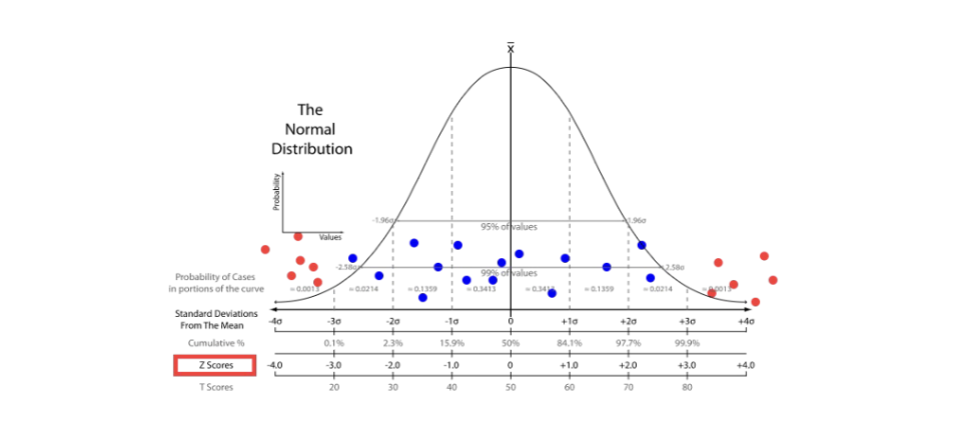
a common benchmark is to consider all scores less than or greater than 3 standard deviations from the mean as outliers
z scores in your stats toolbox
compare relative standing of scores from different distributions (from different points in time)
create comparable scores for variables that are measured in
different units so they can be compared directly or used to
compute an average “composite score” (different kinds of homework scores likes quizzes and tests)
use benchmark of standard deviation to determine whether a
score is an outlier (scores less than or greater than 3
standard deviations were considered outliers, what is an
alternative benchmark for variability to do this? HINT: how
Jamovi labels outliers in box plots)