Soil exam #3
3/10/25
pH range of soils and other materials
Soil organisms - grouped by size
Macro-organisms (>2mm) > MESO - organisms (>0.1-2mm) > MICRO organisms (<0.1mm)
Worms, termites, mice > springtails, mites > tardigrades, nematodes, fungi, bacteria, archaea
Soil organisms - grouped by metabolism
Metabolic grouping of soil organisms based on source of energy and carbon
Source of carbon - combined organic carbon - biochemical oxidation
Chemoheterotrophs , all animals, plant roots, fungi, actinomycetes and most bacteria
Earthworms, fungi, water bears
What are most of these organisms getting their combined organic carbon from?
Both chemoheterotrophs and Photoautotrophs
Carbon dioxide or carbonate - solar radiation
Photoautotrophs plant shoots, algae, cyanobacteria
CARBON can be cycled through an intermediate consumer before it is consumed by Chemoheterotroph
Chemoautotrophs that use carbon dioxide and carbonate
Ammonia oxidizers and sulfur oxidizers
Are doing it as an energy source transformation
Getting carbon from inorganic sources
Trophic levels and energy transfer
Primary consumers in soil
Herbivores : eat live plants
Larvae of cane beetle which feeds on living sugarcane plants in all stages of life cycle
Detrivores: eat remains of dead plants and microbes on them
Saprotrophs: microorganisms that consume detritus, corpses and feces
Secondary consumers in soil
Carnivores : eat other animals
Microbivores feeder : eat microbes
Protozoa, which graze on soil microbes
Trophic levels and energy a( and carbon transfer) of belowground communities
Other microbes exist in soil that arent as involved in the soil organic matter
Process of transformation
Trophic cascade of aboveground communities
10% of energy is lost every time
SMall part of period is small itty bitty animals compared to plants as largest energy source
In a given amount of soil there is a certain amount of biomass
3/24/25
Soil organic matter (SOM)
Contains the elements in living biomass (CHNOPS)
SOM is about
58% carbon by mass
1-6% nitrogen by mass
SOM is one pool ofhte global carbonand nitrogen cycles
Pools and fluxes
We can think of cycles of C,N water ( and other material cycles in terms of pools and fluxes
Pools describe the amount of material that is present in a given compartment
Fluxes during the amount of material that is moving song the compartments during a given period of time
Turnover rate and residence time
We can define turnover rate of a given pool as the proportion of that pool which leaves during a given period of time
(turnover rate = output/pool)
We can define the residence time of matter in a pool as the average length of time that a given molecules will remain in that pool
(=pool/output)
These measurements are critical for understanding soils and turnover rate of nutrients in fields
School example
(turnover rate = output/pool) , (residence time =pool/output)
Pool = 1000 students
Input/ output = 500 students / year
Turnover rate = 0.5 = 50%
Residence time = 2 years
The global carbon cycle
Carbon cycles constantly between land oceans and atmosphere although its residence time in various reservoirs can vary greatly, black arrows show natural fluxes and red arrows show human fluxes
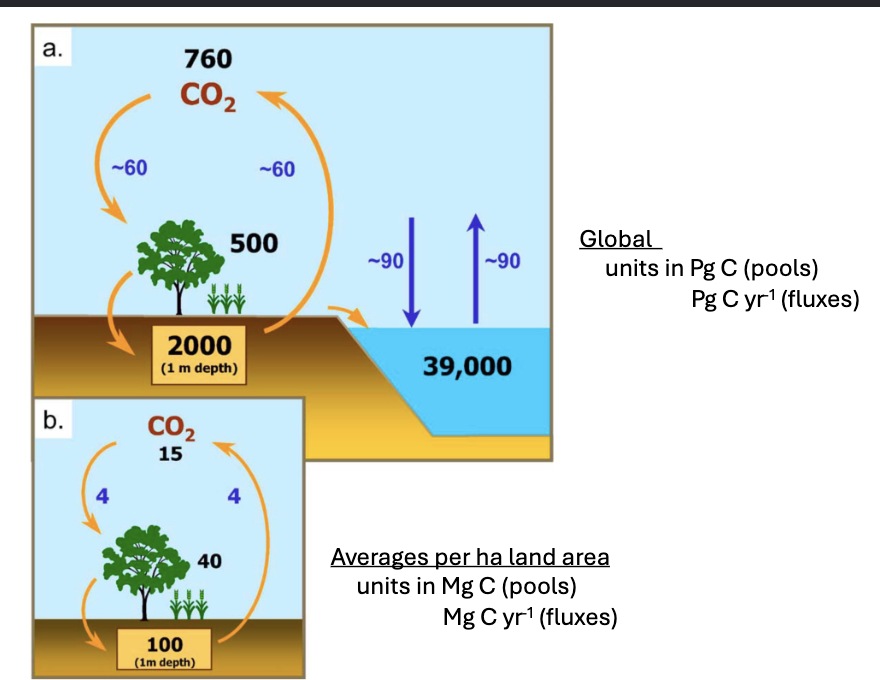
Key points::: Soil Contain almost twice as much carbon as the atmosphere and terrestrial vegetation combined
Global:
Units in Pg (C(pools))
Pg C yr 1 fluxes
Averages per ha land area
Units in Mg C *pools
Mg C yr *(fluzes)
Som SOM persits
When carbon is deposited by a plant - major pathewat in which carbon enters soil
Plant as a photosynthetic organism is drawing carbon from atmosphere, c
creating organic carbon, both living and dead is depositing into soil
Respired by microorganisms within a few hours
Or may persist as SOM for hundreds of years
In other words, SOM has heterogeneous residence times
Reasons why SOM persists in the environment
Have been radically revised in past 10-20 years
Older concepts and terms are still around.
Carbon dating etc
Evolving views of SOM origin and persistence
Favorability of microorganisms in different environments can change how quickly things are absorbed and carbon is cycled
We have redundant terminology to talk about fast vs slow cycling pools
Formation of POM (particulate organic matter)
A root or shoot enters soil (plant death or turnover) → +CO2 expelled → decomposer activity reduces size and mass of root, and alters chemical composition → CO2 expelled, remaining is >2mm> → Remaining fragments of root become POM
Formation of MAOM (mineral associated organic matter)
A root deposits carbon such as through exudation → plant carbon is directly adsorbed to minerals or processed by microbes → organic matter associated with minerals become MAOM
Some proportion can be respired in this instance, some remains in cell of microbe and then die, which generates NECROMASS (dead material )
POM = ~ 20% of organic carbon in arable soils
MAOM =~ 80% of organic carbon in arable soils
TOTAL SOC pool is a function of…..
Carbon inputs
Aboveground litter, animals waste, organic amendments
Roots, root exudation (aka rhizodeposition
| V |
Carbon outputs
Respired C(CO2) Harvested C (agricultural) Erosion Leaching of dissolved organic C 4
Important function of crops to be able to supply soil through their roots
Protection mechanisms of SOM
Limitations of microbial access or activity that enable SOM persistence (Ie extend time before decomposer attack, consumption and respiration) → respired C(CO2) → protection mechanisms reduce this output flux from the SOC pool
Some carbon outputs in soul can persist for thousands of years
Limitations on microbial access
SOM can be protected from decomposition by being occluded within aggregates which limit microbial access
Material inside an aggregate has longer residence time - something protected in an aggregate = Occluded POM
Shorter residence time= free POM
SOM that is absorbed to mineral surfaces aka (MAOM) is less vulnerable to microbial decomposition than a counterpart molecule that is in a soil solution
Oldest carbon is often that that is adsorbed into a mineral
Limitations on microbial activity - Low O2
Anaerobic conditions, lack of O2, slows down microbial activity
Soils can become anaerobic if they are::
Permanent wetlands
Seasonally wet
Have anaerobic microsites
An aggregate w POM that has lower O2 in aggregate and higher O2 on outside
Limitations on MICROBIAL activity - low temp
Cold conditions - less optimal for microbial activity
Can be measured using a laboratory incubation that measures different temperatures and CO2 production/ day
Happens in GELISOLS as they help protect carbon in cold climates
Limitations on microbial activity - Low pH
Acidity inhibits microbial activity - like a pickle :)
The Hoosfield acid strip - single application of lime in late 18000s created pH gradient
Histosols (Bogs) can become acidic if they are fed from rainwater rather than groundwater (which is rich in base cations) or develop acidic parent materials
Peat bogs
Acidity delays decomposition, this applies to organic matter inputs from non plant resources
Which is why things can be preserved in the bogs
Peat bogs are so dense in preserved plant organic matter they can be burned for fuel
A non renewable resource as peat takes thousands of years to develop.
Limitations on microbial activity — HIGH C:N
Plant litter
Not protected by association with minerals or occluded in aggregates
Can be characterized by its ratio of carbon atoms per one nitrogen atom (C:N ratio)
Red clover C:N = 15 , SPruce C:N = 50, corn leaves C:N = 100, sawdust C:N = 500
Microbes
Litter C:N influences rate of microbial decomposition
C:N ~ 20/30, is usually ideal for microbial needs → rapid decomposition
HIgher C:N corresponds to more difficult to decompose material → slower decomposition
WHat connection can we make between litter inputs and historical vs emerging views of SOM?
Historical - above ground - now - more root and belowground inputs
Evolving view so litter chemistry role for SOM
Emerging views of TEXTURE role for SOM
SOC distribution reflects historical balance between inputs and outputs of C
Dry areas don't have enough moisture to support plant growth to provide carbon to soil
No output if not input
SOC los due to 12,000 years of human land use
Land use includes both grazing and cropping
Why does this matter
People have come in and added water and plant areas and bumping up growth and increase in soil carbon
Atmospheric CO2 concentrations
CO2 is a greenhouse gas whose presence in the atmosphere causes greater heat retention
Together combustion of fossil fuels and C loss from soil + terrestrial biomass are major drivers of atmospheric CO2 increase and climate change
Less carbon in soil means
Carbon needs to go to other compartments of the global C cycle including the atmosphere (contribution to global climate change )
Potential for reduced soil health
Soil health = SOC
Defined as the “continued capacity of soil to function as a vital living ecosystem that sustains plants, animals and humans
Although many measurements can be used to describe soil health, SOC is the most common
These practices maximize soil health are the same as those that maximize SOC within agricultural systems
Why SOC loss with land use change from native vegetation to arable agriculture
Annual crops reduce root inputs compared to native perennials, reduce C inputs
Tile drainage increases time under aerobic conditions, increases C outputs
Wetlands are great at accumulating carbon because they have a lot of water, not possible to grow crops though so you must irrigate
Tillage disrupts aggregates and their protection of SOM, increases C outputs
SOC loss under conversion to agriculture and SOC regeneration
Regenerative practices that increase SOC
Cover cropping vs bare fallow
Crop rotation with perennials vs only annuals
Different rotations of crops can affect soil differently
Reside (material left behind by crop after harvest) return vs removal
Valuable organic material harvesting or leave to add carbon back into soil,
Removing accelerate carbon
Organic amendments vs only inorganic fertilizers
Organic amendments
Plants, cow manure/ animal waste
Inorganic amendments
Inorganic amendments vs ZERO fertilizer
Growth decline in carbon inputs
NO till, or reduced till, vs tillage (contentious
Tillage can contribute to soil carbon lost by speeding up its output pathway
Potential for no till to lead to soil carbon stocks/storage is now considered unclear!
Three pairwise comparisons of SOC concentrations in tilled vs no tilled systems
Why might not till plots have greater difference between SOC concentration between different parts of topsoil?
Tilled system its being incorporated into the soil, no till the plant matter status on surface
No tilled system concentrates carbon in surface layer
Two ways of measuring a SOC pool
Concentration - mass SOC /mass soil
g SOC/kg soil or
g SOC/ 100g soil
Can be determined directly from sampled soil
Stock = mass SOC / area and depth of soil
g SOC / M^2 or
Mg SOC/ ha
Requires bulk density measurement and depth of sampling.
TAKE SOIL CORES
Composite cores
Sieve to 2mm
Analyze soil for its % organic C
Mass SOC /mass soil
All of these steps to get concentration and →
Tillage reduces bulk density
Bulk density affects measurement of SOC sock
Sampling to the same depth in soils that differ in bulk density will capture different masses of soil
Even if SOC concentration are identical between these two soils, which soil will have greater SOC stock in the top 30 cm
Denser soil will have greater stock in top 30 cm even if top concentration is the same
Connections interlude
POC → bulk density
Particulate organic carbon is
CO2 → MAOC
SOM fractionation taking soil and causing disruption→ many schemes
Physical fractionation:
POC/MAOC disrupts soils into primary particles
Size fractionation POC > 53 microns: MAOC < 53 microns
Density fractionation: POC < 1.86g/cm^3
Aggreagtion fractionatipn - less disruptive than POC/MAOC fractionation
Size cutoffs range form 53 microns to >2mm
CHemcial fractionation
FOundation of historical view of SOC persistence
Strongly alkaline extracts produced apparent large, complex molecules
Biological fractionation
Incubate soil with living microbes to assess biological accessibility
Causing a detectable increase in SOC after changing management can take > 5 years
Because potential to increase C inputs above C outputs is very small compared to the total SOC pool
Amount of C inputs are inexces of outputs each year
Nitrogen soil
Four types of biomolecules - ALL REQUIRE CHO
Protiens
Nucleic acids – require N
Lipids
Carbs
Photosysnthies depends on nitrogen
RuBisCo
Most abundant enzyme (a type of protein) in the world
Catalyzes the conversion of CO3 to organic carbon during photosynthesis
Nitrogen often limits plant growth
In other words, plant growth increases with more N applied
N limitation more common in temperate soils
In tropical soils, P can be limiting
Plants get their nitrogen from soil via root uptake
Forms of nitrogen is usually that plants take up = plant available nitrogen
Plant available nitrogen is usually “mineral” nitrogen (not associated with carbon
Two forms of nitrogen in soil
Ammonium (NH4) a reduces electron rich N
Nitrate (NO3) oxidized or electron poor N species
Nitrogen soils exist primarily in SOM
N in SOM
Protiens petitdes nucleic acids
Complex N forms not directly available to plants
These compounds can compromise 95-99% of the N in soils
725 g N m − 2 , as organic N in SOM, compared ~ 6 g N m − 2 for mineral N forms
Process by which N in SOM becomes available to plants = Mineralization
Extra cellular enzyme degrade large molecules of SOm so they are small enough to enter microbial cells
Rates of N mineralization
Increase with temp
Have an optimal moisture
If water potential is too low, microbial activity cannot proceed
Very high water filled pore space promotes anaerobic conditions, which slow down mineralization
Increase with soil pH
A SOM POOL
In top 30 cm
In - plant C input (shoots, roots, exudates)
Out - Respiration, harvest, leaching
Rate of N mineralization
Assuming SOM is 58% C and 5% N
And what else ??? NH4 === NITRIFICATION
NH4+ will be oxidized to NO3- for energy by microbes known as nitrifiers
Nitrifiers are chemoautotrophs
Chemo = energy from chemicals
Auto= carbon from inorganic sources
These microbes use O2 as terminal electron acceptor
So, nitrification is an aerobic process
No air
Optimal = ~60% water filled pore space
Immobilization: microbial uptake of mineral N
IMporant for controlling N availability to plants
wN in microbes is not available to plants
Plant and microbes are sometimes thought to compete for mineral N
Microbes immobilize mineral N when they have access to C substrates but cant meet their N needs
NH4+ fixation by soil colloids
Adsorption of ammonium ions by the mineral or organic portion of the soil in a manner that they are relatively unexchangable by the usual methods of cation exchange
Colloids can “hide” NH4+ i n this way
NOTABLE FEATURES FOR N CYCLE
Precipitation> evapotranspiration
Limited potential for plant uptake of N
Lets assume soil has moderate/high CEC
There is both NO3 and NH4
WHich N species is more likely to leace through leaching
NO3 is more likely to leave because it is negatively charged that doesent readily bind to osil particles
4/2/25
N leaching loss
Transport of dissolved N out fo soil and into riverine or coastal waters
Predominatnly NO3- due to its inavilty to be held inc ation exchange, but leaching can include NH4+ as well
N leaching (aka runoff) occurs when
Mineral N pools in soil > plant uptake
Precipitation>evaporation
ENvironmental hazard due to Eutrophication
Soil nitrogen cycle
What is a highly oxidized species of N good for
DENITRIFICATION
Process by which nitrate (NO3-) ions are converted into gaseous forms of nitrogen
Carried out by denitrifiers
Most identifiers are heterotrophs
So, process of denitrification requires organic carbon compounds
Using NO3- as a terminal electron acceptor is less energetically efficient relative to using O2
When soils are well aerated, denitrification is limited
When soils are poorly aerated, denitrifiers can use NO3- for their growth
What is a terminal electron acceptor -
When organisms are respiring - building up a gradient of electrons
THe final molecule in an electron transport chain that receives electrons,
Last molecule in a chain of molecules that electrons go through
Denitrification - in an anaerobic incubation
h
Reaches complete denitrification if it gets all the way to N2, otherwise is incomplete
N2O is less abundant, but more potent greenhouse gas
Warming potential is almost 300 times greater than CO2
How will denitrification change with %WFPS (x axis)
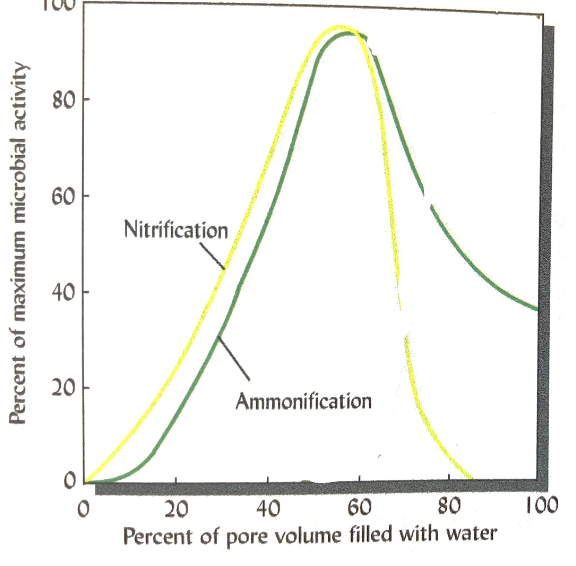
Denitrification will increase with x axis
Denitrification will increase as percent of pore volume filled with water, as it is poorly aerated.
N2
78% of earths atmosphere
Strongly bonded
Three covalent bonds →
Inert unreactive molecule
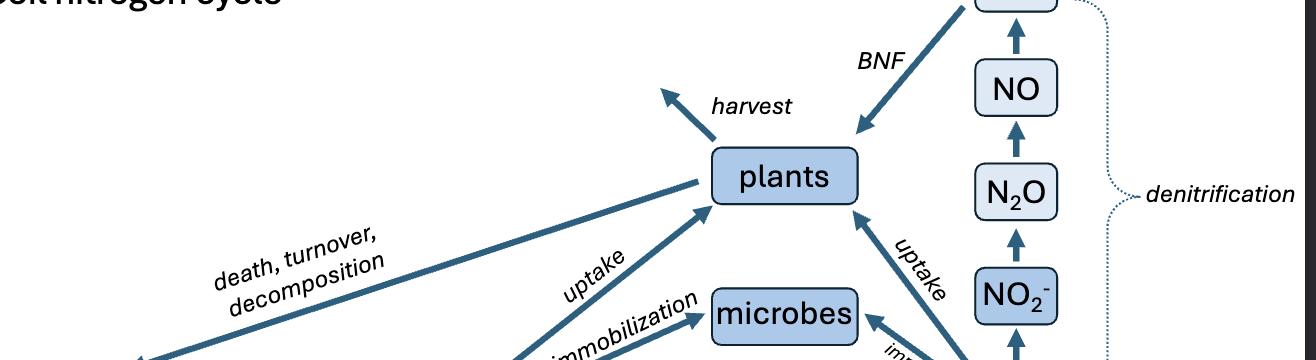
Return from N2 to soil organic matter via BNF, and death turnover and decomposition
BIological nitrogen fixation (BNF)
Important pathway for atmospheric N2 to enter terrestrial cycle
Commonly carried out by LEGUMES
BEAANS BEANS THE MAGICAL FRUIIIT
BNF
Faculatice association of N fixing bacteria(rhizobia) and a host plant(bean)
Legume supplies C compounds to fuel costly breakage of N2 bonds
13 genera of the rhizobia that vary in their effectiveness as nodulation/N2 fixation
Rhizobia are naturally occurring in soil
Attempts were made to coat seeds with optimal strains (didnt work
Rhizobia use the nitrogenase enzyme whose activity ceases in the presence of O2
Rates of BNF
Proportional to host biomass
Impeded by low pH low P, Ca and K availability
Decline with increasing mineral N availability
Legumes do not need to derive all their N from BNF
Symbiotic N fixation is a more important flux than free living N fixation
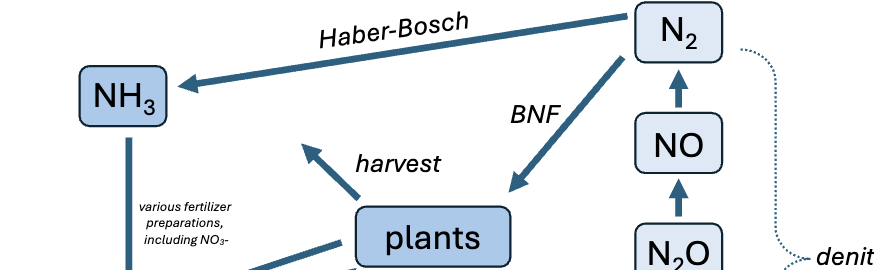
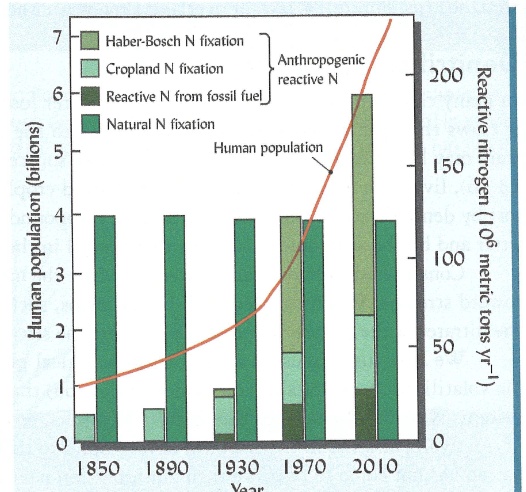
Haber-Bosch process
Developed cirva 1913
Convers atmospheric N2 to ammonia NH3 using hidrygen gas under high heat and pressure (usually done with fossil fuels)
Critical source ov N to support current human population
Increasing reactive N in biosphere carries environmental costs (leaching N2O emissions)
Denitrification - in the field arrows indicate fertilizer applied as inorganic N
4/4/25
If nitrate NO3- is the most oxidized form of N (loss of electrons) why does it have a negative sharge
Net charge (~ cation vs anion ) = overall electric charge of molecule
Oxidation state = number of electrons that have been lost or gained from the atom
N in NO3- has given away electrons to oxygens
N in NH4+ has taken electrons from hydrogens
Arrows indicate fertilizer applied as inorganic N
Key point: N2O fluzed are charachterized by “hot moments”” (shows here) when conditions in soil are right - also hot spots (not shown)
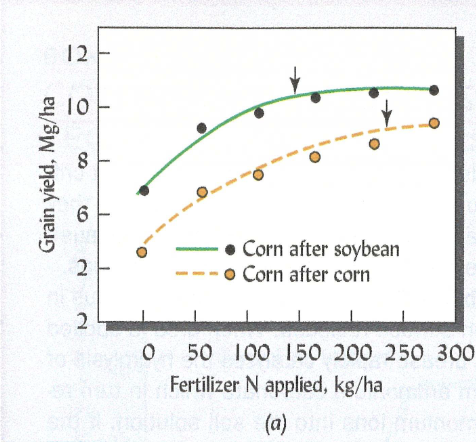
Crop response to N fertilizer
Why positive response
Widespread N limitation on plant productivity
And
Modern crop varieties are bred in environments with large quantitites of availbale soil N to take advantage of this N
Why is optimal N rate lower in corn-soybean compared to corn-corn
Fate of N fertilizer
For a cropped field in the upper mississippi river basin
A lot more leaching compared to other pathways
TIMING of N fertilizer applications
Fall (greater loss vulnerabilities
Spring (preplant - closer to time of plant uptake)
Sidedress(even closer to plant uptake, bc plant is growing)
Excess water can draw through the soil and drain and gets leached
Plant-avaibale N changes over growing season
Key points: plant available N spikes with fertilizer applications, is drawn down with plant uptake and loss pathways
PSNT - pre sidedress nitrate test
Oganic N INPUTS
ORGANIC N INPUTS are lsss mobile than mineral N inputs
Rate of mineralization depends on environmental controls (temp moisture)
And C:N ratio of organic N
Manure, compost 20:1
Grass hay 40:1
Exogenous organic N inputs
BNF → field one —> cattle grazing → cattle waste deposit → field 2
Recycling of N
CHickens consumer alfalfa← → chickens contribute litter total soil N
Volatilization of NH4 +
Process of NH4+ losing a hydrogen to OH - in soil solution and becoming ammonia NH3 gas
Soil colloids can adsorb ammonia if converted to NH4+
Ammonia volatilization increased with
Warmer temps
Higher soil colloids
NH+ availability on soil surface
EX surface fertilizer application not incorporated either mechanically or by water
Nitrogen decomposition from the atmosphere
Decomposition of ammonia and
Acid rain →
Combustion and fossil fuels lead to production of CO2 and fossil fuel combustion
N balances: N in vs N out
N balance:
Multiple types of N balance, possible system boundaries
Commonly: sum of anthropogenic N inputs - N exports from crop harvest
This N balance provides a metric of whether
Excess N enters a system (--> environmental consequence of reactive N)
Insufficient N enters a system (--> ‘mining’ SOM: reduced yield
N balance = inputs - outputs from harvest
Global excess of N inputs
Heavily fertilized systems - crops may still take up the majority of N from SOM
DOes mineral N fertilizer ‘ kill soil”
NO - many studies show microbial biomass increase with N fertilizer in ag systems
If we want to understand microbial abundance and activity between different systems, we need to
Clarify which systems are being compared
Identify multi faceted influences on microbial communities that vary between systems (NOT just N)
4/7/25
Does mineral N fertilizer ‘kill” soil
No — many studies show microbial biomass increases with N fertilzer in agricultural systems
If we want t understand microbial abundance and activity between different systems we neeed to
Clarify which systems are being compared
Identify multifaceted influences on microbial communities that vary between systems (not just N)
Wheat corn zero N fertilzer vs wehat corn 150kg N ha-1yr-1
WHat can we infer about these two systems in terms
Crop productivity and C inputs to soil
N losses (denitrification and leaching
Likelihood of steady state SOM vs not steady state SOM
Implications for soil as microbial habitat
When we make generalized statements about influence of mineral soils, we need to directly account for other influences and where Nirtogen is coming from
Four types of biomolecules
Protiens—------------------
Nucleic acid —- > -
Lipics—- > requires P - all requires CHO
Carbs—--------------------
Also requires P: ATP
P limitations can limit BNF
CHallenge of phosphorus acquisition
P is critical for plants despite its low leves (
0.2-0.4% of dry matter in plant leaves (1/10th the level of N)
Total soil P is relatively low
500-10,000kG P in upper 50cm of soil
Most of total soil P is unavailable, because it is insoluble
Only 10-15% of fertilizer P might be taken up bya plant that year
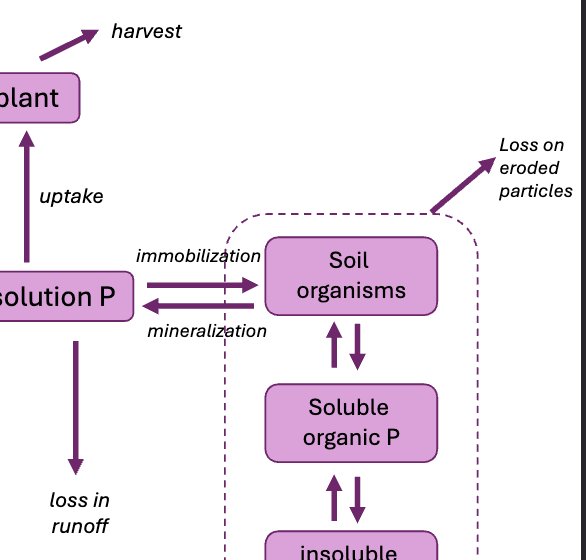
Soil phosphorous cycle
Plant←– uptake Soil solution P
P in soil solution
Present at low concentrations relative to other nutrients
0.001-1mg/L
Mix of inorganic phosphate ions (HPO42- and H2PO4-) and small organic P molecules
Ionic form determined by soil PH
Phosphate ions relatively immobile in soil
Roots quickly deplete P in nearby soil solutions as they grow
Plant uptake therefore aided by mycorrhizal associations
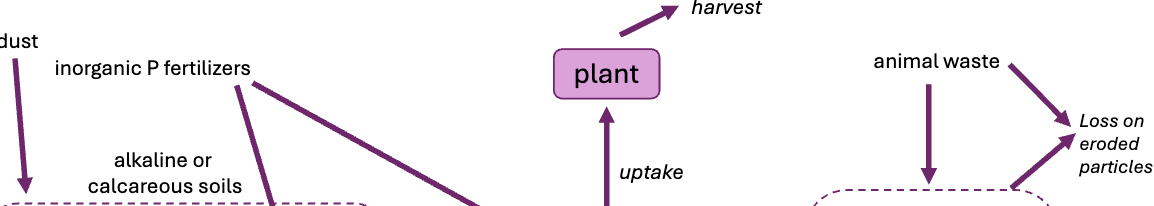
Inorganic P (not in soil soilution)
P added to soil solution rapidly ‘fixed’ in soil via chemcia rxns
Nature of reactions depends on soil pH
In pacific soils H2PO4 precipitates with Al, Fe, or Mn ions and forms
In alkaline soils , HPO4 2- reacts with Ca to form insoluble complexes
Reaction with silicate clays across broad pH range
Organic P
Can be mineralized and immobilized by microbes
Similar to soil N in this way
Rates of P mineralization correspond to rates of plant uptake in temperate systems
Gains and losses from P in soil
Losses
Plant p removal ((5-50 kg ha-1 yr-1)) agricultural
Harvest
Erosion (P-containing particles, 0.1-10 kg ha-1
P dissolved in surface runoff (0.01 – 3.0 kg ha-1 yr-1)-1)
P leaching (0.0001 – 0.5 kg ha-1 yr-1) (not shows in P cycle diagram)
Gains
Dust (0.05-0.5kh ha-1 yr-1)
Fertilizer inputs (variable agricultural)
P fixation capacity of a soil
Describes tendency of soil to adsorb P into soluble forms
Is finite due to a finite number of P fixation sites in soil
Varies between soils
Fe and Al ozxides contribute a LOT to P fixation
Organic matter contribute little to P fixation
04/09
Soil P, K
Phosphorus dynamics across climates
Temperate soils
More total P
Lesser extent of weathering
Added P is more available
Fewer Fe, Al, oxides to fix P
Higher efficiency of P fertilizers
Tropical soils
Less total P
Greater extent of weathering
Added P is more fixed
Presence of Fe, Al oxides
Lower efficiency of P fertilizers
Historical accumulation of P
Added P that accumulates in soil beyond plant needs is termed ‘legacy P’
Legacy P accumulated in excess of soil P fixation capacity may provide slow-release P to waterways - even after P fertilization has ceased
One contributor of eutrophication and associated hypoxia in chesapeake bay
Is eutrophication caused by excess nitrogen or phosphorus ?
Phytoplankton response to nutrient additions in whole-lake experiments
Key point: there is no atmospheric pool of P
P moves from terrestrial to marine systems and is returned through uplift over geologic time scales
Via parent materials, plants, movement
Peak phosphorous
An open phosphate mine, there is no growth in phosphate observed
There is no substitute for phosphorous, its in our dna
Historical view shows we will reach peak mining around 2040
What soil order has most total P
Aridisol> mollisol> utisol
Aridisol has less weathering to wash away P
Mollisol has lots of organic matter extremely highly weathered
Ultisol is also highly weathered
Potassium (K)
Potassium is none of these biomolecules
It is in the solution of cells and activates cellular enzymes
Leaf K concentration in plants range from 1-4% dry matter
Potassium in plant nutrition and the environment
Potassium uptake by plants is high relative to P
Soil K is high relative to P but similar to P most of it is unavailable
Plant- available K exists in soil as cation K+
Soil K cycling mostly controlled by CEC and weathering, not microbiological transformations (unlike N to some extent P)
Runoff does not cause eutrophication
Potassium supports plant defence
Pine beetles killing forest stands
Different from tree growth
Addition of nitrogen increasing tree mortality
Could have to do with chemistry of leaves
The addition of K and N allows plants to withstand these bugs and baddies more
Potassium forms in soil
Total amount of soil K is greater than any other nutrient element
Solution (as K+ 0.1-0.2%)
Exchangeable (1-2%)
Fixed in 2:1 clays,, NON exchangeable (1-10%
Soil colloids , 2:1 clays, in between sheets of 2:1 structures in clays
Sometimes water
Sometimes K
Micas primarily minerals, feldspars (unweathered parent materials) (90-98%)
Fine grained mica - non expanding 2:1 colloid with K in between mineral layers
Gains and losses of potassium from soil
Gains
Fertilizer
Exogenous K from other systems (animal waste, residues)
Losses
Leaching
Plant uptake and removal
N+P+K are big nutrients needed
K included because rate of mineral weathering may not be sufficient to meet the needs of a plant
Luxury consumption of K
What is the key point of this figure
As potassium availability increases, so does the relative content of plants and also growth
1 what's the X axis
K available in soil
2 what are both the Y axis
K content of plants
Relative plant growth of yield
What do each of the lines mean, how do they change, over coordinate space
Lighter line is relative plant growth
Darker line is potassium content of plants
Shaded area is luxury potassium
Dotted line is potassium required for optimal growth
4/11/25
Changes to global nutrient cycles
Inputs and outputs are changing throughout the years
Denitrification produces nitrous oxide which leads to moire climate change
AS more N that isnt used is denitrified it can lead to more
N surplus
WIth P surplus
Differing loss pathways for N and P
N carried by runoff
P carried by runoff
Primary pathway for phosphorous
N leached in drainage water - much more easily leached because it is soluble and moves through soil profile
Tile drains can lead to the ability for water to leave the system
P leached in drainage water
Transport of N and P from land to water
N is deposited in atmosphere and transferred via precipitation
Some general practices of nutrient management
Control total nutrient inputs
INFORMATION from nutrient balance soil testing, crop testing
For N: substitute leguminous N for mineral N
Leguminous N is less mobile - carbon and nitrogen are already together
Sub Leguminous N for a mineral form when you need more movement
Prevent overland flow/erosion (esp for P)- NO TILL
Tie up nutrients in living biomass (esp for N)
Modify landscape to prevent nutrient delivery to waterways (N+P)
Because water is such a prevalent way of movement for so many nutrients
Difference in nutrient retention capacity
Perennial grasses vs annual
Nitrogen surplus - supplied - removed
At same level of nitrogen surplus the annual crops are making more leaching per surplus vs perennial
Why would an annual crop produce more lost nitrogen than a perennial
Less soil mixing in perennial system prevents release via leaching
Volatilization
Thinking that microbial activity
Incorporating perennial grasses into arable landscapes reduces nutrient export because more nutrients available makes it so that
Riparian buffers - next to streams
Multiple pathways for preventing nutrient flow into waterways
Inorganic forms of nutient in soil
Nitrogen
Prevalence
More prevalent thatn phosphorus , greater pools (1-5%)
More present in organic form than in inorganic form
Plant available?
inorganic forms are plant available
Phosphorous
Prevalence
Inorganic P is most of soil P (30-70%), organic compounds make the rest
Availability to plants
Most inorganic P is not Plant available as it is fixed in Al, Ca or Fe
Mineralization and immonlization
1 meaning and 2 impliactiosn for plant nutient
Nitrogen
Immoblization
MICROBES CONSUME SOM
Mineralization nitrogen complex turns into NH4 (inorganic)
Implications for plant nutrient avaiblity
Immobilzation : microbail
P