Surface Characterization by Spectroscopy and Microscopy
Surface Characterization by Spectroscopy and Microscopy
Overview
Surface characterization techniques important for analyzing materials at the atomic level.
Covered topics include:
- X-ray Photoelectron Spectroscopy (XPS)
- Auger Spectroscopy (AES)
- Secondary Ion Mass Spectrometry (SIMS)
- Laser Microprobe Mass Spectrometry
- Electron Microprobe
- Scanning Electron Microscopy (SEM)
Surface Analysis Geometry
Analysis relies on striking the sample with an incident (primary) beam followed by detection of the emitted beam from the sample.
- Beam may consist of photons, electrons, ions, or neutral molecules.
- Primary and secondary beams can differ.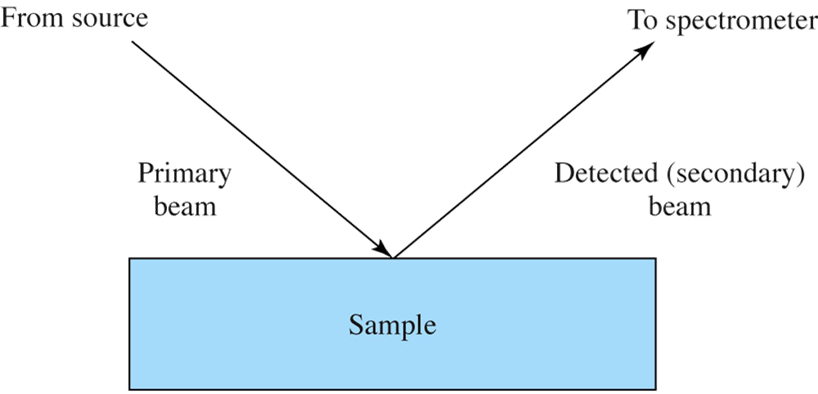
X-Ray Photoelectron Spectroscopy (XPS)
AKA Electron Spectroscopy for Chemical Analysis (ESCA).
Involves an X-ray beam that ejects electrons from core levels in atoms.
- An X-ray photon is also emitted during the process.The technique measures the kinetic energy of ejected electrons rather than fluorescence photons.
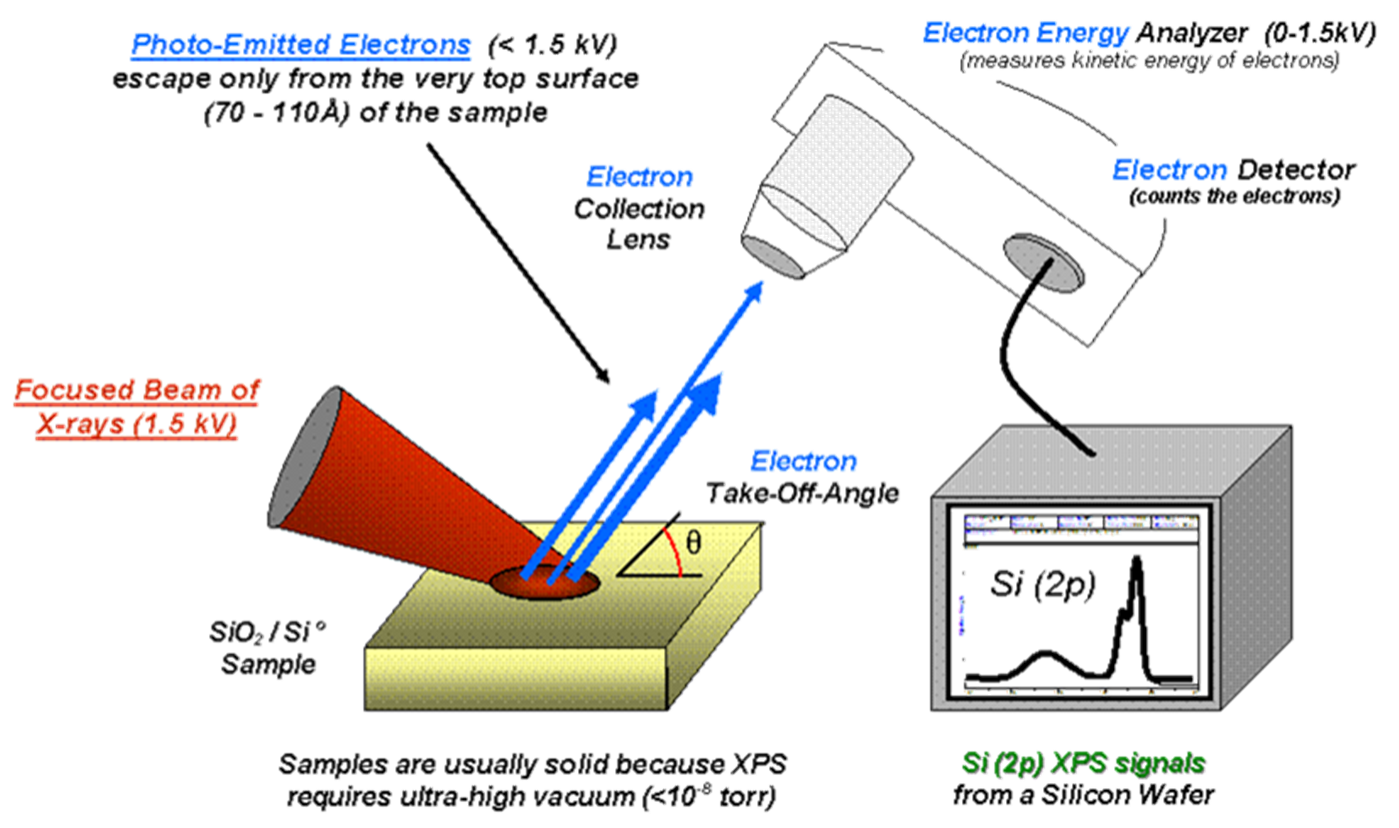
XPS Systems
Photo-Emitted Electrons: Electrons escape from the very top surface (70 - 110 Å) of the sample.
- Kinetic energy measured by an electron energy analyzer (0-1.5 kV).Uses a monochromatic X-ray source with a focused beam of X-rays (1.5 kV).
Requires ultra-high vacuum (UHV) conditions (10-9 torr) to prevent air from absorbing/scattering electrons and contamination.
The purpose of maintaining ultra-high vacuum (UHV) conditions is to ensure that the electrons emitted from the sample can travel directly to the detector without being scattered or absorbed by air molecules. In a vacuum, electrons can move unimpeded, allowing for accurate measurements and analysis of the sample's surface composition. This minimizes interference that could distort the results, leading to a clearer and more reliable understanding of the material being studied.- Limits analysis to solid samples. As a result, analyzing liquid or gaseous samples is not feasible under these conditions, since these states are prone to interaction with air and contamination, leading to unreliable results. Thus, UHV ensures that only solid samples can be accurately analyzed.
Understanding Binding Energy
Binding Energy (BE) relates to kinetic energy (KE) and can be analyzed using XPS.
Binding energy unique for different atoms, useful for identifying atoms. Each element has a unique binding energy, allowing analysts to identify which elements are present on the surface of a sample.
Quantitative Analysis: The measured binding energies can be correlated with the concentration of elements on the surface, providing quantitative data about the surface composition.
Key equations:
- EBE = hv-EKE-f
-f= work function
XPS Survey Scans
They cover a range of binding energies (250 – 1500 eV).
They are useful for initial identification of elements on the surface of a sample. By scanning across this range, researchers can detect the presence of elements and their approximate concentrations. Additionally, the obtained survey scans can reveal information about the oxidation states.
Elemental Identification Using XPS
Each element has unique EBE peaks in the XPS spectra.
Peaks correspond to core electron levels (e.g., 1s, 2p).
- Some overlapping peaks may occur (e.g., O(1s) and Al(2s, 2p)).In case of overlap, other non-overlapping peaks can be analyzed.
High-Resolution XPS
Involves longer count times and multiple scans over narrower binding energy ranges to focus on specific peaks.
Detects variations in binding energy due to chemical environments, termed "chemical shifts."
- A shift of 0.2 eV can be detected.
Chemical Shifts
Observed dependence of peak position on chemical environment.
- Influencing factors include:
- Valence electrons' number/oxidation state
- Type of chemical bonds
- Atoms bonded to the elementChemical shifts cataloged for various oxidation states of elements.
By measuring these shifts (based on reference point) and calculating the differences in binding energies, researchers can gain insights into the chemical states and bonding environments of the molecules in the material being studied.
Example: C-C bond at 285 eV compared to TMS in NMR
Bonds with highly electronegative groups, such as C-F bonds, are shifted to higher binding energies because bonds to EWG remove electron density from the atom. As a result, the electrons within the atom experience a larger effective nuclear charge, which increases the energy required to remove those electrons.
Structural Information from XPS
XPS can identify elemental composition and chemical bonding, aiding to NMR or IR spectroscopy.
Depth Profiling with XPS
- Sputtering removes surface layers or contaminants at constant rate with ion guns like Ar+.
Relative Intensities
Intensity related to concentration at the surface → higher intensities indicate greater concentrations of elements present
Probability of emission of core level of an atom is photoemission cross section (s, is measured and tabulated)
I=nfS (S is sensitivity factor)
Auger Electron Spectroscopy (AES)
Similar to XPS, same instrument but utilizes Auger electrons for analysis
Introduces the Auger process where the excited ion relaxes by ejecting another electron (Auger electron) or emitting a photon.
The energy of the Auger electron is independent of the energy of the exciting electron/X-ray
CON: The electron beam has a tendency to degrade polymers and organics
Secondary Ion Mass Spectrometry (SIMS)
Bombards surface with high-energy ions, ejecting neutral and charged species for mass analysis.
- Analyzes molecular fragments’ masses with secondary ions extracted by electric fields."secondary" refers to the ions that are ejected as a result of the bombardment primary ions.
Key Features of SIMS
Detects all elements, distinguishes isotopes, and provides high sensitivity.
Analysis in solid materials
Works on various scales, from quantitative chemical composition to surface structural analysis.
Types of SIMS
Static SIMS:
- Non-destructive, low sputter rate.
- Analyzes only sub-monolayer (part of the very top layer) quantities from the surface.Dynamic SIMS:
- Destructive, faster sputter rates; measures composition as a function of depth (similar to XPS but the material that is blast away is analyzed).Imaging SIMS:
- Provides imaging
Laser-Microprobe Mass Spectrometry
Like SIMS, the thin layer of the sample is blasted away from the surface and fed into a mass. spec.
Uses laser ablation for volatilizing samples with a laser.
Ion fragments are then fed into an MS
–Time of flight (ToF) most common
Achieves spatial resolution of about 1 µm and high sensitivity.
Commonly applied in analyzing Na/K in frog nerves, amino acids, and polymer surfaces.
Inorganic and organic samples
Example: MALDI-TOF
Scanning Electron Microscopy (SEM)
Incident high energy electron beam cause the sample to fluoresce and emit photons or electrons
Configured to produce high-resolution images and elemental analysis through high-energy electron beam interaction.
Image construction relies on backscattered and secondary electrons as well as X-ray fluorescence (XRF).
Unlike optical microscopy, the image from an SEM is not a “true image”
Samples must be conductive (to reduce charging) → Non-conductive samples require a thin coating of either Au or C
SEM Operation
Involves sweeping the surface in a raster pattern using focused electron beams, resulting in various detected signals.
Tungsten-filament Electron gun
Field emission gun
Beam Interaction with a Solid
Elastic Interaction: scattering of electrons without energy loss, resulting in a change of direction but not a change in wavelength, which allows for information about the atomic structure of the material to be obtained.
Inelastic Interaction: energy loss as the beam electrons transfer energy to the electrons in the material, resulting in electron excitation, ionization, and secondary electron emission.
SEM Signal Types
Backscattered Electrons:
- Charged electrons that lose energy through inelastic collisions.
- Provide information about the atomic number contrast.Secondary Electrons:
- Emitted from surface atoms (e of 50 eV or less), producing images with high spatial resolution.
Resulting SEM Images
Characteristic features observed as variations in atomic numbers; important for material analysis.
Elemental Composition via X-Ray Fluorescence (XRF)
Operates similarly to XPS, relying on electron impacts that cause photons to be emitted.
Electron Microprobe
Similar to SEM but primarily designed for chemical analysis using Energy Dispersive Spectroscopy (EDS) and Wavelength Dispersive Spectroscopy (WDS).
EDS can quickly identify elements by analyzing the energy levels of the emitted X-rays
WDS (more accurate) for elemental analysis by measuring the wavelengths of the emitted X-rays.
EDS Spectra Representation
Representation of various elements in a spectrum connected to respective energies (keV).