Macroeconomics
Types of Unemployment
Frictional
Occurs when someone new enters the labor market or is “in between jobs” but has employable skills and will likely gain employment in a short period of time
Structural
Caused by fundamental, underlying changes in the economy that can create job loss for skills that are no longer in demand (improvements in technology; globalization of industry)
Inevitable unemployment
Seasonal
Emerges as a periodic and predictable job loss that follows the character
Cyclical
Jobs that are gained and loss as the business cycle improves and worsens when the economy is expanding or contracting
Unemployment rate : Ration of unemployed to the total labor force
Unemployment Rate = (Unemployment population/Labor force) x 100
Seasonal Unemployment is unneeded
Shortcomings of Unemployment rate
Data does not include discouraged workers, a worker who has been unemployed for a period of time and has given up the search for a new job. They are NOT in labor force
UR (Unemployment rate) counts a person working part-time as employed, even if that person is seeking full-time work (underemployed)
UR counts a a person who has multiple jobs (maybe because they need additional money) the same as someone with one job
Unemployment data may understate actual unemployment. Pew research found this to be true particularly among women, Asian Americans, and immigrants
Incarcerated workers are not included in employment statistics, even though prison labor is a multi-billion dollar industry
Labor Force participation rate : Measures the percentage of the adult population in a country that is either employed or unemployed. This is the percentage of a population that are in the labor force
LFPR (( # of people employed and unemployed) / (Population)) x 100
The more LFPR declines, the more the unemployment rate understates the true levels of unemployment
Natural rate of unemployment : Level of unemployment that prevails when an economy is producing at full-employment level.
NRU includes only frictional and structural unemployment
This means that unemployment rate will never reach 0%, even at the full-employment level. There will always be some level of unemployment in an economy
True full employment (unemployment = 0%) is undesirable because it requires a completely inflexible labor market in the long run, where workers are unable to quit their current job or leave to find a better one
The NRU in the United States is thought to be between 4 and 6%
Circular Flow
National Accounts (known as national income and product accounts)
Keeps track of the spending of consumers, sales of producers, business investment spending, government purchases, and a variety of other flows of money among different sectors of the economy
Product and Factor markets
Product market: Where goods and services are bought and sold
Factor market: where resources, especially capital and labor are bought and sold
In the product market: Households demand, firms supply
In the factor market: households supply, firms demand
Simple vs. Expanded Circular Flow with two groups : households and firms
Injections and leakages add or remove money from circular flow of income in an economy
Leakages: Taxes, Imports, Spending
Business Cycle: Alteration between economic downturns and upturns in the macro economy is known as the Business cycle
ns and Troughs
The economy experiences occasional economic downturns known as recessions, periods in which output and employment are falling
The lowest point of a recession is called a trough of a business cycle
Expansions and Peaks
The trough is followed by an economic upturn- a period in which output and employment are rising- known as an expansion
The highest point of an expansion, just before the economy turns down again, is called the peak of a business cycle
Employment, Unemployment, and The Business Cycle
Although not as severe as depression, a recession is clearly an undesirable event. Like a depression, a recession leads to joblessness, reduced production, reduced incomes, and lower living standards
In general, during recessions the unemployment rate is rising, and during expansions it is falling
Actual Output vs. Potential Output
The full-employment level of output represents an economy’s potential output, the maximum level of output that could be produced using all available resources
Unlike actual GDP, potential output GDP cant be
The difference between actual and potential output is called the output gap
During expansionary periods we have a positive output gap meaning that actual output is higher than potential output
During recessionary periods we have a negative output gap, meaning that actual output is lower than potential output
The actual rate of unemployment equals the natural rate of unemployment when the economy is on the potential line
Market Economy: actors of production are privately owned and the decisions of individual producers and consumers largely determined what, how, and for whom we produce
Command Economy: the factors of production are publicly owned and a central authority makes production and consumption decisions
→ Government owns all factors of production and determine the prices of goods and services
→ Less “goal” to improve because there is no competition
Mixed Economy: Combines elements of market and command economies
→ Private Sector: Responsible for most production, and is allowed to seek profit
→ Public Sector: Regulates Businesses and may nationalize industries that provide a public good.
Production Possibilities Curve
Linear production possibilities curve (PPC) is a straight line that occurs when opportunity costs are constant. This means that the economy would have to give up the same amount of one good to produce an additional unit of another good
Synthesis:
Absolute Advantage: a country (person) has an absolute advantage in producing a good/service if the country can produce more output per worker than other countries (people)
Comparative Advantage: A country (person) has a comparative advantage in producing a good/service if its opportunity cost of producing the good/service is lower than other countries’ (people)
Specialization: A country will specialize in the task that it has a relative comparative advantage in
Terms of Trade: The rate at which one’s products exchange for those of another
Supply and Demand
Markets are where buyers and sellers are the same good or service interact. Markets vary in size and specificity.
Buyers demand, sellers supply
The supply and demand model demonstrates how supply behaves
Demand Curve: Shows relationship between quality demanded (QD) and price. It represents the sum of all the individual demand curves of all consumers in the market
The quantity demanded is the actual amount of a good or service consumers are willing to buy a given price
The law of demand says that ceteris paribus, a higher price for a good or service decreases the quantity demanded of that good or service.
Movement along the demand curve would be a change in the quantity demanded, arising from a change in the good’s price.
Shifters of Demand
Price of related goods or services (substitutes and Complements)
Income
Tastes
Future expectations
Number of consumers
Determinants of Supply:
Input prices
Technology
Expectations
Number of producers
Prices of related goods or substances
Supply and Demand Together
Equilibrium Price : price that balances supply and demand. On a graph, it is the price at which supply and demand intersect
Equilibrium Quantity: The quantity that balances supply and demand. On a graph, it is the quantity at which supply and demand intersect.
Circular Flow Model: Households provide factors of production, such as labor, capital, and resources to businesses in the factor market in exchange for income. Businesses, in turn, use these factors to produce goods and services, which they sell to households in the product market
In a simple circular flow diagram we assume an economy only contains two groups: households and firms
Injections : add
Leakage: remove
Expenditure Approach : CIGX
Consumption expenditure
Private investment
Government expenditure
Net exports
Income approach: WIRP
Wage
Interest
Rent
Profit
Nominal GDP: Measures the value of a nation’s output expressed in the value of the prices charged for that year
Nominal GDP does not adjust for inflation
Nominal GDP = Current Prices x Current Quantity of Output
Real GDP: Measures actual value of nation’s output expressed in the value of prices charged at base year
Real GDP adjusts for inflation
Real GDP = Base Year Prices x Current Quantity of output
When Price levels increase (inflation), nomain GDP overestimates the value of output compared to real output
When price levels decease (deflation), nominal GDP underestimates the value of real output compared to actual output
GDP Deflator = (Nominal GDP/Real GDP) x 100
Shortcomings of Unemployment Rate
Data does not include discouraged workers, a worker who has been unemployed for a period of time and has given up the search for a new job. They are NOT in the labor fforce
UR counts as a person working part time even if that person is seeking full time work (underemployed)
Natural Rate of Unemployment (NRU) is the level of unemployment that prevails when an economy is producing at full-employment level
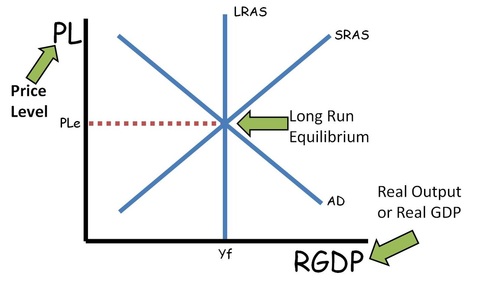
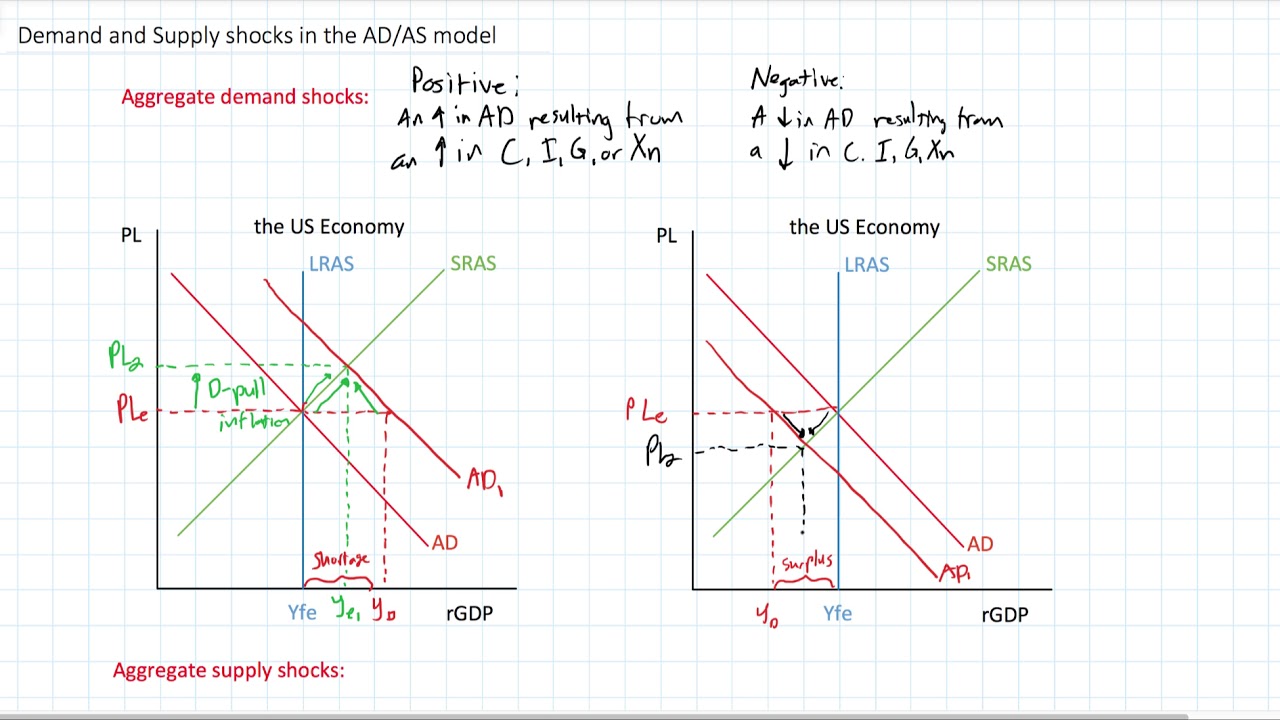
AD-AS Model: Model provides an aggregate picture of the macroeconomy and allows economists to predict how GDP, inflation, and unemployment are affected by external factors and government policies
Aggregate - “Added all together”
Aggregate Demand: All the goods and services that buyers are willing and able to purchase at different price levels
Shows the relationship between aggregate price level and the quantity of aggregate output demanded by households, businesses, the government, and the rest of the world
Aggregate Supply: All the goods and services that firms will produce in an economy at different price levels
Short-run aggregate supply shows the positive relationship between PL and the quantity of aggregate output supplied that exists in the SR, the time period when production costs are fixed
Long-Run Aggregate supply shows the relationship between PL and the quantity of aggregate output supplied that would exist if all prices, including nominal wages, are fully flexible.
Real Wealth Effect: economic phenomenon where consumers tend to spend more when the overall price level in an economy falls, marketing their existing money more valuable and essentially making them feel wealthier.
Interest Rate Effect: When price level is high (high inflation is occurring) lenders of fixed interest rate loans need to raise their interest rates in order to maximize benefit on the deal. > Consumers and businesses have less disposable income leading to lower rGDP
AD is the quanity of domestically produced final goods and services demanded during a given period by individuals, firms, government, and the world (CIGX)
Investment Spending:
Interest Rates
Expectations
Technology
Government regulation and business taxes
Fiscal policy plays a crucial role in shaping economic activity, influencing consumer spending, and investment decisions through government spending and taxation.
Net Exports (Exports-imports)
Fiscal policy: Actions by Congress to stabilize the economy: Spend and Tax
Montetary Policy: Actions by the federal reserve bank to stabilize the economy.
Expansionary Fiscal Policy increases aggregate demand
Increase in government spending
Cut in taxes
Increase in government transfers
Contradictionary Fiscal Policy reduces aggregate demand
Decrease in government spending
Increase in taxes
Reduction in government transfers
Ability to adjust spending, taxes, and transfer payments
Discretionary FIscal Policy
Congress creates new bill that is designed to change AD through government spending or taxation
Non discretionary fiscal policy
Permanent spending or taxation
Automatic Stabilizers are features fo the tax and transfer systesm that temper the economy when it overheats and stimulates the economy when it slumps, without direct intervention by policymakers
Interest on debt
Usually <10 percent all funding
Marginal Propensity to Consume (MPC) = Change in consumer spending / Change in disposable outcome
—> Increase in consumer spending when your disposable income rises
Disposable income : Money that an individual or household has to spend/save after federal, state, and local taxes and other mandatory charges are deducted.
If MPC increases, MPS decreases
If MPC decreases, MPS increases
MPC and MPS have a direct relationship ; as one rises, the other falls, indicating that changes in consumption behavior significantly impact savings rates within the economy.
Expenditure (Spending) Multiplier → Used to calculate total change to GDP due to an increase or decrease in government spending
Tax Multiplier → used to calculate total change to GDP due to an increase or decreasei in tax rates or transfer payments
Expenditure Multiplier = 1/(1-MPC)
Tax Multiplier = MPC/MPS
Government spending has a larger impact on GDP then taxes
LRAS is a vertical line bc:
In the long run, all resources are being used fully and efficiently. Unless more resources become available, aggregate demand will stay the same
Real profits remain the same, as workers demand higher wages to match higher pl.
SRAS:
P→ Productivity
E → Expectations of inflation
A → Actions by Government (taxes, subsides)
R → Resources prices
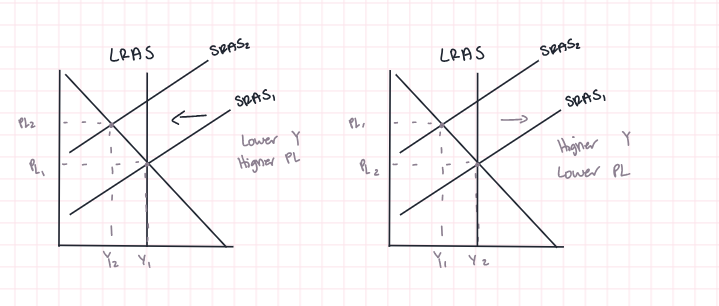
Negative Supply Shock : Lower employment, Stagflation. Lower Y and Higher PL
Positive Supply Shock : Higher Employment. Higher Y and Lower PL
Changes in the Factors of production → Shifters of the LRAS are the same as shifters of the PPC
Long-Run Adjustment: In absence of government intervention, the economy self corrects itself in a variety of ways. Always Shift in SRAS
In the long run, this self-correction can occur through changes in resource prices, wage adjustments, or shifts in consumer demand, ultimately leading to a new equilibrium.
This process highlights the economy's inherent flexibility and resilience, allowing it to adapt to shocks and return to potential output.
Shocks → Makes the entire economy less productive and the entire capacity of the economy will decrease. In this case, LRAS will shift to the left. Because production costs are now higher, SRAS will also decrease and output will be permanently lower, leading to a permanently higher level
Recessionary Gaps: Situation where economy is producing within its Production Possibilities frontier.
Inflationary Gaps: Positive output gap thus inflation. This then causes workers to ask for an increase in wages and cause supply to go down
Spending multiplier : Measures the total change in rGDP that occurs with a certain change in government spending
Tax multiplier: Measures the total change in rGDP that occurs with a certain change in taxes
The Financial System:
Money, banks, and the financial system are vital tools and institutions for an economy
Financial system as the circulatory system of the economy.
Banks deliver money throughout the economy ensuring people who can and need to borrow are able to do so
Financial Assets :
Typically represent a contractual agreement between the issuer and the buyer
Guarantee of ownership over a company (stocks) or guarantee of ownership over a company (stocks) or a guarantee of set interest payments (bonds and specialized bank accounts)
Types of Financial Assets
Stocks
Bonds
Loans
Bank deposits
A bond is an interest-bearing asset issued by a business or government
Loans are the process of borrowing money and repaying it back with interest
Suppliers of Capital → people, businesses, and governments that have extra income and choose to put that money (capital) into the financial system so that they can earn a rate of return on their capital
Demanders of Capital → people, businesses, and government that need extra money (capital):
An individual borrows money from the bank to buy a house
A firm issues a bond to expand production
A firm issues stock to expand production
Local government issues bond to improve roads
The federal government issues a bond to finance spending
Financial Markets (Stock, Bond, Currency, Exct) bring together the suppliers of capital and demanders of capital. In these markets, financial securities/assets are traded
Financial asset (securities / instruments) : An investment asset whose value is derived from a contractual claim of what they represent. These are liquid assets that can be converted into cash
Financial intermediaries (institutions) act to process transactions between suppliers of capital and demanders of capital when it is not optimal/efficient
Regulators of the financial system
Securities and exchange commission
State
Role of Banks
Money is what allows our everyday exchanges to happen- but its important to ensure that money is able to flow throughout the economy so that those who need money are able toget it - role of banks
Role of banks - people can place their money in savings or checking accounts..ensuring their money is safe
Banks also make profit - banks charge higher interest on these loans than they apply to savings accounts
Retail Banks: Retail Banks focus on consumers as customers
Commercial Banks: These banks focus on businesses as customers
Investment banks: Investment banks help businesses raise money in financial markets
Central Banks: In the US the Federal Reserve manages the monetary system and supervises banks
Federal Reserve (The Fed) is the central bank for the US of America. The AP switches between both terms relatively interchangeably
Real Interest rate = nominal interest rate - inflation (actual or expected)
Who is affected by changes in Real Interest Rate
Depositors are not the only ones who need to consider inflation rates. Lenders must also consider inflation and what they expect inflation to be, when giving out a loan.
Unexpected increases in inflation benefit borrowers and hurt lenders. Conversely, unexpected drops in inflation benefit lenders and hurt borrowers
Nominal interest rate is the interest rate actually paid for a loan.
Real interest rate is the nominal interest rate adjusted for inflation
Real interest rate = nominal interest rate - inflation
Nominal interest rate = real interest rate + inflation
Test topics:
Functions/components of money
Commodity vs. Fiat money
types of assets
Interest rates
Expected vs. actual inflation
Types of Assets:
Stocks
Stocks are a security that gives you “ownership” in a company
It represents your claim of ownership of the firm you paid for. Firms raise money with capital invesment by selling stocks for partial ownership
Bonds
An interest-bearing asset issued by a buisness or government
When a firm wants to raise money, it’ll issue a bond that promises the holder it’ll give back the same amount plus interst
Loans
Process of borrowing money and replaying it back with interst
Bank deposits
Refer to the money in your bank account
Functions of Money
Medium of Exchange
Asset used to exchange goods and services
Replaced bartering. No need for a double coincidence of wants
Needs to be readily acceptable, easily divisible, portable, and difficult to counterfeit
Store of Value
Money can be stored, retrieved, and used at a later time
Commodity money has intrinsic value, includes precious metals such as gold or silver
Unit of Account
Money is a measure of value denoted in denominations
Ex. $100 dollar bills
Standard of Deferred Payment
Can be used as credit, allows transactions to be settled in the future
Interest + Inflation
Real Interest rate = nominal interest rate - inflation (actual or expected)
Nominal interest rate is the rate the bank sets (unadjusted)
Real Interest Rate is the nominal interest rate adjusted for inflation
Unexpected increases in inflation benefit borrowers and hurt lenders
Conversely, unexpected drops in inflation benefit lenders and hurt borrowers
Demanders of Capital (borrowers) want a low interest rate (cheaper to borrow money)
The suppliers of Capital (lenders) want a high interest rate (More profit)
Expected vs. Actual inflation
Unexpected inflation increase = Borrowers ❤ , lenders 💔
Unexpected inflation decrease = Borrowers 💔, lenders ❤
M1 “Narrow Money”
Money in circulation + demand deposits (check able deposits in banks)
M2 “Money and close substitutes”
M1 + savings deposits under 100,000 money market funds
M3 “Broad Money”
M2 + Large time deposits in banks + institutional money market funds (as well as short term repurchase agreements and other large liquid assets
Fractional reserve banking system : Money that is really easy for them to take out
Money Supply
Sum total of all the currency and other liquid assets in a country’s economy
Money supply includes all cash in circulation and all bank deposits that the account holder can easily convert to cash
Fed : Policy-making body that regulates the money supply
Monetary Base: M0 = Bank reserves + Cash in circulation
Money Supply:
M1 = Cash in circulation + Check able Bank deposits (demand deposits) + Savings Accounts
M2 = M1 + Small CDs + Money Market Mutual Funds
M2 is sometimes referred to as “near-money's”
M3 = M2 + Large time deposits in banks + Institutional Money Market Funds (as well as short-term repurchase agreements and other large liquid assets)
Money supply is important because it has a powerful effect on economic activity
Increase in supply of money lowers interest rates and spurs investment, while a decrease in the supply of money increases interest rate and slows investment
Loans impact Money Supply
The MS can increase by taking the amount loaned out $90 x Money Multiplier
Demand Depoists The original
Demand Deposit $100 x Money Multiplier
Monetary Policy
Discount rate
interest on required and excess reservers
open market operations
overnight erserve repurchase agreements
reserve requirements
term depoist facility
Payment Services
Electronic payments
check collection + Cash services
Fiscal Angent for the US treasury
Bankers bank
Funds transfers
Supervision and Regulation
Regulations
Bank exams
Stress tests
Safety and soundness
The federal Reserve sets its policies to promote the following two conditions:
Maximum Employment
Price Stability : A target inflation rate of 2%
Moderate, Long term interest rates
The FED users 3 tools to control/influence the money supply:
The Reserve Requirement
How much money banks must hold after deposits are made
The Discount Rate
The interest rate charged by central banks on loans they give to commercial banks
Open market operations
The buying and selling of bonds
The Demand for Money:
The demand for Money refers to the desire or need to hold liquid assets (such as cash) interest in having illiquid assets (such as stocks). Various factors influence the demand for money with some examples being: interest rates, income levels
Shifters of Money Demand Curve
Price Level
RGDP
Transaction Costs
Change in laws
Expectations
Change in Credit markets
Changes in the Money supply by the federal Reserve
Ex: Federal Reserve increases money supply, money supply will shift right
To stimulate the economy, the Feds will lower its federal funds rate target
To slow the economy, the feds will raise its Federal Funds target
The federal Funds rate is a specific number
In other countries, this is called the Policy Rate
Interest rate: Cost of borrowing more money

Federal Funds rate: The interest rate that financial institutions charge each other for loans in the overnight market for resource
Open Market Operations: The purchase and sale of U.S. Treasury securities in the open market by the central bank in order to regulate the supply of money that is on reserve in U.S. Banks
Discount Rate: The interest rate of the Fed charges commercial banks to borrow funds on a short term basis. The level of the discount rate is set above the federal funds rate target, and thus serves as a backup source of funding for depository institutions.
To stimulate the economy, the Feds should lower the discount rate
To slow the economy, the Feds should raise the discount rate
This will always be above the Federal Funds rate (Policy Rate)
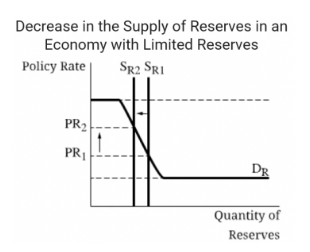
As the supply of reserves decreases by the Fed selling bonds, then interest rates will rise, as shown to the left. The opposite is also true – if the Fed buys bonds from the banks, the supply of reserves will increase and shift to the right, and the interest rates will decrease.
Setting Monetary Policy
Federal Funds rate : The interest rate that financial institutions charge each other for loans.
Implementing Monetary Policy: The Feds Policy Toolkit
Reserve Requirements: Sets the percentage of deposits that are required as reserves, to be held either as cash on hand or as account balances.
Open Market Operations: The purchase and sale of U.S. Treasury securities in the open market by the central bank in order to regulate the supply of money that is on reserve in U.S. banks
Discount rate: The interest rate the Fed charges commercial banks to borrow funds on a short term basis. This acts as a ceiling above the fed funds rate.
Interest on required and excess reserves: The interest rate paid on excess reserves. This acts like a floor beneath the federal funds rate.
overnight reserve repurchase agreements: The purchase of securities with the agreement to sell them at a high price at a specific future date. It is used to raise short-term capital.
Nontraditional and Crisis Tools: Ex. Purchasing a very large amount of assets such as Treasury securities, federal agency debt, and federal agency mortgage-backed securities (2008); Opened lending facilities (Covid)
Loanable Funds
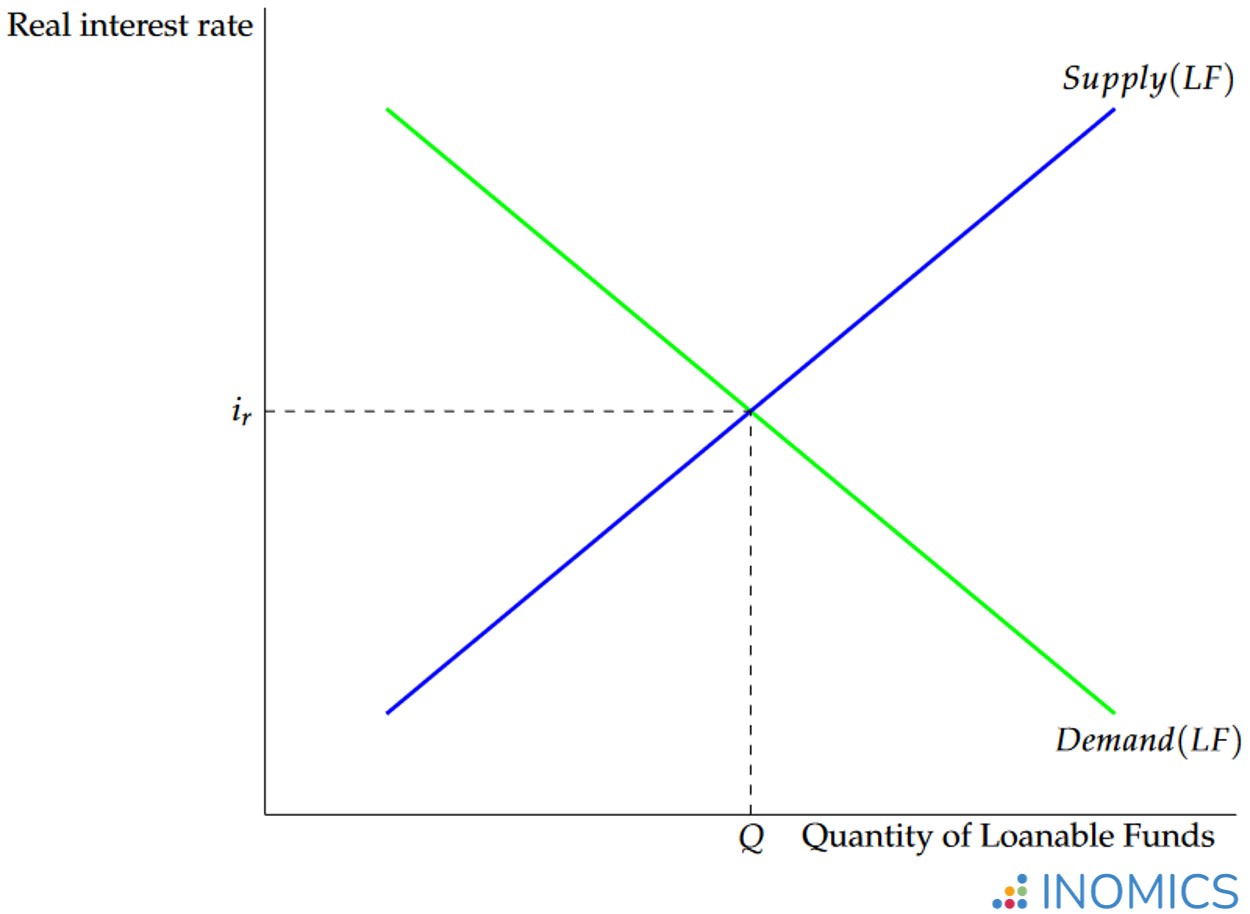
The Lonable FUnds market brings together savers and borrowers, illustrating the demand for funds generated by borrowers and the supply of funds provided by lenders.
Supply - The supply of lonable funds represents the behavior of savers. Higher interest rates shift qs to the right, as individuals are more likely to save
Demand - The demand for lonable funds represents the behavior of borrowers and the quantity of loans demanded. Lower interest rates shift qd to the right
Saving and Supply
private savings: Household savings
Public saving: Government savings
National savings: Public and Private Savings
→ A change in national savings will shift the supply of lonable funds
Foreigners and Supply
Capital Inflow: The amount of money entering the country
Capital Outflow: The amount of money leaving the country
Net capital inflow: Inflow - outflow
A change in net capital inflow will shift the supply of lonable
The Fed and Monetary Policy
Only Monetary Policy can change the MS Curve.
If a question tells you that Monetary policy is being conducted by the Fed, you know that MS is shifted.
Content: The Money Supply
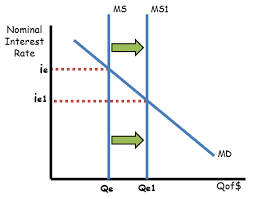
When Nominal Interest decreases (Shift their wealth out of non-money interest-bearing financial assets and raise their money holdsings) investors will drive the interest rate up by IRe
When Nominal Interest rate increases (Shift their wealth into non-money interestbearing financial assets and decrease their money holdings), investors will drive the interest rate down to the IRe
Changes in Aggregate Price Level
Demand for money is proportional to the price level
If PL (Price level) rises by 20%, quantity of money demanded at a given interest rate also rises by 20%. It takes 20% more money to buy the same basket of goods and services
If prices INCREASE then money demands DECREASE
Changes in Real GDP
An increase in real GDP shifts the money demand curve rightward
The larger the quantity of goods/services there is to buy, the larger the quantity of money people will want to hold.
Changes in Credit markets + Banking tech
The invention of credit cards has drastically decreased the demand for money - people do not need to hold cash anymore!
Apple pay has and will continue to decrease MD
People can leave their funds in interest-bearing assets
Changes in institutions and Laws
Ex. In 1980, Govt’t law said banks can’t offer interest rates no checking accounts.
F- Foreign Demand for Domestic Currency
A - All borrowing, lending, and credit
D - Deficit spending
Gov’t spending more then it brings in from taxes
Borrowing from Banks
E - expectations for the future
Shifters of Supply:
S - Savings Rate
E - Expectations for the future
L - Lending at the Discount Window
F- Foreign purchases of domestic assets
Debrief: Monetary Policy Synthesis
Note: Lonable Funds Market Brings borrowers and savers together
Demand → Borrowers
Supply → Savers
Increase in MS → Decrease in Nominal Interest → Increase in (investment and consumer spending) → Decrease Savings → AD Increase → GDP Increase → PL Decrease
Decrease in MS → Increase in Nominal Interest → Decrease in (investment and consumer spending) → Increase Savings → AD Decrease → GDP Decrease → PL Increase
Negative Demand Shop → Less consumer spending thus less people are working
Positive Demand Shop → More consumer spending thus more people working
Expansionary Fiscal Policy - Increases AD — shift right
Increase in gov’t spending
Cut in taxes
Increase in gov’t transfers
Contradictory Fiscal Policy - reduces AD (shift left)
Decrease in gov’t spending
Increase in taxes
Reduction in gov’t transfers
Fiscal Policy will shift the Aggregate Demand Curve
Think:
1) Is this good or bad for buisness
2) If bad, will shift left
Demand Pull: AD shifts right
Cost-Push: SRAS shifts left
The shifters of LRAS
Entrepreneurship
Federal Reserve System
The Federal Funds Rate: The interest rate that financial institutions charge each other for loans in the overnight market for reserves
The Federal Funds Rate is a specific number.
In other countries, this is called the Policy Rate
Buy Big: To stimulate the economy, the Fed will buy securities
Buying securities increases bank reserves → Increases bank loans → Increase MS → Lowers IR → Increases Consumer / Bushiness Spending → Increases AD → Increases Inflationary Pressure
Discount Rate: This will always be above the federal Funds Rate(Policy Rate)
Note: “Administered Interest Rates” refers to the FED (central Bank) Changing Fed Funds/Discount Rate
Setting Monetary Policy:
The Federal Funds Rate: The interest rate that financial institutions charge each other for loans
Impleneting Monetary Policy: The Fed’s policy toolkit
Reserve Requirements: Sets the percentage of deposits that are required as reserves, to be held either as cash on hand or as account balances
Open Market Operations: The purchase and
Interest on Required and Excess Reserves: The Interest rate paid on excess reserves. This acts like a floor beneath the federal Funds rate
If PR increases → MS decreases
If Fed Funds Rate Increases → Ms decreases
Buy securities → MS increase
Sell Securities → MS decrease
If Discount Rate Increases → MS decreases
If Interest on reserves increase → MS decreases
If Nominal GDP increases, Money Demand increases
Real GDP Decreases, MD Decreases
Inflation Increases, MD increases
Decrease in money supply
Contractionary Money Supply
Money Demand Curve: Shifters
Changes in Aggregate Price Level
The demand for money is proportional to the price level
if price level rises by 20%, quanity of money demanded at a given interest rate also rises by 20% . it takes 20%
fiscal policy shifts aggregate demand
Changes in Real GDP
Changes in Credit market + banking tech
Changes in institutions and laws
Changes in Income
An increase in real income leads to an increase in MD
MD → refers to the desire to hold liquid currency
Loanable Funds Market
Monetary Policy → Central Bank
Fiscal Policy → Gov’t
Note: When Defecit Spending increases, Demandable Loanable Funds (DLF) increases
Note: When Savings rate increases, Savable Lonable Funds increase
C* = Consumer Spending on interest-sensitive products:
Ex: Taking out loan to buy a car
Note: Investment spending refers to business buying capital goods (machines)
Note-Note: They normally take out loans to do this
Monetary Policy Synthesis
Increase in MS → Decrease in Nominal Interest → Increase in (investment and consumer spending) → Decrease Savings → AD Increase → GDP Increase → PL Increase
Decrease in MS → Increase in Nominal Interest → Decrease in (investment and consumer spending) → Increase Savings → AD Decrease → GDP Decrease → PL Decrease
To find change in Money Supply based on sale/purchase of securities:
Total Change = initial sale or purchase * money multiplier
Long Run
Phillips Curve:
Shift in AD, Inflation and unemployment move in opposite directions (inverse)
Positive Demand Shock
Unemployment falls (Bc GDP increases)
Price level Rises
When we have a shift in SRAS, Inflation and Unemployment move in the same direction
Negative Demand Shock
Unemployment rises (GDP decreases)
Price level falls
The Short run Phillips curve is the negative relationship between the unemployment rate and the inflation. An economy is always operating somewhere along the SRPC.
Aggregate Demand Shocks correspond to movement along the SRPC
AD Shifts : Movement along SRPC
AD Right = movement on SRPC
SRAS Shifts = SRPC Shift
SRAS Right = SRPC Left
SRAS = short-run aggregate supply
SRPC = Short-Run Aggregate Supply
Inflationary Expectations shift the SRAS curve - An increase in expected inflation shifts the SRAS curve to the left and the SRPC to the right…A decrease in expected inflation shifts the SRAS curve to the right and the SRPC to the left
The long-run Phillips Curve shows the relationship between unemployment and ifnlation after expectations of inflation had time to adjust to experience
LRPC is vertical at the natural rate of unemployment because output will always return to its full-employment level once wages/prices have adjusted in the LR
Points to the left of LR equilibrium represent inflation gaps; points to the right represent recessionary gaps
Factors that cause the natural rate of unemployment(changes to characteristics of the labor force, government policies, etc.) to change will cause the LRPC to shift