Physio
Block 8 - Lecture 15 & 16 (Cardiac 1&2) - Chan
Cardiac 1
- Describe the structure and function of the heart and the vessels
- Cardiomyocyte: striated, stimulated by AP, troponin, involuntary, intercalated discs & gap junctions
- Heart: 4 chambers, large veins (SVC & IVC → RA; pulmonary veins → LA), large arteries (RV → pulmonary arteries; LV → aorta); AV valves, semilunar valves
- Left heart = systemic circulation & right heart = pulmonary circulation
- Cardiac output (CO) = distributed among various organs via parallel arteries
- 25% → renal, 25% → MSK, 25% → GI, 5% → coronary, 15% → cerebral, 5% → skin
- Venous return (VR): VR of L heart = VR of R heart in steady state
- Steady state: CO = VR; [CO of LV = CO of RV in a steady state; VR equal in L and R heart]
- Arterioles & venules meet @ capillaries (very high SA; single endothelial cell; site of substance exchange)
- Arterioles: blood pressure regulation
- Most of blood volume → venous system
- Describe the electromechanical activity of the heart
- Em maintenance
- Passive mechanisms:
- Permeability K+ >> Na+ at rest (more K+ channels)
- K+ concentration gradient
- Non diffusible intracellular anions from negatively charged proteins
- Active mechanisms:
- Na+ K+ ATPase
- Resting potential: K+ channels open, but Na+ and Ca++ closed → Hyperpolarization
- Action potential: Na+ & Ca++ open → Depolarization; K+ open → Repolarization
- Em maintenance
- Contrast pacemaker vs. non pacemaker action potentials
- Pacemaker cells: Unstable resting potentials, more negative than cardiac muscle, spontaneous depolarization/repolarization
- SA node (60-100 BPM, Em= -55 to -60 mV, native pacemaker → overdrive suppression)
- AV node (40-60 BPM)
- Bundle of His (40 BPM)
- Purkinje fibers (15-20 BPM)
- Non-pacemaker cells: Stable resting potential; prolonged depolarization sustained by Ca++ influx
- Pacemaker cells: Unstable resting potentials, more negative than cardiac muscle, spontaneous depolarization/repolarization
- Describe the ionic basis for cardiac action potential
- Non-pacemaker cells: 0 - 1 - 2 - 3 - 4
- 0: Rapid depolarization: VG Na+ channels open, Na+ influx
- 1: Initial repolarization: VG Na+ inactivate, K+ efflux (Kto)
- 2: Plateau: VG Ca++ open, Ca++ influx → ventricles contract
- 3: Repolarization: VG K+ open, K+ efflux
- 4: Rest: outward K+ current
- Pacemaker cells: 4 - 0 - 3 - 4
- 4: Diastolic/spontaneous depolarization: cation influx (Na+ via funny channels)
- 0: Slow depolarization: VG Ca++ channels, Ca++ influx
- 3: Repolarization: K+ efflux → Maximum diastolic potential (-65 mV)
- Non-pacemaker cells: 0 - 1 - 2 - 3 - 4
- Describe the dual innervation to the cardiac system involving the ANS
- SANS: NE → + B1 adrenergic R (Gs/GPCR)→ increase cAMP
- Increase in cAMP:
- Increase HCN → increased Na+ influx & rate of phase 4 depolarization
- Increase phosphorylation of Ca+ channel, Ca++ influx → moves threshold toward Vm
- OVERALL: Increased HR, increased rate of conduction through AV node
- PANS: ACh → +M2 receptors (Gi/GPCR) → decrease cAMP →
- ACh → increase muscarinic K+ channel efflux → negative shift in Vm
- Decrease in cAMP leads to:
- decrease HCN → decrease Na+ influx & rate of phase 4 depolarization
- decrease Ca+ channel phosphorylation → less Ca+ → AP threshold moves away from Vm
- RESULT: decreased HR, decreased rate of conduction through AV node
- SANS: NE → + B1 adrenergic R (Gs/GPCR)→ increase cAMP
- Describe pathology that affects pacemaker function and potential
| Increase HR | Decrease HR | |
|---|---|---|
| Drugs | Beta adrenergic agonists | Beta adrenergic antagonists |
| Digoxin | ||
| Hormones | Hyperthyroidism (High T3, T4) | Hypothyroidism (Low T3, T4) |
| Catecholamines (epinephrine) | ||
| Ions | Hypokalemia (hyperpolarizes cell) | Hyperkalemia |
**Anti-arrhythmic drugs: can block Na+, K+, or Ca++ channels
- Heart too slow → atropine
- Heart too fast (SVT) → adenosine
- Beta blockers also decrease heart rate
**Hyperkalemia: high extracellular K+ depolarizes the cell & decreases the full activation of If 7. Describe the propagation and spread of heart cell depolarization
- Ca++ triggers contraction → intercalated discs/connexons (propagated throughout cardiac muscle because of syncytial organization)
- Excitation-contraction coupling in cardiac muscle: Calcium mediated calcium release (Ca++ enters via L type VG Ca++ channels → triggers release of Ca++ from SR → muscle contraction)
- Increase [Ca++]i → contracted sarcomere
- Decrease [Ca++]i → relaxed sarcomere
- Describe the cardiac electrophysiology involved in varied cardiac rhythm involved in pathology
- Death of pacemaker → bradyarrhythmia (blood pressure can not be maintained); can lead to sudden death
- Tachyarrhythmia - blood pressure can not be maintained → syncope, sudden death
- V fib
- V tach
- Torsades de pointes
Cardiac 2
- Explain the function of gap junctions
- Electrical activity (movement of ions & current flow) in cardiac cells transmitted to neighboring cells via intercalated disks
- Intercalated disks contain:
- Gap junctions (low resistance connections found between cells)
- Connexins (channels formed by proteins in gap junctions)
- Desmosomes (firm mechanical attachments)
- Electrical activity (movement of ions & current flow) in cardiac cells transmitted to neighboring cells via intercalated disks
- Discuss the different phases of non pacemaker action potentials
- Non-pacemaker cells: Stable resting potential; prolonged depolarization sustained by Ca++ influx
- Phases: 0-1-2-3-4 0: Rapid depolarization: VG Na+ channels open, Na+ influx 1: Initial repolarization: VG Na+ inactivate, K+ efflux (Kto) 2: Plateau: VG Ca++ open, Ca++ influx → ventricles contract 3: Repolarization: VG K+ open, K+ efflux 4: Rest: outward K+ current
- Non-pacemaker cells: Stable resting potential; prolonged depolarization sustained by Ca++ influx
- Describe and list the components in the myocyte conduction pathway
- SA node → AV node (via internodal pathway) + left atrium (via interatrial tract/Bachman’s bundle → Bundle of His → Left and right bundle branches → Purkinje fibers
1. SA node 2. Atria 3. AV node 4. Bundle of His 5. Purkinje system 6. Ventricles
Physiologic basis for conduction: local currents & gap junctions
Conduction through the atria * Ends of SA node fibers → directly connect w/ surrounding atrial muscle fibers * Velocity ~ 0.3 m/s [some fibers as fast as 1 m/s & more similar to Purkinje fibers] * Faster fibers located in internodal pathways & interatrial band to left atrium
Conduction through the AV node * Slowed conduction allows for ventricular filling & coronary circulation * Occurs due to decreasing # of gap junctions between successive fibers * Increases resistance to flow of ions
AV delay
1. Impulse arrives 0.03 s after origin in SA node 2. 0.09 s in AV node before impulse → Bundle of His (running total 0.12 s) 3. Another 0.04 s delay in Bundle of His (0.16 s)
Conduction through Bundle of His * Delay of 0.04 seconds * AV bundle: only tissue continuous between atria and ventricles (everywhere else surrounded by fibrous tissue) * Atrioventricular fibrous tissue = barrier between atria & ventricles; acts as insulator (prevents passage of impulse between them except through AV bundle)
Conduction through ventricles * Gap junctions → rapid conduction * Purkinje system → most rapid conduction @ 1.5 - 4 m/sec * Once impulse reaches the end of the Purkinje fibers → thru ventricular muscle mass via muscle fibers (slows down 0.3 - 0.5 m/s) * Slowest: AV node to allow for ventricular filling * Fastest: Purkinje fibers (gap junctions, ventricular muscle contracts as syncytium)
- Discuss different types of blocks in the myocyte pathway
- Heart rate = electrical & mechanical component
- Electrical component: regulates timing of mechanical component
- Ex. excitation-contraction coupling
- Cardiac arrhythmias → defects in electrical component (timing)
- Heart failure → defects in mechanical component (pump not functioning)
- Cardiac arrhythmias are caused by altered impulse formation, altered impulse conduction, or both altered impulse conduction/formation
- 3 types
- Re-entry or Circus movements
- Conduction block
- Caused by ischemia/scarred/refractory tissue (disease) which blocks SA nodal impulse conduction
- Latent pacemakers take over → bradycardia
- Symptomatic bradycardia tx w/ atropine → block effects of ACh on nodal tissue @ M2 receptors
- Accessory pathways
- Heart rate = electrical & mechanical component
*AV nodal blocks: most clinically significant heart block (conduction block can also occur @ Bundle of His or at left or right bundle branches)
- 1st degree AV block
- Delayed conduction through AV node
- Still has sinus rhythm
2nd degree AV block * Some atrial AP do not conduct into ventricles (dropped beat) * May be 2-3 depolarizations/ventricular depolarization * Results in ventricular bradycardia (not all AP reaching ventricles); tx: antiarrhythmics
3rd degree AV block * Most severe; impulses not reaching the ventricles → complete dissociated between atrial (P waves) and ventricular (QRS) depolarizations/contractions * Latent pacemakers take over (Purkinje fibers: rate 30 BPM) ⇒ ventricular bradycardia
- Explain different types of abnormal conduction caused by ectopic foci
- Ectopic foci = when other cells become pacemakers
- Purkinje can take over ⇒ much slower
- Diseased areas can become ectopic foci & if they fire at a faster rate → overcome SA node ⇒ rapid abnormal heart rate
- On ECG → Wide QRS + PVCs (premature ventricular complexes)
- Ectopic foci = when other cells become pacemakers
%%Block 9: Cardiac 3 - Riskin%%
- Explain the function of an electrocardiogram (ECG)
- Taking a picture of the hearts electrical activity; wave of positive charge
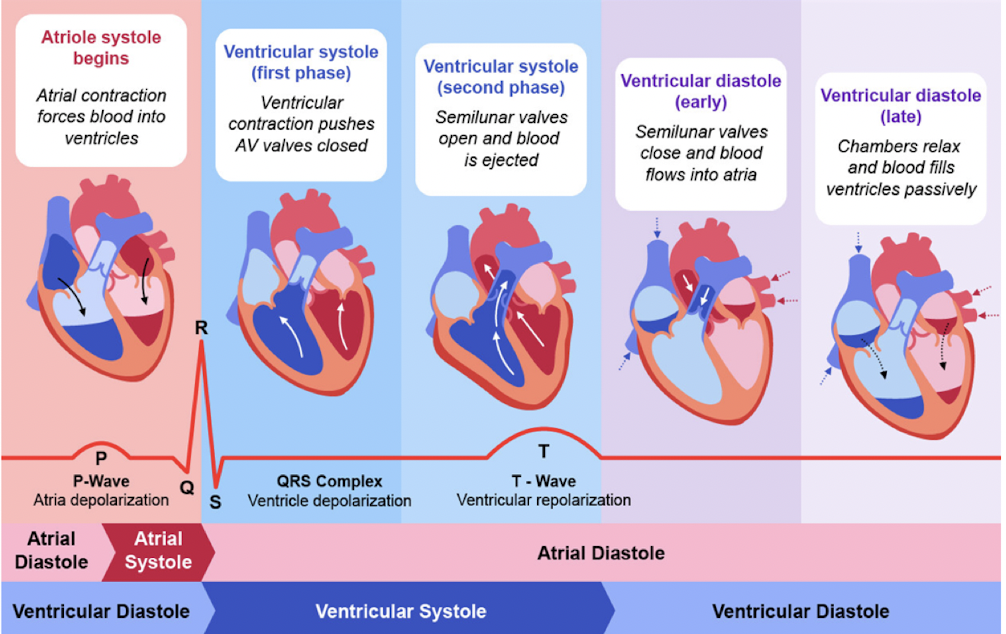
- Describe the sequence of ventricular depolarization
- Starting point: SA node → primary pacemaker Depolarization wave occurs → P wave
- Have a slight delay in the AV node
- Start of the QRS complex Starts with a small downward deflection Depolarization of the septum of the heart from L → R (small negative reflection → Q) Negative deflection → small positive force traveling towards negative pole
- Depolarization towards the apex of the heart (positive deflection → R) Have large vector traveling towards the positive pole
- Depolarization of LV→ towards baseline (S) Once completely depolarized → back to baseline levels
- Discuss the different wave tracings on an ECG graph
- -P wave: atrial depolarization (0.08 - 0.10 s) → top part of heart depolarizing
- PR interval: allow ventricular filling involving AV nodal delay, bundle of His and branches (0.12 - 0.20s) → from start of P wave to the start of the QRS complex
- QRS: ventricular depolarization (between 0.06 - 0.10 s) → pushing blood from the bottom part of the heart throughout the body
- QTc interval = QT/sq. root RR → ventricular AP; (≤ 0.44 s) → from start of QRS complex to the end of the T-wave
- ST segment: interval between ventricular depolarization and repolarization→ from the end of the S wave to the start of the T wave
- T wave: ventricular repolarization
- U wave: bump after T wave but only used in pathological findings
- Learn how to read an ECG tracing (intervals and their significance)
- See notability notes & practice problems
- List the different ECG leads, know their locations on the body and their functions
- Limb leads: RA, RL, LA, LL → bipolar limb leads: I, II, III & unipolar augmented leads: aVR, aVL, aVF
- Lead 1: RA → LA
- Lead II: RA → LF
- Lead III: LA → LF
- Augmented leads: go fro center to RA, LA, or LF (negative center towards positive arm/leg lead)
- Precordial leads: V1-V6 (unipolar)
- Contrast a normal and abnormal ECG axis
- Normal axis: -30 to +90 degrees
- I, II, III: positive w/ R wave in I > III
- Right axis deviation: +90 to +180 degrees
- Lead I always negative, Lead III always positive (lead II can be +/-)
- Left axis deviation: -30 to -90 degrees
- Lead I always positive, Lead III always negative
- Recognize different ECG abnormalities
- AV block
- 1st degree: Prolonged PR interval 0.21 s +
- 2nd degree
- Mobitz Type I: Progressive PR + dropped beats
- Mobitz Type II: Fixed PR + dropped beats
- 3rd degree: P > QRS, dropped beats, no relation between P and QRS
- Lacking P waves
- Atrial fibrillation: decreased amplitude, increased frequency - atrial fibrillatory waves
- Atrial flutter: sawtooth pattern, irregularly irregular - coarse fibrillatory waves
- Sinus arrest w/ escape rhythm: retrograde atrial stimulation, bradycardia, no P wave, small QRS, and P & WRS are synchronized
- Ventricular problems
- PVCs
- V-tach
- V-fib
- STEMI
- ST segment appears elevated, but the baseline is actually shifted higher due to ischemia
- ST segment correlates to phase 3 of the AP; entire myocardium at 0 mV & energy current disappears
- ST elevation → transmural infarct involving the entire wall thickness of a ventricular region
- ischemic tissue becomes depolarized because of its inability to maintain normal ion gradients across the cell membranes
- When the noninvolved myocardium is repolarized (between the end of the T wave and beginning of the QRS), there exists injury currents created by the separation of depolarized injured tissue and polarized normal tissue.
- electrode overlying the ischemic tissue → negative voltages because the electrical vector will be in a direction away from the electrode. Therefore, at a time when the entire ventricle should be repolarized and when the ECG baseline voltage should be 0, the electrode instead records a negative voltage
- When the entire ventricle is depolarized with the appearance of the QRS, then the voltage difference between the ischemic & normal tissue disappears and the electrode records an isoelectric ST segment. However, this segment will appear elevated compared with the depressed baseline
- ECG changes (e.g., formation of prominent Q waves) occur over the hours and weeks following a STEMI
- https://journals.physiology.org/doi/full/10.1152/advan.00105.2016
- MEA
- The mean electrical axis moves away from areas of ischemia but towards areas of hypertrophy
Block 10: Cardiac 4 & 5 - Parmar
Cardiac 4
- Contrast systole vs. diastole
- diastole: relaxation and filling
- isovolumetric relaxation (SL closed and atria fill) ventricular pressure drops below atrial pressure → AV valves open → blood flow from atria to ventricles → atrial systole forces more blood into the ventricles at the end of v. diastole
- longer than systole
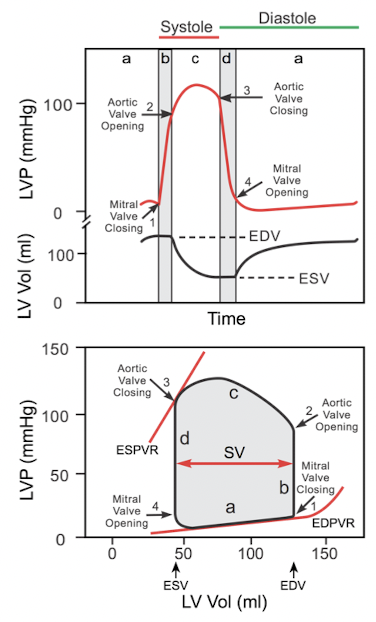
- systole: contraction and ejection
- ventricles contract → ventricular pressure > atrial pressure → AV valve closure S1 → isovolumetric contraction → ventricular pressure > aortic BP → aortic valve opens and blood ejected
- ventricles contract to PA and Aorta; AV valves closed
- diastole: relaxation and filling
- Discuss the different steps of the cardiac cycle and understand what is happening at each step (polarizations, valves, open/close, volumes)
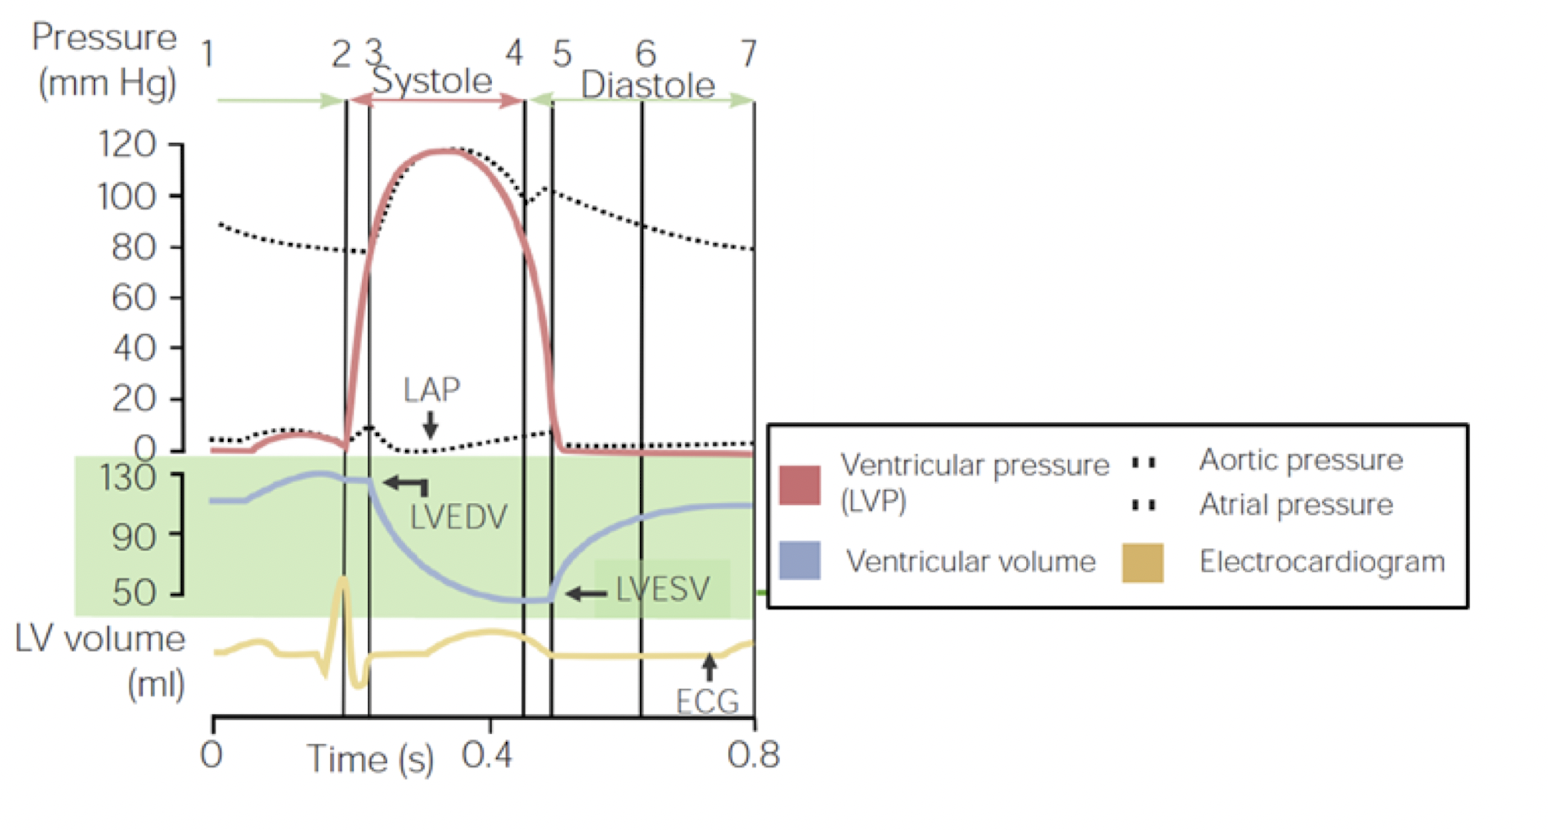
- Calculate ventricular EF & understand its importance
- EF = (EDV - ESV)/EDV → SV/EDV
- Normal: 55-60%
- Heart failure EF < 50%, may be as low as 15%
- Discuss the different steps of the cardiac cycle on the graph and be able to label important points (chamber filling/emptying, valve open/close, heart sounds)
- Understand how to interpret the pressure volume loop (chamber filling, valve open/close, heart sounds)
Cardiac 5
- Calculate cardiac output and understand its importance
- Calculate stroke volume and understand its importance
- Define preload and understand the factors that determine preload
- Determine Frank Starling Law
- Explain how preload effects PV loops
- Define afterload and understand the factors that determine afterload
- Explain how afterload effects ventricular function
- Explain how afterload effects PV loops
- Explain the regulation of inotropy and its effects on ventricular function
Block 11. Respiratory 1 & 2 - Panvelil
- Poiseuille's law \n
- Alveolar ventilation calculation \n
- Airway resistance \n
- CO2 & ventilation \n
- Surfactant specifics \n
- Pneumocyte types \n
- Pulmonary circulation details \n
- Resistance pressure relation \n
- Distention & recruitment \n
- High & Low lung volumes \n
- Specifics on 3 zones of lungs
B12. Respiratory 3 & 4 - Riskin
Respiratory 3
- Gas transport & its function
- Dissolved oxygen is not survivable, O2 has low solubility
- must bind to O2
- Function: carry O2 hgb throughout body and get rid of waste
- Dissolved oxygen is not survivable, O2 has low solubility
- Physical and graphical relation between hgb and O2 binding
- O2 binding → more O2 binding
- Two Y axises
- % Hb saturation
- O2 concentration (ml/100 ml)
- X axis: Partial pressure of O2
- Contrast the cases behind a left shift vs a right shift on the O2-hgb saturation graph
- P50 = PO2 sat 50% Hgb saturation → indicates affinity of O2 for Hgb
- Left shift: increased O2 affinity → decreased O2 offloading (R state)
- Right shift: decreased O2 affinity → increased O2 offloading (T state) {greater tissue effect}
R state = fully O2 hgb while T state = deoxy hgb
- Interpret partial pressures & how they affect saturation
- Partial pressures: the higher the P02, the higher the percentage O2 saturation of hgb
- Arterial: PaO2 95 mmHg → PaCO2 40 mmHg
- ALVEOLAR: PAO2 100 mmHg → PACO2 40 mmHg
- Venous: PvO2 40 mmHg → PvCO2 46 mmHg
- Partial pressures need to different in arterial vs. venous blood to pick up/drop off O2/CO2
- Explain how CO2 is transported through the body
- 5% dissolved, 5% hgb, and 90% via HCO3-
- RBCs have CA which convert CO2 → HCO3-
Respiratory 4
- Calculate A-a gradients using the alveolar gas equation
- Recognize causes of tissue hypoxia and the body’s compensatory mechanisms
- Explain diffusional impairment and discuss clinical conditions associated & shunting (compensatory mechanisms)
- Discuss ventilation to perfusion inequality and the different zones it causes in the lungs
- Describe the change in compliance in the different regions of a lung when it is upright and how that affects the ventilation/perfusion ratio
- Identify the common causes of hypercapnia
==Block 13 - Respiratory 5 - Benmerzouga==
- State what can be controlled in respiration
- Rate and depth can both be controlled consciously (voluntary control - cerebrum)
- Many receptors → respiratory control centers in medulla and pons → spinal motor neurons → intercostals and accessory muscles + diaphragm
- List the different sensors/receptors in the body used to regulate breathing and their effectors
- Chemoreceptors → rate and depth
- Central: H+ [H+ cannot cross BBB, CO2 can and CA in CSF → H+]
- Peripheral: CO2, O2, H+
- Carotid → CN IX glossopharyngeal nerve → ! only responds to PaO2 and not [O2]
- Aortic → CN X
- Mechanoreceptors
- Lung receptors
- Stretch: fire w/ inspiration → inspiratory off switch
- Hering-Breur reflex protects lungs from over inflation
- **slow adapting receptors
- J receptors: increased pulmonary interstitial volume activates R → induce rapid shallow breathing
- Irritant: responds to noxious irritants → coughing, gasping, breath holding
- Stimulated by: histamine, serotonin, prostaglandins
- **rapid adapting receptors
- Muscle proprioceptors: located in tendons and muscle spindles; if both are activated → increase RR
- Play important role in exercise
- Chemoreceptors → rate and depth
- Locate the respiratory control centers and explain their important functions
- Medulla = primary respiratory control
- Also contains centers for swallowing and vomiting
- Two regions in medulla
- DRG: constant breathing rhythm, normal inspiration (normal expiration is passive)
- VRG: forced inspiration and forced expiration
- Pons = pontine respiratory group
- Apneustic centers: neurons that stimulate DRG → deep breathing (depth and rate of inspiration; expiration is passive)
- Pneumotaxic centers: inhibit DRG → increase RR (by limiting the inspiratory period)
- Medulla = primary respiratory control
- Compare and contrast the central and peripheral chemoreceptors
- Central: PaCO2 → medulla oblongata: CO2 crosses BBB → CSF w/ CA
- Peripheral: monitors pH, PCO2, PO2
- Most critical in response to hypoxia
- Little response to normoxia
- Metabolic acidosis → pH monitoring → ventilatory compensation
- Recognize the interrelations of blood gasses on ventilation
- PO2 must be reduced < 60 mmHg to significantly increase ventilation (sharp, curved line)
- Hypoxic induced ventilatory response is mediated by the peripheral chemoreceptors
- PC02: + 5 mmHg change → +/- 50% ventilation
- alveolar CO2 is a powerful stimulus of ventilation
- Minute ventilation is inversely related to alveolar PO2; directly related to PCO2 and arterial H+ ions
- PO2 must be reduced < 60 mmHg to significantly increase ventilation (sharp, curved line)
- Recognize the other sensors with pulmonary implications