STATS AND PROB WW2 REVIEWER
- Statistics, as a science, involves methods for collecting, organizing, summarizing, analyzing, and drawing conclusions about data to provide answers or solutions to an inquiry.
- Probability is the exact value of chance that an event will occur.
- Therefore, Statistics and Probability is a Mathematics course that involves processing data using probability concepts.
EXPERIMENT
It is an action or process that can be performed repeatedly and whose outcome varies.
EVENT
- It is a specific result that may or may not occur.
CHANCE
It is the likelihood of a particular event to happen.
OUTCOME
The possible result/s of occurrences.
EXPERIMENT
It is an action or process that can be performed repeatedly and whose outcome varies.
RANDOM VARIABLE
It associates a numerical value with each possible outcome of a random experiment.
It can represent quantities, measurements, or characteristics of interest.
It is often denoted by uppercase letters (X, Y, and Z)
EXAMPLES OF RANDOM VARIABLES
the sum when a pair of dice is rolled
the lifetime of a flashlight battery
the number of children in a family
the total points scored by two teams in a basketball game
the number of correct answers a student gets in a 20-item true-or-false test
the length of time it takes a swimmer to complete a 100-meter freestyle race
the distance leaped in meters by a long jumper in a competition
A random variable that can take on a countable number of distinct values. | A random variable that take on any value within a continuous range or interval. They are measurable. |
|---|---|
|
|
POSSIBLE VALUES OF RANDOM VARIABLES
distinct outcomes or observations
for discrete, possible values are typically countable and can be listed individually
for continuous, the possible values form a continuous range within a specified interval
the number of pages in a randomly selected book from the library Answer: {x | x > 0 , x ∈ W} | the amount of money in pesos that a customer spends in a grocery store Answer: {x | x ≥ 0 pesos, x ∈ R} |
|---|
DISCRETE PROBABILITY DISTRIBUTION
A list of probabilities for each of the possible outcomes in an experiment.
Consists of the values a random variable can assume and the corresponding probabilities of the values.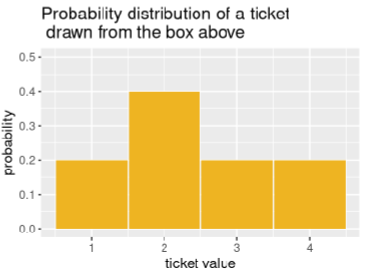
DPD can be written/illustrated in three forms: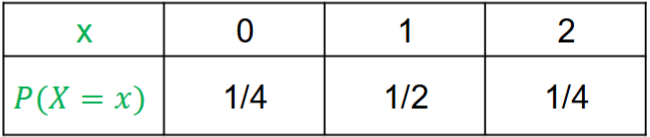
Tabular (table)
Function (equation)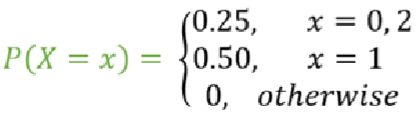
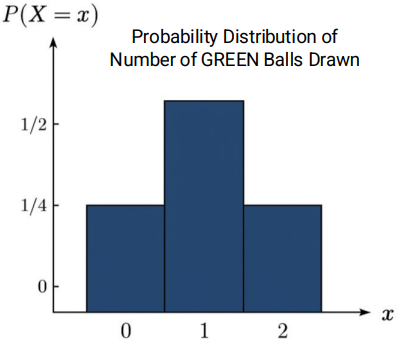
Histogram (graph)
PROPERTIES OF DPD
PROPERTY 1: The Sum of All Probabilities is 1.
The total probability of all possible outcomes is:
PROPERTY 2: The Probability of Each Value is Between 0 and 1.
For every possible value of the random variable X:
PMF is a function that gives the probability that a discrete random variable is exactly equal to a specific value.
If X is a discrete random variable, then its PMF is:
Read as:
“The probability that the random variable X takes the value x is equal to p of x.”
"The probability that X equals x is p(x)."
where:
- X is the discrete random variable
- x is the value that the random variable X can take (realizations of x)
- p(x) is the probability that X takes the value of x
"The probability that X is equal to 2 is 0.3." Meaning, there's a 30% chance that the random
variable X takes the value 2.”
Example: A box has two balls – one red and one green. Two balls are picked one at a time with replacement. Create a probability distribution for the random variable X, which represents the number of GREEN balls drawn.
With replacement means that if one ball is picked, it will be replaced by a similar ball.
Without replacement means that if one ball is picked, it will not be replaced, so the container will have one fewer ball.
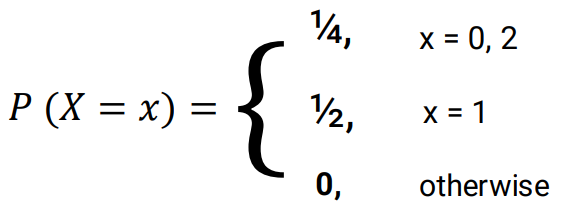
[Sol] The probability distribution can be denoted by the mass function P(X = x).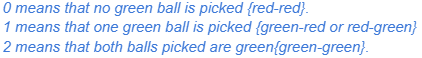
Sample space: 𝑆: {𝑔𝑔, 𝑔𝑟, 𝑟𝑔, 𝑟𝑟}
Realizations of x: 𝑥 = {0, 1 , 2}
𝑆: {𝑔𝑔, 𝑔𝑟, 𝑟𝑔, 𝑟𝑟} 𝑥 = {0, 1 , 2}
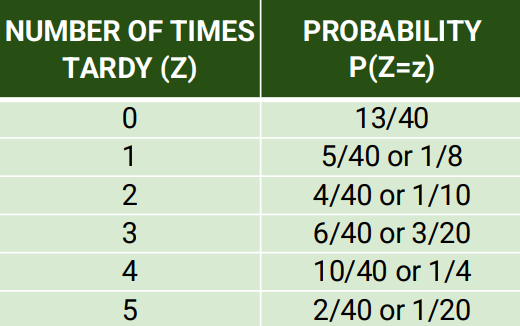
Example: The table below shows the number of times students of a class have been tardy during the first term. Let Z denote the number of times a randomly selected student had been tardy.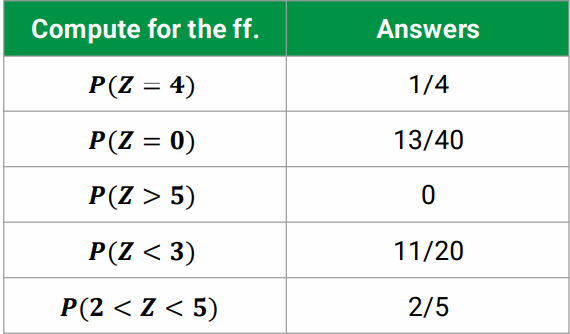
Example: Suppose two cellphones are tested at random. Let X be the random variable representing the number of defective cellphones that occur. Construct the discrete probability distribution of the random variable X.
Let D = defective, and N = non-defective
𝑆: {𝑁𝑁, 𝑁𝐷,𝐷𝑁,𝐷𝐷} 𝑅𝑒𝑎𝑙𝑖𝑧𝑎𝑡𝑖𝑜𝑛𝑠 𝑜𝑓 𝑥 = {0, 1 , 2}
What is the probability that there is at least one defective phone?
MEAN, VARIANCE, AND STANDARD DEVIATION
- also known as the average
measure of how data points in a dataset differ from the mean
measures the amount of variation or dispersion in a dataset
Formula for the Mean of a Discrete Probability Distribution:
- X is the random variable.
- P(X) is the probability of each random variable.
- 𝜮 the Greek letter for sigma (uppercase). It is the summation symbol.
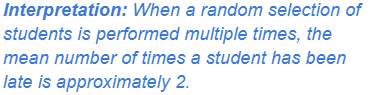
- 𝝁 is the Greek letter (in lowercase) mu /’mju:/. It is a symbol used to denote the mean of a population.
How to Compute the Mean of DPD?
Step 1: Multiply the value of the random variable by its corresponding probability.
Step 2: Add the results from Step 1
Example: Rolling a Fair Die. The random variable X is the number of dots that appear after rolling a die. Compute the mean, variance, and standard deviation of the random variable X.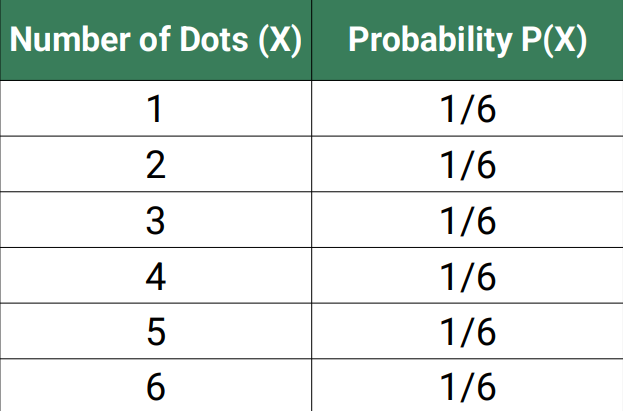

- VARIANCE AND STANDARD DEVIATION OF DPD
Formula for the Variance of a Discrete Probability Distribution
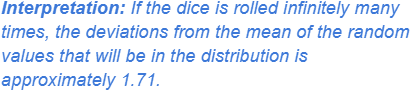
Formula for the Standard Deviation of a Discrete Probability Distribution
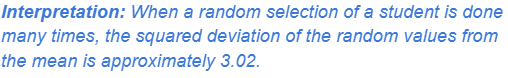
𝝈 is the Greek letter for sigma (lower case). It is raised to the second power since the variance is the ‘squared deviation’ of the scores from the mean
How to Compute the Variance of DPD?
Step 1: Solve for the mean when needed, then square it.
Step 2: Square each value of the random variable.
Step 3: Multiply each squared value by the corresponding probabilities.
Step 4: Add all the products.
Step 5: Subtract the sum (result in Step 4) from the square of the mean.
Step 6: To solve for SD, get the square root of the resulting variance.
Example: Rolling a Fair Die. The random variable X is the number of dots that appear after rolling a die. Compute the mean, variance, and standard deviation of the random variable X.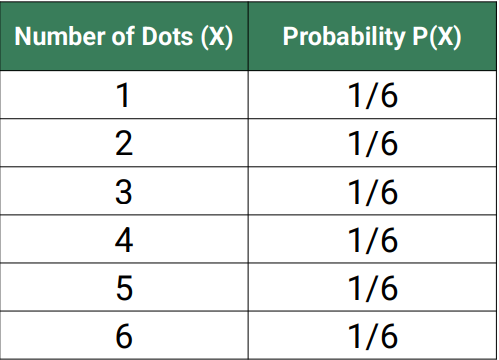
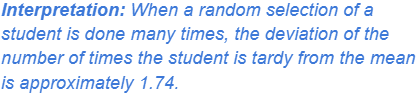
Example 2: The table shows the number of times students of a class have been tardy during the first term. Let Z denote the number of times a randomly selected student had been tardy. Compute the mean, variance, and standard deviation of the discrete probability distribution.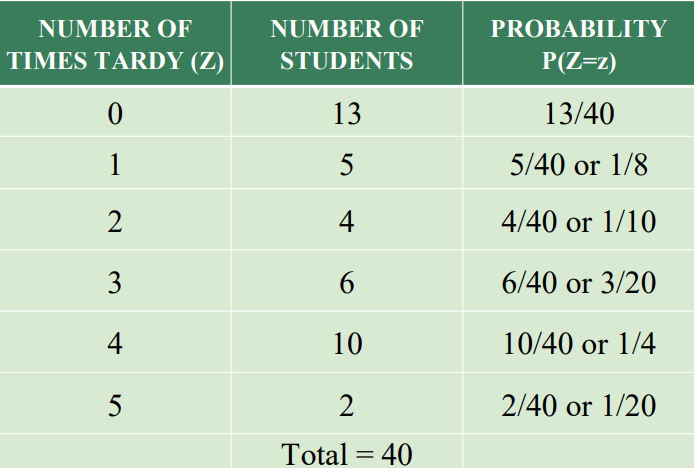
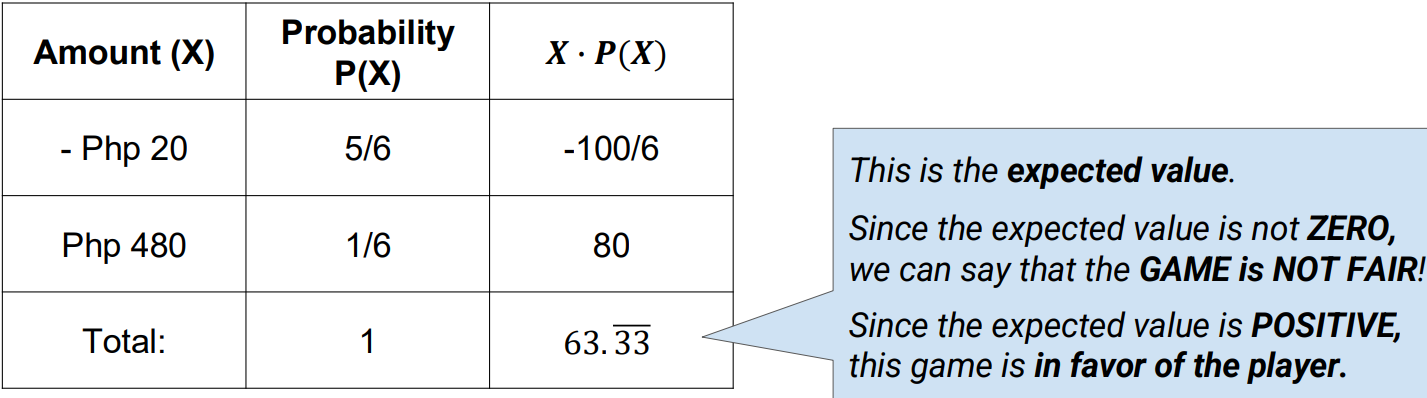
- A game is considered fair if the mean or the expected value is zero.
- This means that the expected value of the total winnings is equal to the bet.
- The expected value is a calculated average outcome of a random event, taking into account all the possible outcomes and their probabilities
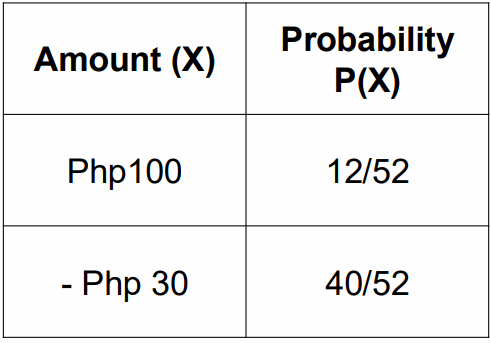
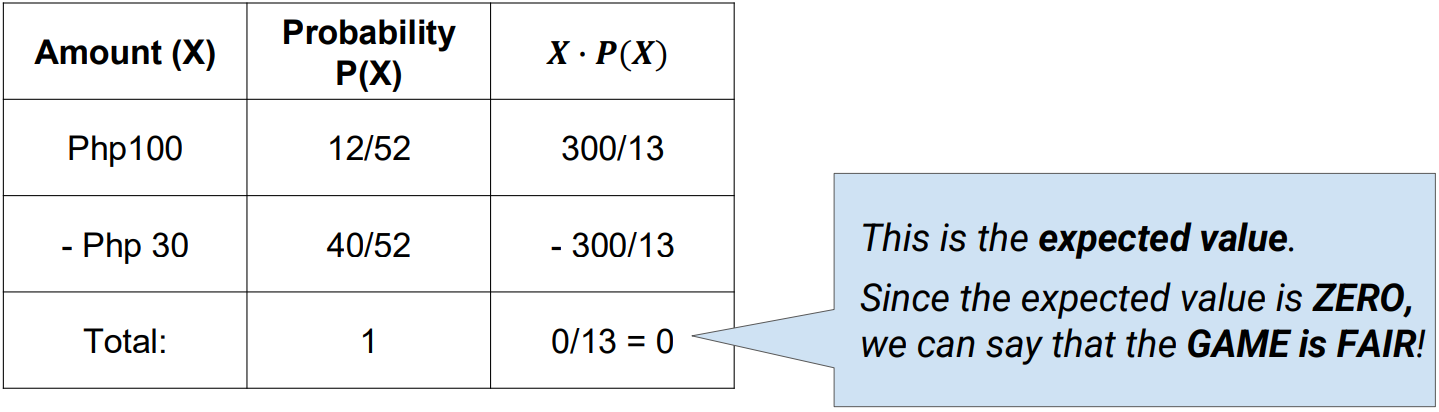
Example 1: A game consists of drawing one card from a deck of cards. If the card drawn is a face card (jack, queen, or king), the player wins Php100. Otherwise, he loses Php30. Determine if the game is fair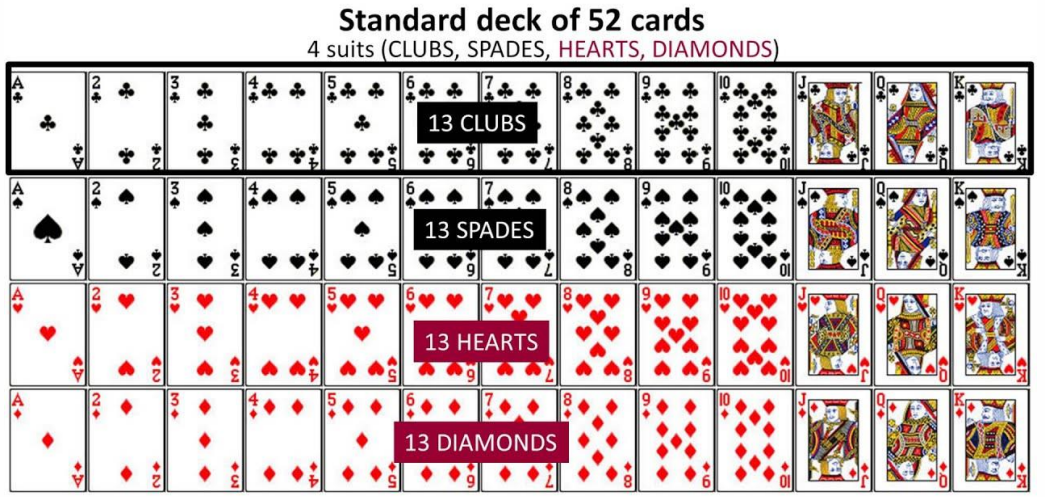
Step 1: Construct a Probability Distribution where X is the amount a player can win/lose in one round of the game
Step 2: Solve for the expected value or mean probability distribution.
Example 2: Jane and John are playing a game. Jane will roll a number cube, and John will guess the outcome of the roll. John pays Php20 to make a guess, and if he guesses correctly, Jane pays him Php500. Is the game fair?
Step 1: Construct a Probability Distribution where X is the amount John wins in one guess in the game.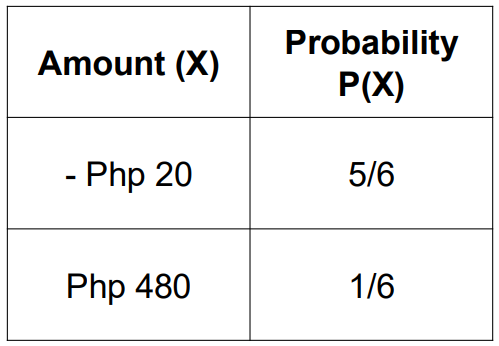
Step 2: Solve for the expected value or mean probability distribution
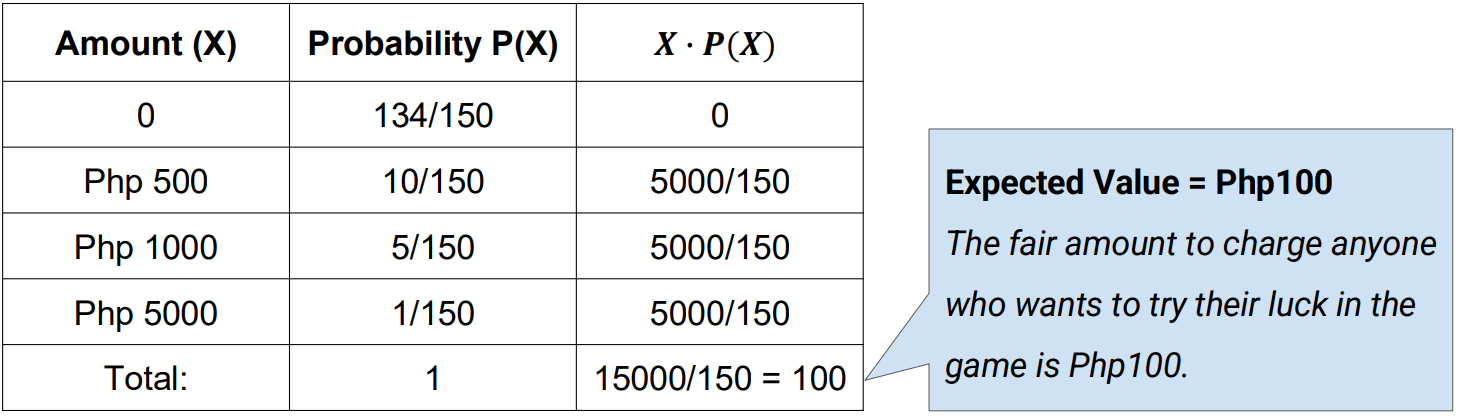
Example 3: The organizing committee of a high school reunion placed 150 balls inside a box. Ten of the balls are red, five are blue, one is gold, and the rest are green. A player has a chance to draw one ball from the box. A red ball wins Php500, a blue ball wins Php1000, while a gold ball wins Php5,000. He will not win anything if he draws a green ball. What would be the fair price to pay for a chance to draw a ball from the box?
Step 1: Construct a Probability Distribution where X is the amount a player can win/lose.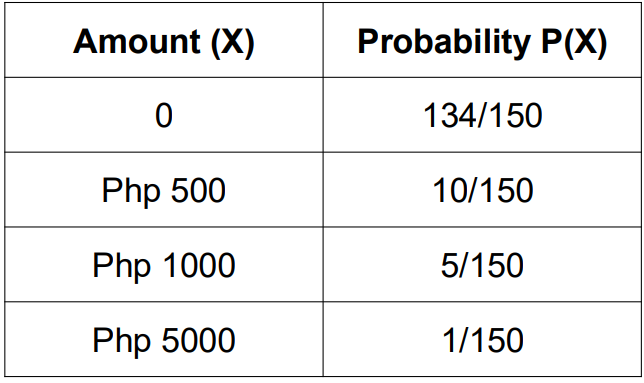
Step 2: Solve for the expected value or mean probability distribution