Chapter 2: Modeling Distributions of Quantitative Data
2.1 Describing Location in a Distribution
- The pth percentile is the percent of values in a distribution that are less than or equal to the individual’s data value.
* Ex: 4 students of 25 earned a higher test score than Emily. 21/25 ppl have scores less than or equal to her, so she’s in the 84th percentile.
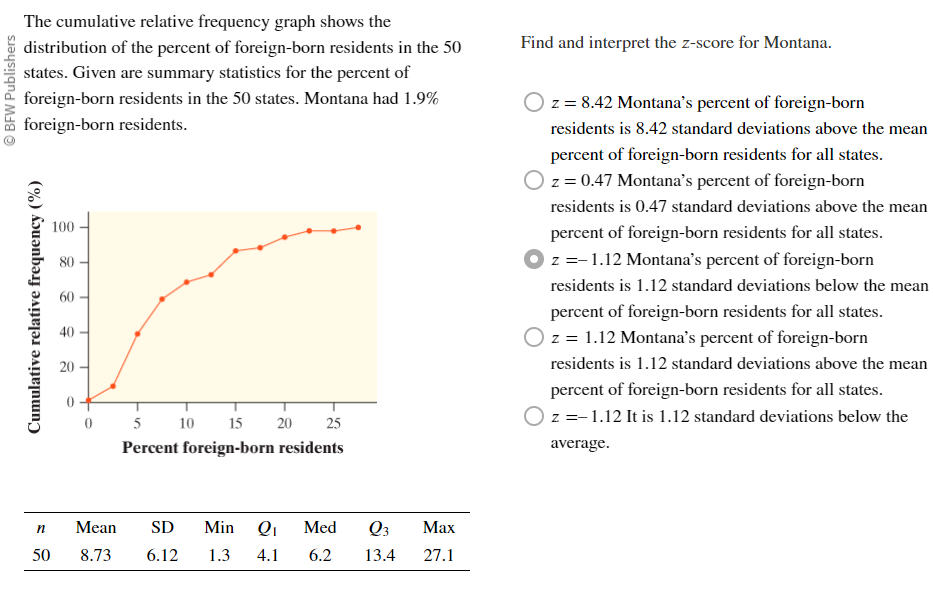
* Ex: The table reveals that 20.0% of U.S. presidents took office by the time they turned 50. In other words, the 20th percentile of the distribution of inauguration age is 50.000 years. - A Cumulative Relative Frequency Graph plots a point corresponding to the cumulative relative frequency
* Make one by
* Useful to measure percentiles in a distribution - The standardized score (z-score) tells us how many standard deviations a value is from the mean
* z = (value - mean) / (standard deviation)
* Values larger than mean have positive z-scores
* 
- Transformations (a & b are constants):
* Neither transformations will change the shape.
* If data is being added/subtracted by a constant (a), all the values in a data set, measures of center and location—mean, five-number summary, percentiles—increase (decrease) by 𝑎
* Measures of variability—range, IQR, SD—do not change.
* When you multiply (divide) all the values in a data set by a positive constant 𝑏 everything changes: measures of center, location, and variability are multiplied (divided) by 𝑏.
* It’s possible to have multiple transformations of a and b in one distribution
2.2 Density Curves and Normal Distributions:
- Density Curves always add up to 1 or 100%
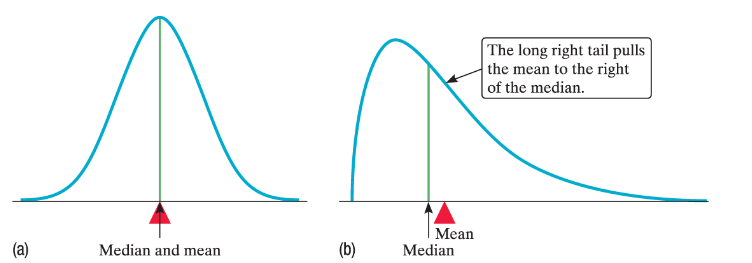
* Its basically a dot plot with a shit ton of calculus (area under the dot plot) - If a density curve is symmetric both the mean and the median will lie at the same point of symmetry.
- If a curve is skewed, however, the mean is closer to tail, median is farther from tail
- Normal Density Curve is drawn over a histogram (calculus shit again)
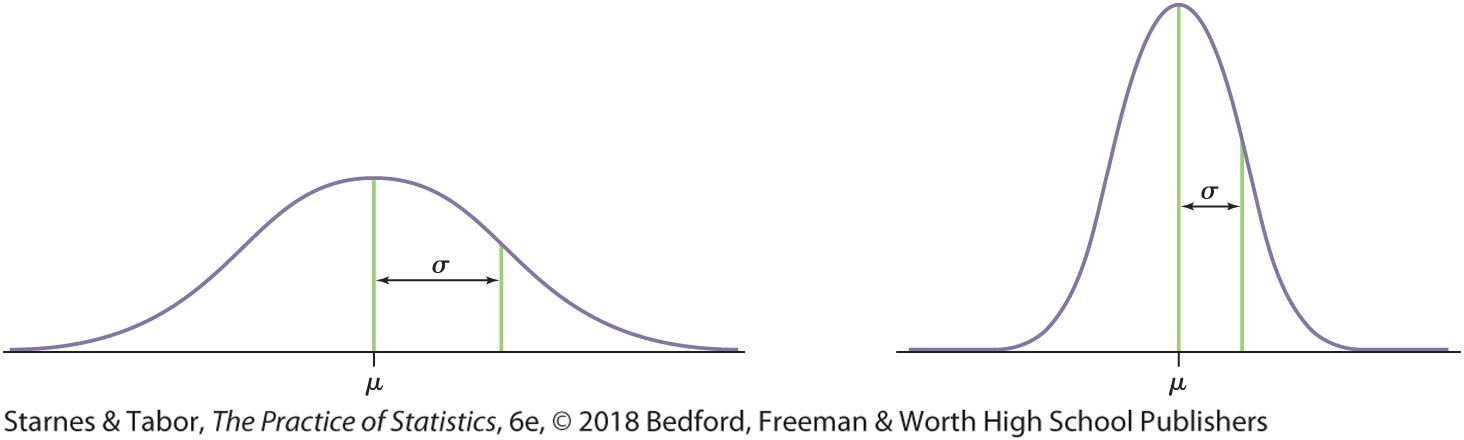
* Shape: All Normal distributions have the same overall shape: symmetric, single-peaked (unimodal), and bell-shaped.
* Center: The mean μ is located at the midpoint of the symmetric density curve and is the same as the median.
* Variability: The standard deviation σ measures the variability (width) of a Normal distribution.
* 
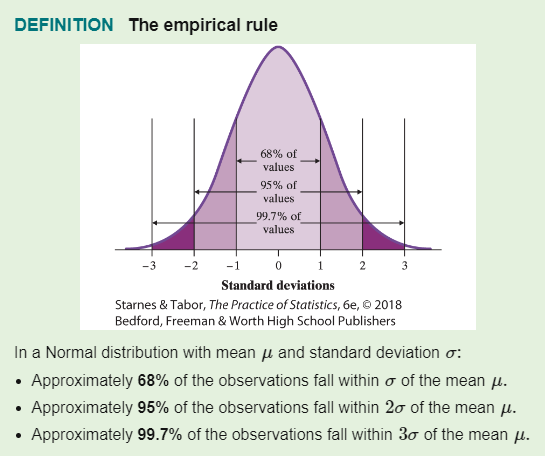
- The Empirical rule states that: 68% for [-1, 1] SD, 95% for [-2,2] SD, 99.7 for [-3,3] SD
- Reminder: You need to draw the normal graph & the scaled graph:
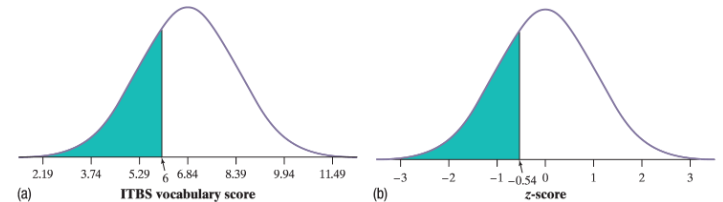
- Make sure to write N=(Mean, SD) for left graph, and N=(0,1) for right normalized graph
- To convert a percentile to a z score do backwards stuff:
* Look in the body of Table A for the value closest to 0.20. A 𝑧-score of –0.84 gives the closest value (0.2005).
* −0.84 = (x-5.3) / 0.9 → x = 4.544mins