Pertemuan 1
1. Measuring a Nation's Income
Microeconomics vs. Macroeconomics
Microeconomics: This is about small parts of the economy. It looks at individual households and firms. Think of it as studying how families and businesses make decision and interact in markets.
Macroeconomics: This is the big picture! It analyzes the whole economy, trying to explain changes that affect many households and firms together.
Key Questions Addressed by Macroeconomics
Income Disparities: Why do some countries have high average incomes while others are low?
Price Changes: Why do prices go up quickly sometimes but stay the same at other times?
Production & Employment Fluctuations: Why does production and jobs increase in some years, but decrease in others?
Economy's Income and Expenditure
To see how well the economy is doing, we look at the total income every household earns.
Income and Expenditure Equality: Every time someone buys something, there’s a seller. For every dollar someone spends, there’s another person earning that dollar!
Circular-Flow Diagram
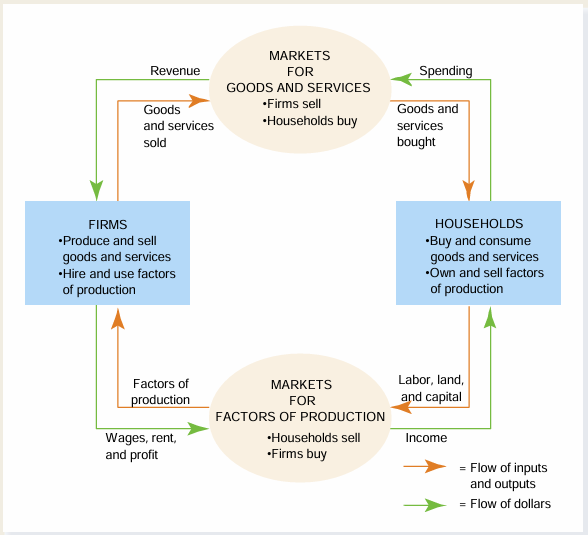
This diagram helps us visualize the economy:
Firms: These are businesses that make and sell goods/services. They also hire people (factors of production) and buy inputs (like raw materials).
Households: Families that buy goods and services and sell factors of production, like labor.
Gross Domestic Product (GDP)
Definition: GDP is the total value of all final goods and services made in a country over a set time.
Importance: It measures both the income and what is spent in the economy.
Features of GDP (Measurement):
Market Value: Values items at current market prices.
All Items: include all items produced and legally sold.
Final Goods & Services: Counts only the final products to avoid double counting, tangible and intangible.
Produced: Only includes things made recently, not resales.
Within a Country: Counts only what’s produced inside the country's borders.
Given Period: Looks at production over a specific time, like a year.
Exclusions from GDP
Non-Market Transactions: Things made but not sold (like family cleaning) are not counted.
Illicit Goods: Illegal sales (like drug trade) don’t count in GDP.
Components of GDP
The formula for GDP is: GDP (Y) = C + I + G + NX
C (Consumption): Money spent by households on goods/services (not new houses).
I (Investment): Spending on things like capital goods, inventory, and new housing.
G (Government Purchases): Money spent by the government on goods/services.
NX (Net Exports): Exports (goods sold abroad) minus imports (goods bought from abroad).
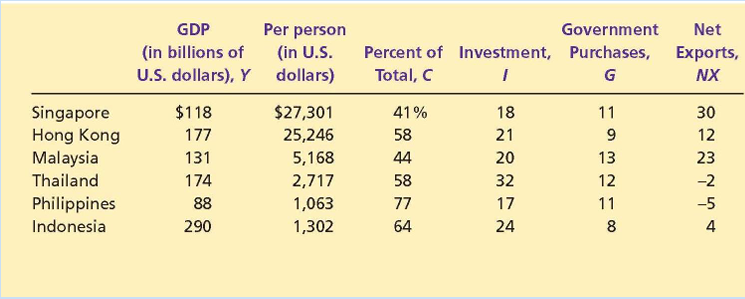
Example of GDP and it Components
Real vs. Nominal GDP
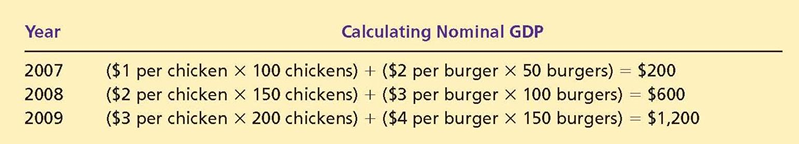
Nominal GDP: This shows the dollar value of goods/services at current prices.
Real GDP: This adjusts to take into account inflation, showing the value at constant prices.
Adjusting is crucial for accurately reflecting the economy.
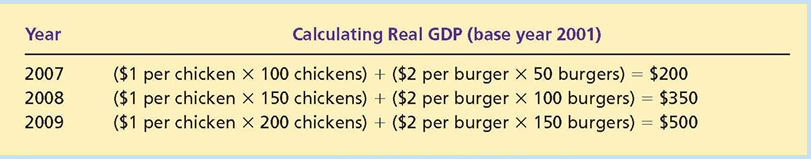
Example of Real and Nominal GDP
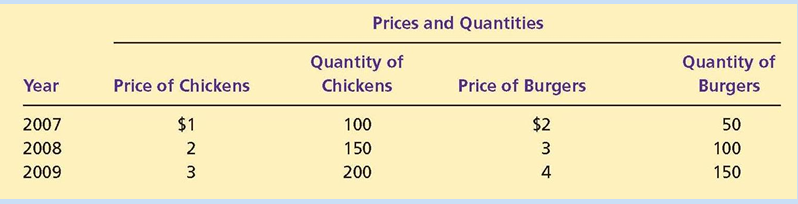
How To Calculate Nominal and Real GDP
GDP Deflator
Definition: This is a price level measure that compares nominal GDP to real GDP, times 100.
It shows how much of GDP growth is due to price increases instead of actual output growth.
Formula of GDP Deflator
GDP Deflator = (Nominal GDP/Real GDP) x 100
Formula of Nominal GDP to Real GDP
Real GDP = (Nominal GDP/GDP Deflator) x 100
Assessing Economic Well-Being with GDP
GDP as an Indicator: It provides a rough estimate of a nation's economic performance and living standards. More GDP usually means better living conditions, but it isn’t everything!
GDP doesn’t include:
Value of leisure time
Quality of the environment
Non-market activities like family care or volunteering
Global Context
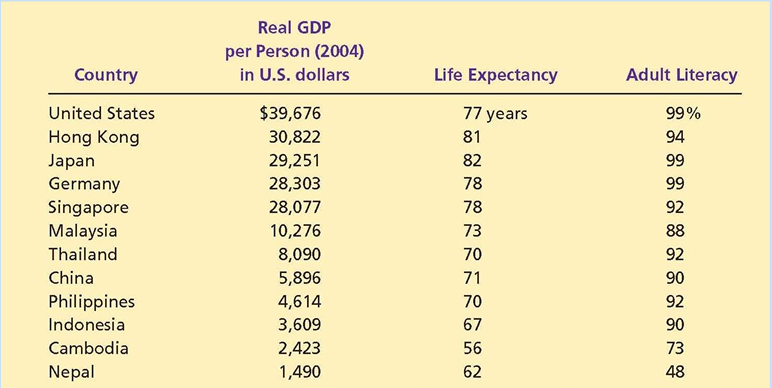
Different GDP levels among countries show the differences in economic prosperity. Real GDP per person gives a clearer comparison for living standards across countries.
Conclusion on Income Measurement
Key Points:
Every economic transaction involves both income and expenses, and GDP reflects this.
While GDP is helpful, it has limits and should be looked at with other quality of life measures.