elasticity
price elasticity of demand (PED)
Price elasticity of demand (PED) measures how responsive quantity demanded is to a change in the good's own price.
formula:
%change in QD divided by %change in price
PED is usually negative because price and quantity demanded move in opposite directions. In exams, the absolute value is often used to classify elasticity.
types of PED
Type | Value (absolute) | Meaning |
|---|---|---|
Perfectly inelastic | 0 | QD does not change when price changes |
Relatively inelastic | Between 0 and 1 | QD changes proportionately less than price |
Unit elastic | 1 | QD changes by the same percentage as price |
Relatively elastic | Greater than 1 | QD changes proportionately more than price |
Perfectly elastic | Infinity | Consumers will buy at one price but none at a higher price |
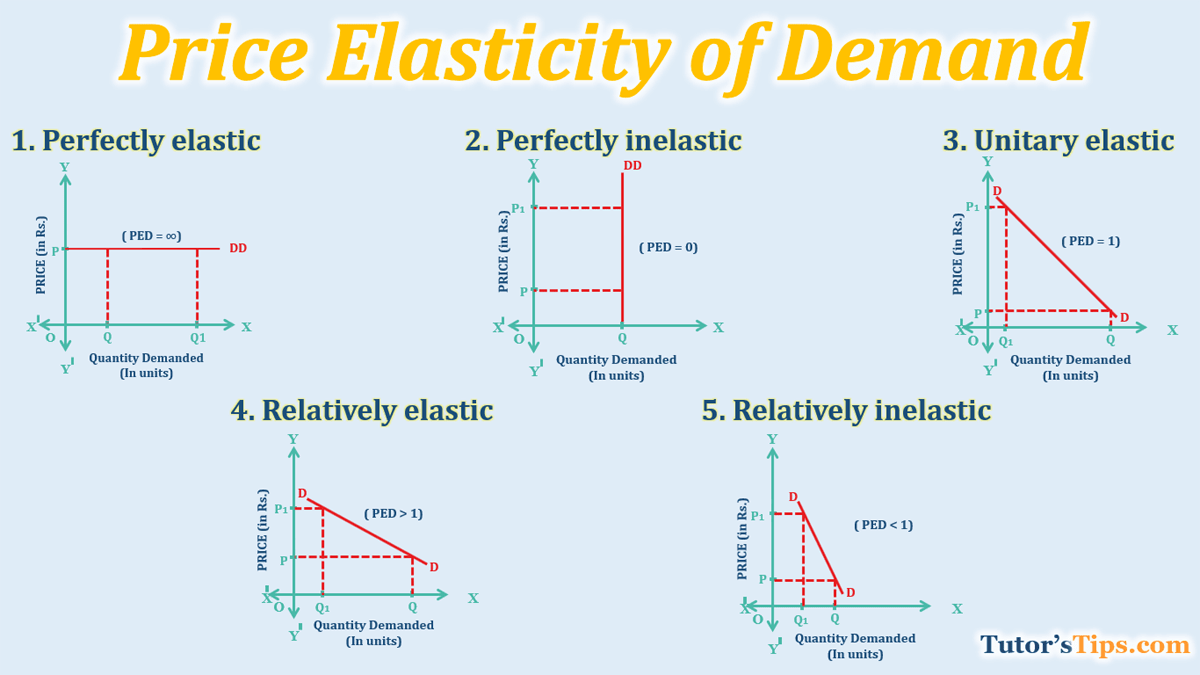
QD = quantity demanded. “Relatively” is also commonly called “price inelastic” or “price elastic”.
what affects PED?
Availability of substitutes: more substitutes → demand tends to be more elastic.
Necessity: necessities tend to have more inelastic demand.
Proportion of income spent: expensive purchases taking up a larger share of income may be more elastic.
Time period: demand often becomes more elastic over time as consumers find alternatives.
Habit or addiction: can make demand more inelastic.
Brand loyalty: can make demand more inelastic.
PED and total revenue
Total revenue (TR) is the money a firm receives from sales.
TR= price x quantity sold
Type of demand | If price rises | If price falls |
|---|---|---|
Elastic | TR falls | TR rises |
Inelastic | TR rises | TR falls |
Unit elastic | TR unchanged | TR unchanged |
cross-price elasticity of demand (XED)
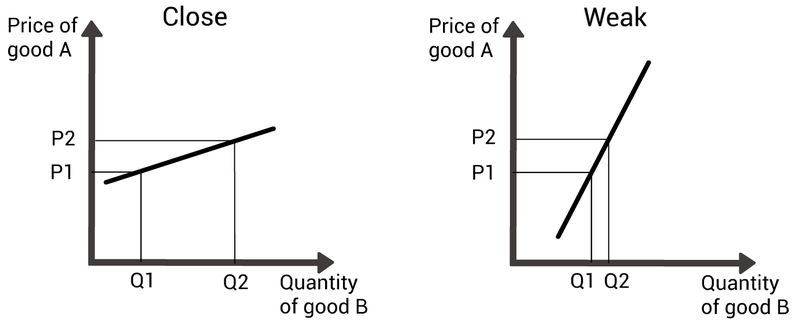
measures the responsiveness of the quantity demanded of 1 good to a change in the price of another related good
particularly useful in analysing relationships between substitute and complementary goods
f o r m u l a : (A to B)= (%change in the quantity of A) divided by (%change in the price of B)
substitutes
substitutes are goods that can be used instead of each other.
example: tea and coffee.
Price of coffee ↑
Demand for tea ↑
XED is positive.
The goods are substitutes because consumers switch towards tea when coffee becomes more expensive.
complements
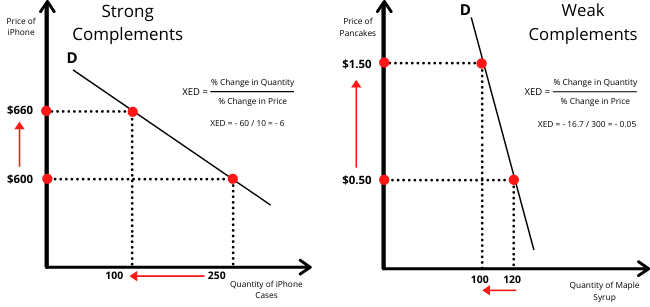
complements are goods consumed together.
example: printers and ink.
Price of printers ↑
Demand for printers ↓
Demand for ink may also ↓
XED is negative.
The goods are complements because consumers tend to use them together.
interpreting XED
XED value | Relationship | Example |
|---|---|---|
Positive (+) | Substitutes | Tea and coffee |
Negative (−) | Complements | Printers and ink |
Zero (0) | No relationship | Two unrelated goods |
income elasticity of demand (YED)
Income elasticity of demand (YED) measures how responsive quantity demanded is to a change in consumers' income.
formula
YED=%change in QD divided by %change in income
interpreting YED
YED value | Type of good | Meaning |
|---|---|---|
Positive (+) | Normal good | Income ↑ → demand ↑ |
Negative (−) | Inferior good | Income ↑ → demand ↓ |
Greater than +1 | Luxury good (typically) | Demand rises proportionately more than income |
Between 0 and +1 | Necessity (typically) | Demand rises proportionately less than income |
A normal good can be either a necessity or a luxury. A luxury good is usually a normal good with YED greater than 1.
normal goods
As income rises, demand rises.
Examples: holidays, restaurant meals and new clothes.
Inferior goods
As income rises, demand falls because consumers switch to alternatives they prefer.
Examples may include budget food brands or second-hand goods, depending on the consumer.
Necessities and luxuries
Necessities: demand increases by a smaller percentage than income.
Luxuries: demand increases by a larger percentage than income.
price elasticity of supply (PES)
Price elasticity of supply (PES) measures how responsive quantity supplied is to a change in the good's own price.
formula: %change in QS divided by %change in price
Unlike PED, PES is generally positive because price and quantity supplied usually move in the same direction.
types of PES
PES value | Meaning |
|---|---|
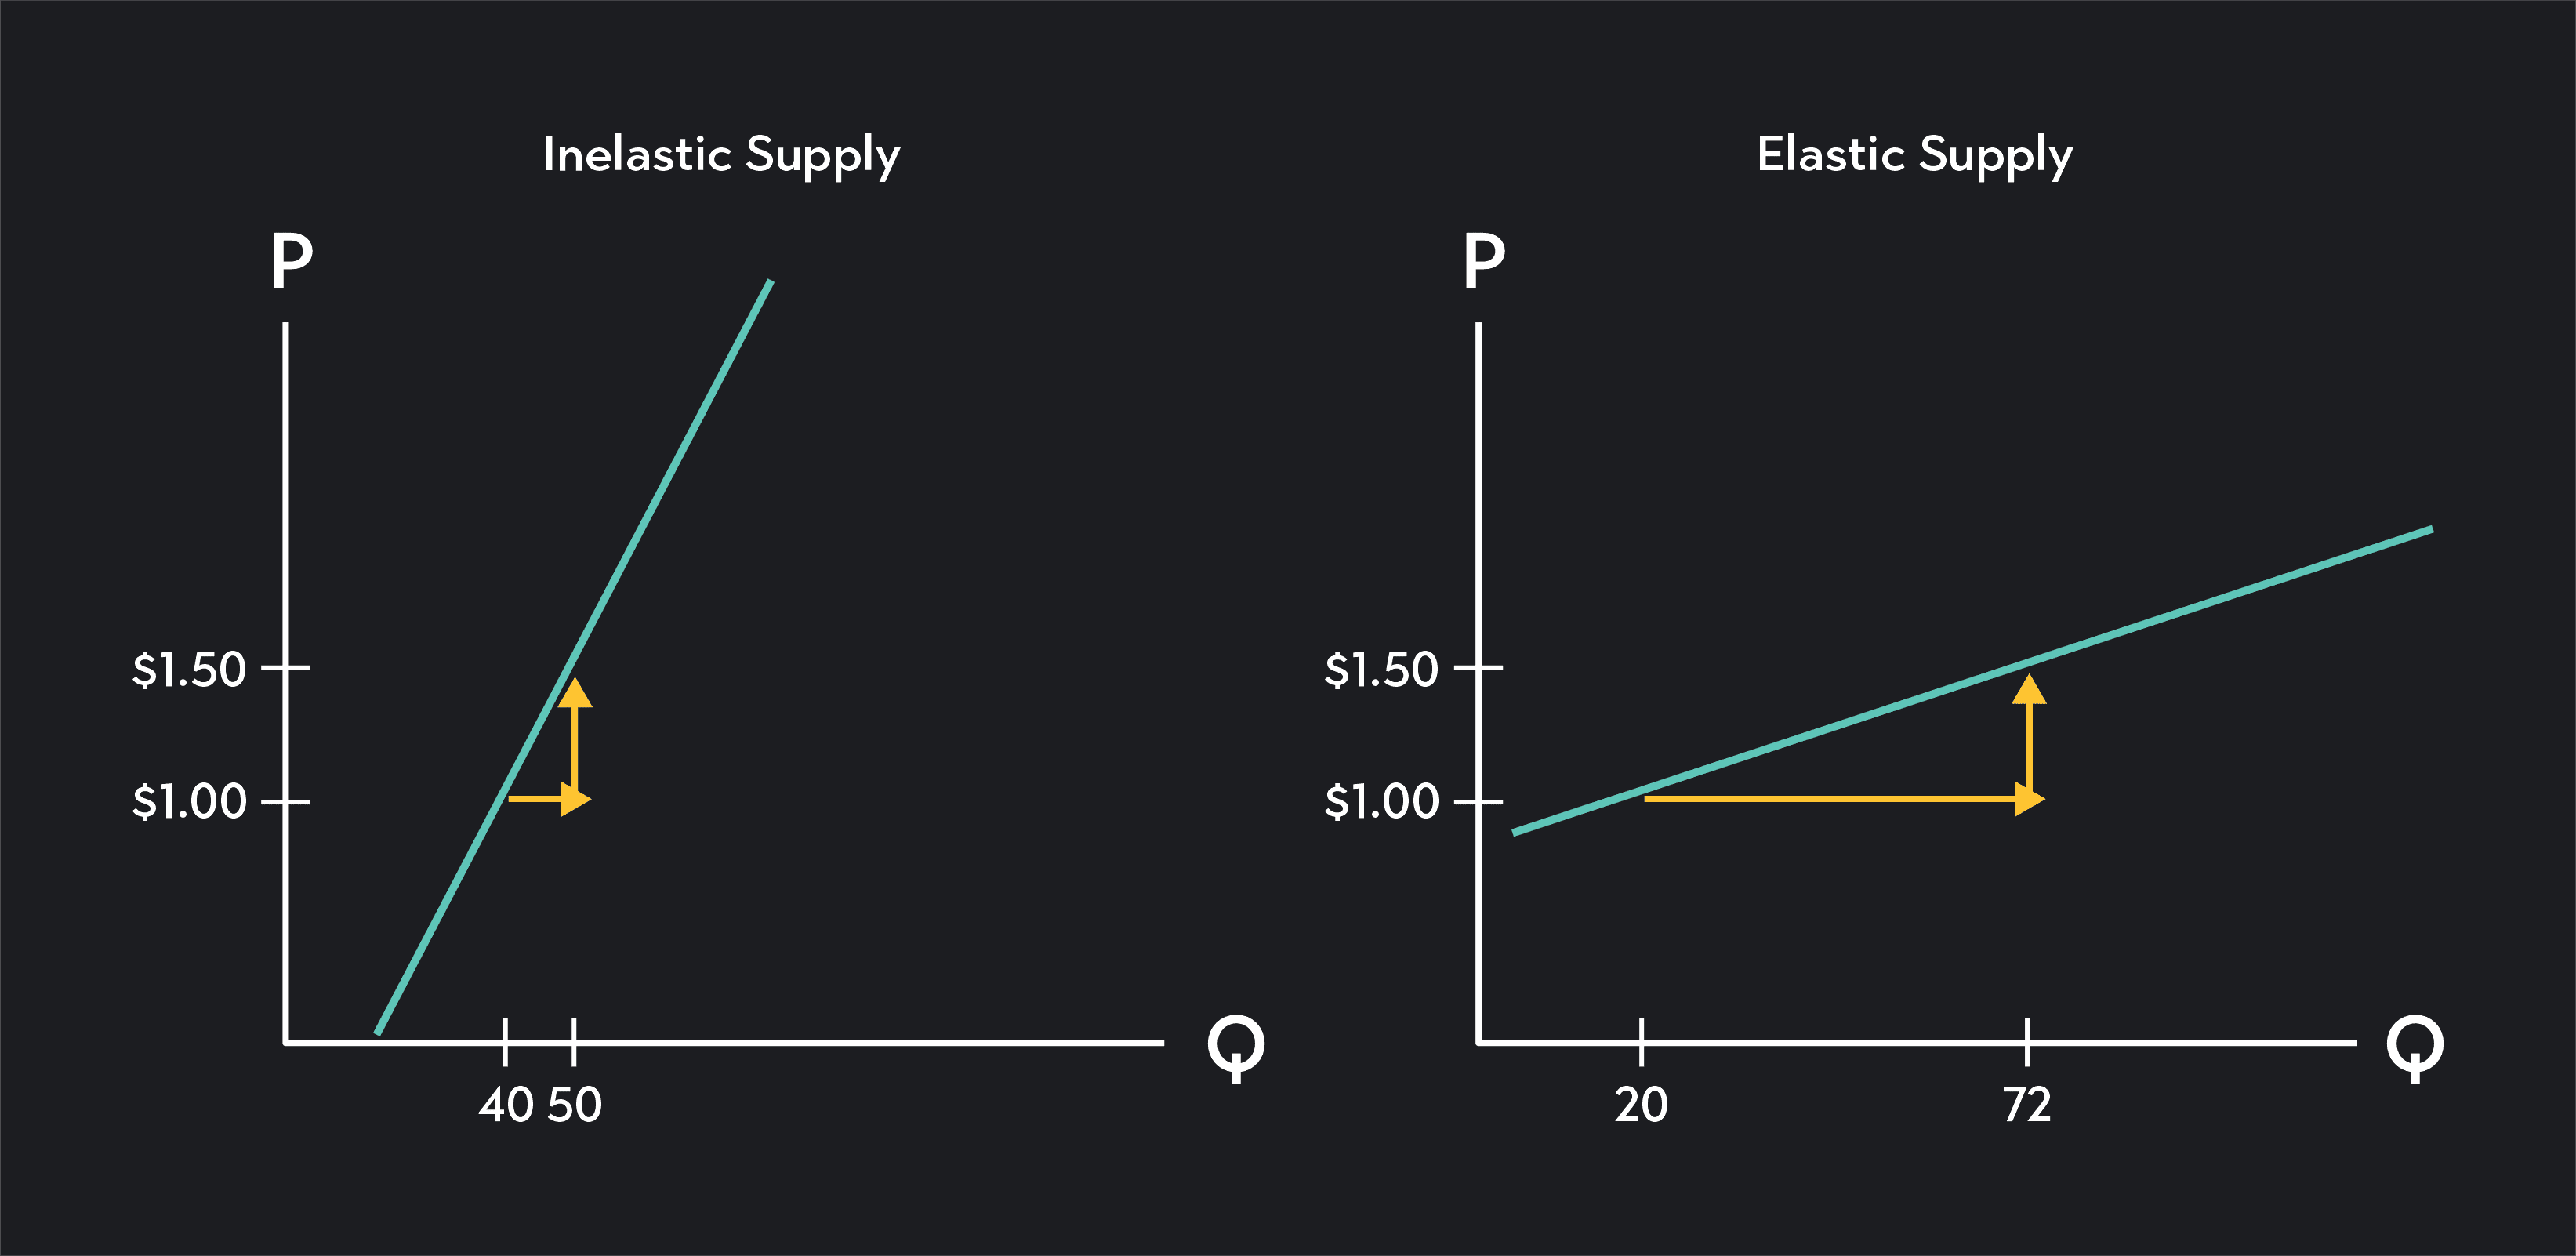
0 | Perfectly inelastic supply |
Between 0 and 1 | Relatively inelastic supply |
1 | Unit elastic supply |
Greater than 1 | Relatively elastic supply |
Infinity | Perfectly elastic supply |
supply is price inelastic because quantity supplied changes proportionately less than price.
factors affecting PES
Time period: supply is usually more elastic in the long run because firms have more time to adjust.
Spare capacity: more spare capacity makes it easier to increase production.
Stocks: firms with available stock can respond more quickly to higher prices.
Availability of factors of production: readily available labour and raw materials make supply more elastic.
Production time: goods that take a long time to produce, such as crops, often have more inelastic supply in the short run.
Mobility of factors of production: if labour and capital can move easily between uses, supply tends to be more elastic.
Key distinction: PED is about consumers; PES is about producers
price inelastic demand (PED)
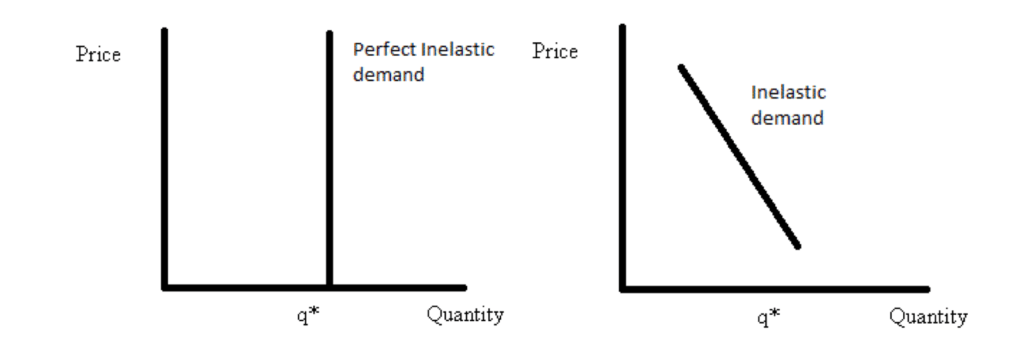
Price inelastic demand occurs when the percentage change in quantity demanded is smaller than the percentage change in price.
The absolute value of PED is less than 1.
PED<1
demand is price inelastic because consumers reduce their purchases by a smaller percentage than the price increase
why might demand be inelastic?
The good is a necessity.
There are few close substitutes.
Consumers are loyal to a brand.
The good takes up a small proportion of income.
Consumers have little time to change their habits.
what happens to total revenue?
When demand is price inelastic:
Price rises → total revenue tends to rise.
Price falls → total revenue tends to fall.
This is because the percentage change in quantity demanded is smaller than the percentage change in price.
market equillibrium
Market equilibrium is the point at which quantity demanded equals quantity supplied.
QD=QS
At equilibrium, there is no excess demand or excess supply.

key terms
Equilibrium price: the price at which QD = QS.
Equilibrium quantity: the quantity bought and sold at the equilibrium price.
Disequilibrium: when quantity demanded and quantity supplied are not equal.
Excess demand (shortage): QD > QS.
Excess supply (surplus): QS > QD.
how does the market return to equilibrium?
A. Excess demand
Imagine concert tickets are priced too low.
Consumers want more tickets than firms supply.
There is a shortage.
Consumers compete to buy the limited tickets, putting upward pressure on price.
As price rises, quantity demanded falls and quantity supplied rises.
The market moves towards equilibrium.
Chain: QD > QS → shortage → price rises → QD falls and QS rises → equilibrium.
B. Excess supply
Imagine a shop charges too much for a product.
Firms supply more than consumers want to buy.
There is a surplus.
Unsold stock puts downward pressure on price.
As price falls, quantity demanded rises and quantity supplied falls.
The market moves towards equilibrium.
Chain: QS > QD → surplus → price falls → QD rises and QS falls → equilibrium.
what causes equilibrium price and quantity to change?
A change in a non-price determinant shifts the demand or supply curve.
Change | Equilibrium price | Equilibrium quantity |
|---|---|---|
Demand increases | ↑ | ↑ |
Demand decreases | ↓ | ↓ |
Supply increases | ↓ | ↑ |
Supply decreases | ↑ | ↓ |
examples:
Demand increases: a product becomes more popular.
Demand decreases: consumer incomes fall for a normal good.
Supply increases: production costs fall.
Supply decreases: raw material costs rise.
If both demand and supply shift at the same time, the final change in equilibrium price or quantity may be uncertain. It depends on the relative size of the shifts.
Exam tip: A change in the product's own price causes a movement along a curve. A change in another determinant causes the curve to shift.
functions of the price mechanism
The price mechanism is the process through which demand and supply determine prices, helping to allocate scarce resources in a market economy.
A. Rationing function
→the rationing function uses prices to allocate scarce goods and services between consumers.
how it works
Demand for a good exceeds supply.
The price rises.
Some consumers are no longer willing or able to pay.
Quantity demanded falls, helping to reduce the shortage.
Example: If concert tickets are scarce, a higher price may mean that only consumers willing and able to pay that price can buy them.
Memory question: Who gets the scarce product?
B. Incentive function
→the incentive function means that changes in prices encourage consumers and producers to change their behaviour.
how it works
The price of strawberries rises.
Selling strawberries becomes potentially more profitable.
Farmers have an incentive to grow and supply more strawberries.
Quantity supplied increases.
When prices fall, producers may have less incentive to supply the product.
Memory question: What encourages producers to supply more or less?
C. Signalling function
→the signalling function means that price changes communicate information about changing market conditions to consumers and producers.
how it works
Demand for electric cars increases.
The price of electric cars rises, assuming supply does not adjust immediately.
The higher price signals that the market may be willing to pay more for electric cars.
Firms may respond by increasing production.
Memory question: What information does the price communicate?
D. Allocative function
→the allocative function describes how resources are directed towards producing goods and services that consumers value.
Example
Demand for electric cars increases → their price rises → firms have an incentive to increase production → more labour and capital may be allocated to electric car production.
This helps answer the economic questions:
What should be produced?
How should it be produced?
For whom should it be produced?
Advantages and disadvantages of the price mechanism
Advantages | Disadvantages |
|---|---|
Prices help allocate scarce resources. | Consumers with low incomes may be unable to afford necessities. |
Higher prices can encourage firms to increase supply. | Markets may fail to account for external costs, such as pollution. |
Price changes communicate information. | Consumers may have imperfect information. |
Consumer demand can influence what firms produce. | Profit incentives may not provide socially desirable outcomes. |
for example, the market may allocate more resources to profitable luxury goods than to essential goods for people who cannot afford to pay. This illustrates why the price mechanism does not always produce a socially desirable allocation.