Economics Flashcards
Background to Supply
Short-run Theory of Production
Profits and Aims of the Firm:
Traditional and alternative theories.
In the short run, firms aim to maximize profits by analyzing production functions and understanding the relationship between input variables and output.
Long-run vs. Short-run Production:
Fixed and variable factors of production.
Law of Diminishing Returns:
When increasing amounts of a variable factor are used with a given amount of a fixed factor, there will come a point when each extra unit of the variable factor will produce less extra output than the previous unit.
Short-run Production Function
Total Physical Product (TPP)
Average Physical Product (APP)
APP={TPP}/{QV}
Marginal Physical Product (MPP)
MPP={\Delta TPP}/{\Delta QV}
Example: Wheat Production
Number of Workers (Lb) | TPP (tonnes) | APP (=TPP/Lb) | MPP (=ΔTPP/ΔLb) |
|---|---|---|---|
0 | 0 | – | – |
1 | 3 | 3 | 3 |
2 | 10 | 5 | 7 |
3 | 24 | 8 | 14 |
4 | 36 | 9 | 12 |
5 | 40 | 8 | 4 |
6 | 42 | 7 | 2 |
7 | 42 | 6 | 0 |
8 | 40 | 5 | -2 |
Graphical Relationship
Relationship between TPP, APP, and MPP is shown graphically.
TPP increases with the number of farm workers up to a point, then declines.
Diminishing returns set in at a certain point.
MPP illustrates the change in TPP with each additional worker.
Short-run Costs
Measuring Costs of Production:
Fixed Costs: Costs that do not change with the level of output, such as rent and salaries.
Variable Costs: Costs that vary with the level of production, including raw materials and labor.
Total Costs: The sum of fixed and variable costs at a given level of output.
Explicit Costs
These are direct, out-of-pocket expenses that a firm incurs during the production process, such as wages, rent, and material costs.
Implicit Costs
These represent the opportunity costs of utilizing resources owned by the firm, reflecting the income that could have been earned if those resources were employed in their next best alternative use.
Fixed Costs and Variable Costs:
Fixed Costs and Sunk Costs
Total Costs:
Total Fixed Cost (TFC)
Total Variable Cost (TVC)
Total Cost (TC)
TC = TFC + TVC
Example: Total Costs for Firm X
Output (Q) | TFC (£) | TVC (£) | TC (£) |
|---|---|---|---|
0 | 12 | 0 | 12 |
1 | 12 | 10 | 22 |
2 | 12 | 16 | 28 |
3 | 12 | 21 | 33 |
4 | 12 | 28 | 40 |
5 | 12 | 40 | 52 |
6 | 12 | 60 | 72 |
7 | 12 | 91 | 103 |
Cost Curves
TFC is constant regardless of output.
TVC increases with output.
TC is the sum of TFC and TVC.
Diminishing marginal returns affect the shape of TVC and TC.
Marginal Cost (MC)
Marginal Cost and the Law of Diminishing Returns
Relationship between Marginal and Total Cost Curves
Average Costs
Average Fixed Cost (AFC)
Average Variable Cost (AVC)
Average (Total) Cost (AC)
Relationship between AC and MC
Example: Total, Average, and Marginal Cost for Firm X
Output (Q) | TFC (£) | AFC (£) | TVC (£) | AVC (£) | TC (£) | AC (£) | MC (£) |
|---|---|---|---|---|---|---|---|
0 | 12 | – | 0 | – | 12 | – | – |
1 | 12 | 12 | 10 | 10 | 22 | 22 | 10 |
2 | 12 | 6 | 16 | 8 | 28 | 14 | 6 |
3 | 12 | 4 | 21 | 7 | 33 | 11 | 5 |
4 | 12 | 3 | 28 | 7 | 40 | 10 | 7 |
5 | 12 | 2.4 | 40 | 8 | 52 | 10.4 | 12 |
6 | 12 | 2 | 60 | 10 | 72 | 12 | 20 |
7 | 12 | 1.7 | 91 | 13 | 103 | 14.7 | 31 |
AFC decreases as output increases.
AVC, AC, and MC are U-shaped due to diminishing returns.
MC intersects AC at its minimum point.
Long-run Theory of Production
All factors variable in the long run.
Scale of Production:
Increasing Returns to Scale
Constant Returns to Scale
Decreasing Returns to Scale
Economies of Scale
Specialization and Division of Labor
Indivisibilities
Container Principle
Greater Efficiency of Large Machines
By-products
Multi-stage Production
Organizational and Administrative Economies
Financial Economies
Economies of Scope
Diseconomies of Scale
Managerial Complexity
Alienation
Industrial Relations Problems
Disruption if part of complex production chains fail
External Economies and Diseconomies of Scale
Location
Costs vary in different locations
Transport Costs: Location relative to market and suppliers
Optimum Combination of Factors
Two-factor case:
If{MPPa}/{Pa}>{MPPb}/{Pb} costs can be reduced by using more factor a and less factor b.
Costs minimized where: MPPa/Pa = MPPb/Pb
Multi-factor case:
Costs minimized where: MPPa/Pa= MPPb/Pb = … MPPn/Pn
(the equi-marginal principle)
Isoquant-Isocost Analysis
Isoquants
Shape of isoquants.
Diminishing Marginal Rate of Substitution (MRS)
Isoquant Map
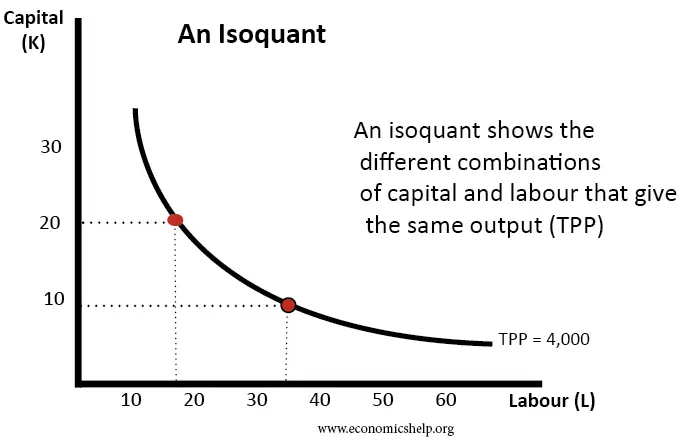
Diminishing Marginal Rate of Substitution (MRS)
MRS = frac{\Delta K}{\Delta L}
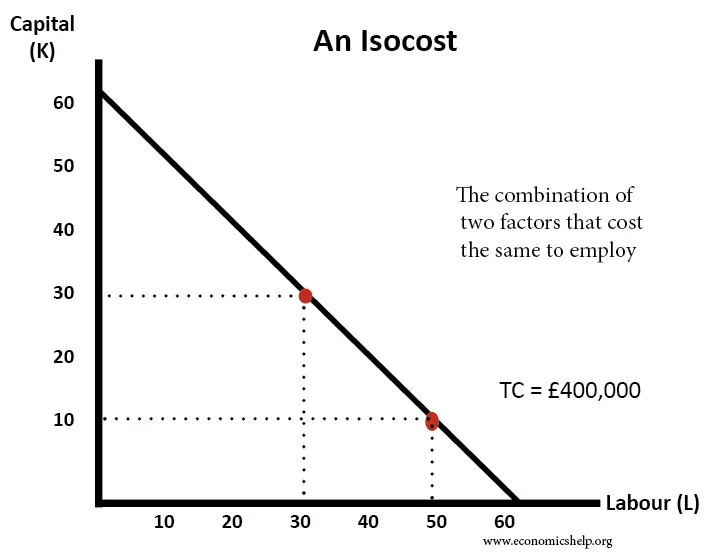
Isocosts
Slope and position of the isocost.
Shifts in the isocost.
Least-cost Combination of Factors for a Given Output
Point of Tangency
Comparison with Marginal Productivity Approach
Highest Output for a Given Cost of Production
Long-run Costs
Long-run Average Costs (LRAC)
Shape of the LRAC curve.

Assumptions behind the curve.
Alternative LRAC Curves
Economies of Scale
Diseconomies of Scale
Constant Costs
Long-run Marginal Costs (LRMC)
Relationship between Long-run and Short-run Average Costs
The Envelope Curve
Revenue
Defining Total, Average, and Marginal Revenue
Revenue Curves When Firms Are Price Takers (Horizontal Demand Curve)
Average Revenue (AR)
Marginal Revenue (MR)
Total Revenue (TR)
Revenue Curves When Price Varies with Output (Downward-Sloping Demand Curve)
Average Revenue (AR)
Marginal Revenue (MR)
Total Revenue (TR)
Revenue Curves and Price Elasticity of Demand
Shifts in Revenue Curves
Profit Maximisation
Using Total Curves
Maximizing difference between TR and TC
The Total Profit Curve
Using Marginal and Average Curves
Stage 1: Profit Maximized where MR = MC
Stage 2: Using AR and AC Curves to Measure Maximum Profit
Some Qualifications
Long-run Profit Maximization
The Meaning of Profit
What if a Loss Is Made?
Loss Minimizing: Still Produce where MR = MC
Short-run Shut-down Point: P = AVC
Long-run Shut-down Point: P = LRAC