Handouts - Framework-and-Industry-Innovation_Group2 (1).docx
 Republic of the Philippines
SORSOGON STATE UNIVERSITY
College of Business and Management Entrepreneurship
Sorsogon City Campus
Magsaysay Street, Salog (Pob.) Sorsogon City, Sorsogon
Tel. No.: 056 211-0103; Email address: bsent.cbm@sorsu.edu.ph
ST 4-2018 – INDUSTRY TRENDS AND INNOVATION IN TOURISM
Second Semester, 2024-2025

Leader: MANGAMPO, SHERRY LYN
Members: DOLINDO, ANA MARIE JANAPIN, ANTHONY FUNTANAR, JONALYN
DESPABILADERO, CAMILLE ROSE RENOVALLES, ADRHEINE DIONELA, REYMIL
SEÑA, MARK ALDREN PURA, JANNA QUIDOSOY, ANGELIE DAGÑALAN, CRISELLE
NISHIHARA, RICHIEN ANN DOLOIRAS, ANNE RICHEL FUNTANARES, KARL BAUTISTA, MARCEL
BS ENTREPRENEURSHIP 4A


Trend Analysis Models: PESTLE, SWOT, and PORTER's FIVE FORCES
 Trend analysis is a statistical approach to identifying patterns or changes in data over time. It’s used to help predict future business dynamics and inform decision-making. Trend analysis helps organizations forecast future market developments by examining historical data patterns. For instance, an ecommerce company could use sales data to predict demand for various product categories. If an increasing interest in smart home devices is detected, the company can adjust inventory and marketing strategies to leverage this trend.
 PESTLE Analysis
PESTLE analysis is an analytical tool which considers external factors and helps to analyse the impact on the organisation or project. This analysis was originally created by Harvard professor Francis Aguilar as a scanning tool with the acronym “ETPS” which stood for Economic, Technical, Political, and Social. This was further developed in the 1980s by several other authors later to create the PESTLE acronym which stands for Political, Economic, Social, Technological, Legal and Environmental. There are many benefits of PESTLE:
- It helps organisations to understand the big picture of the environment in which they are operating and be able to minimize the threats and take advantage of the opportunities.
- Encourages firms to think about the wider environment from a short- and long-term perspective.
- It helps to identify business opportunities and gives insight into significant threats.
PESTLE forms part of a strategic plan and should be repeated at regular stages—minimum 6 months’ period—as the macro environment is constantly changing. By conducting regular reviews organisations will be able to create a competitive advantage.
What does PESTLE mean?
PESTLE is an acronym which stands for the different factors used in analysing the impact of the external environment. It stands for:
P – Political
E – Economic
S – Social
T – Technological
L – Legal
E – Environmental


 Political Factors
These are all about how and to what degree a government intervenes in the economy. This can include – government policy, political stability or instability in overseas markets, foreign trade policy, tax policy, labour law, environmental law, trade restrictions and so on. It is clear from the list above that political factors often have an impact on organisations and how they do business. Organisations need to be able to respond to the current and anticipated future legislation, and adjust their approach and policy accordingly.
Examples : Regulation of competition, Industry regulation, Fiscal policy, Business incentives, Apprenticeships, Grants, and Elections
 Economic Factors
Economic factors have a significant impact on how an organisation does business and also how profitable they are. Factors include – economic growth, interest rates, exchange rates, inflation, disposable income of consumers and businesses and so on.
These factors can be further broken down into macroeconomic and microeconomic factors. Macro-economic factors deal with the management of demand in any given economy.
Governments use interest rate control, taxation policy and government expenditure as their main mechanisms they use for this. Micro-economic factors are all about the way people spend their incomes.
 Examples : Interest rates, Consumer confidence, Exchange rates, GDP, Investor confidence in related companies, and The emergence of new models.
Social Factors
Also known as socio-cultural factors, they are the areas that involve the shared belief and attitudes of the population. These factors include – population growth, age distribution, health consciousness, career attitudes and so on. These factors are of particular interest as they have a direct effect on how we understand customers and what drives them.
 Examples : Changing demographics, Impact of pressure groups, Consumer trends, Behavioural change,and Changing public opinions.
Technological Factors
We all know how fast the technological landscape changes and how this impacts the way we need to do business. Technological factors affect the way we do business in a number of ways, including new ways of producing and distributing goods and services and communicating with target audiences
 Examples: New/disruptive tech, Device and platform use, New manufacturing processes and tools, New data/information practices,and New technology-led business processes.
Legal Factors
Legal factors include - health and safety, equal opportunities, advertising standards, consumer rights and laws, product labelling and product safety. It is clear that companies need to know what is and what is not legal in order to trade successfully. If an organisation trades globally this becomes a very tricky area to get right as each country has its own set of rules and regulations.
Examples: Employment law (e.g. minimum wage, living wage), Health and safety regulations, Environmental regulation, GDPR and other data laws


 Environmental Factors
These factors have only really come to the forefront in the last fifteen years or so. They have become important due to the increasing scarcity of raw materials, pollution targets, doing business as an ethical and sustainable company, carbon footprint targets set by governments (this is a good example where one factor could be classed as political and environmental at the same time). These are just some of the issues business leaders face within this factor. More and more consumers are demanding that the products they buy are sourced ethically and if possible from a sustainable source.
Examples: Sustainability, Financial practices, Ethical sourcing, Carbon emissions, and Data handling and user privacy practices
 Advantages of PESTLE Analysis
Performing a PEST analysis has several benefits for the organization, as it allows us to anticipate possible threats. Although certain phenomena that are impossible to predict may appear, having a solid foundation of each aspect that threatens our business plan is a prudent way to operate. If you are not completely convinced, we list some benefits of implementing this type of analysis in your operations below.
- It helps you spot trading opportunities and gives you a warning of significant threats.
- It reveals the change of direction within the organization. This helps you shape your actions to work with the change rather than against it.
- Avoid starting projects that are likely to fail for reasons you can’t control.
- It helps you leave assumptions behind when you enter a new market, allowing you to develop an objective view of this new environment.
- It provides an overview of all the crucial external influences on the organization.
- It supports more decisive and well-informed decision-making.
- Assists in planning, marketing, organizational change initiatives, business and product development, project management, and research papers.
 How Do You Do a PESTLE Analysis Step By Step?
While there is no clearly defined way of doing a PESTLE analysis from start to finish, a systematic planning process and approach can increase efficiency and impact.
Here are six steps to do a PESTLE analysis the right way.
Prepare for your analysis 
Before you begin, lay the groundwork to ensure accuracy, quality, and focus. The saying “measure twice, cut once” will pay dividends down the line.
Create a founding document that answers these questions:
Why — The reason you’re conducting a PESTLE analysis.
What — The scope, goals, and initiatives.
Who — The key people needed in the analysis process. Where — Where are we going to look for information? When — The deadlines for the data and final insights.
Answering these questions will explain how to approach your PESTLE analysis.

 Collect data for your PESTLE analysis
Gather the information you need to fill out your PESTLE diagram. This may require primary research and consultation with external industry experts. You will likely need various types of data and information.
But don’t get bogged down in data and research. A PESTLE analysis is meant to speed up traditional research by focusing your efforts.
To streamline the process, concentrate on one area at a time and address them sequentially according to the acronym. That way, team efforts can be focused, and progress tracking can be easier.
Complete a PESTLE diagram 
 It’s time to make sense of your research by putting the collected information into a PESTLE diagram.
Remember that PESTLE analysis aims to cut through the noise and provide a clear idea of the external environmental influences to consider.
Divide the factors and segment them appropriately, making them easy to understand for the rest of the team. For example, if you are listing social factors, divide this list into sub-sections, such as consumer behavior, cultural norms, and work-related matters.
Interpret and evaluate your results 
Use this information to interpret the macroenvironmental factors that can impact your organization's future plan and come up with strategies to handle them.
 Remember, not all factors will have the same impact and importance to your organization. You can use tools like a risk matrix to assess the probability of occurrence and impact on your organization. This will help you to focus your efforts and prioritize strategic initiatives.
Put together an action plan
Use insights from your PESTLE diagram and other strategic analyses to create an action plan that addresses identified risks, threats, and opportunities.
For example, the rising logistical cost (a combination of technological and economic factors) of moving products to particular markets could be handled in a number of ways, such as:
- Shifting the organization’s growth focus to other markets.
- Insourcing key parts of the logistics chain.
- Revising the organization’s pricing strategy.
- Developing internal capacities to build components.
- Outsourcing production to a third party in another country.
- Lobbying governments to reduce trade tariffs and excise fees.
Review and monitor external signals 
New technology can disrupt an industry, diplomatic relations can sour, and customer sentiment can shift.
 Any strategy that doesn’t evolve and adapt won’t have an actual impact. Make sure that revision and monitoring are fundamental parts of your strategic processes.
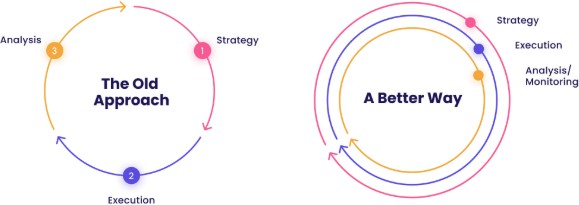
You need to treat strategy, execution, and analysis as complementary elements if you want to create an adaptive strategy and successfully manage disruptions.


SWOT analysis is a framework for identifying and analyzing an organization's strengths, weaknesses, opportunities and threats. These words make up the SWOT acronym.
The primary goal of SWOT analysis is to increase awareness of the factors that go into making a business decision or establishing a business strategy. To do this, SWOT analyzes the internal and external environment and the factors that can impact the viability of a decision.
Businesses commonly use SWOT analysis, but it is also used by nonprofit organizations and, to a lesser degree, individuals for personal assessment. SWOT is also used to assess initiatives, products or projects. As an example, CIOs could use SWOT to help create a strategic business planning template or perform a competitive analysis.
The SWOT framework is credited to Albert Humphrey, who tested the approach in the 1960s and 1970s at the Stanford Research Institute. SWOT analysis was originally developed for business and based on data from Fortune 500 companies. It has been adopted by organizations of all types as a brainstorming aid to making business decisions.

When and why should you do a SWOT analysis?
SWOT analysis is often used either at the start of, or as part of, a strategic planning process. The framework is considered a powerful support for decision-making because it enables an organization to uncover opportunities for success that were previously unarticulated. It also highlights threats before they become overly burdensome.
SWOT analysis can identify a market niche in which a business has a competitive advantage. It can also help individuals plot a career path that maximizes their strengths and alert them to threats that could thwart success.
This type of analysis is most effective when it's used to pragmatically recognize and include business issues and concerns. Consequently, SWOT often involves a diverse cross-functional team capable of sharing thoughts and ideas freely. The most effective teams would use actual experiences and data -- such as revenue or cost figures -- to build the SWOT analysis.

Elements of a SWOT Analysis
 As its name states, a SWOT analysis examines four elements:
- Internal attributes and resources that support a successful outcome, such as a diverse product line, loyal customers or strong customer service.
- Internal factors and resources that make success more difficult to attain, such as a weak brand, excessive debt or inadequate staffing or training.
- External factors that the organization can capitalize on or take advantage of, such as favorable export tariffs, tax incentives or new enabling technologies.
 External factors that could jeopardize the entity's success, such as increasing competition, weakening demand or an uncertain supply chain.
Strengths
Strengths describe what an organization excels at and what separates it from the competition: a strong brand, loyal customer base, a strong balance sheet, unique technology, and so on. For example, a hedge fund may have developed a proprietary trading strategy that returns
 market-beating results. It must then decide how to use those results to attract new investors.
Weaknesses
 Weaknesses stop an organization from performing at its optimum level. They are areas where the business needs to improve to remain competitive: a weak brand, higher-than-average turnover, high levels of debt, an inadequate supply chain, or lack of capital.
Opportunities
 Opportunities refer to favorable external factors that could give an organization a competitive advantage. For example, if a country cuts tariffs, a car manufacturer can export its cars into a new market, increasing sales and market share.
Threats
Threats refer to factors that have the potential to harm an organization. For example, a drought is a threat to a wheat-producing company, as it may destroy or reduce the crop yield. Other common threats include things like rising costs for materials, increasing competition, tight labor supply, and so on.
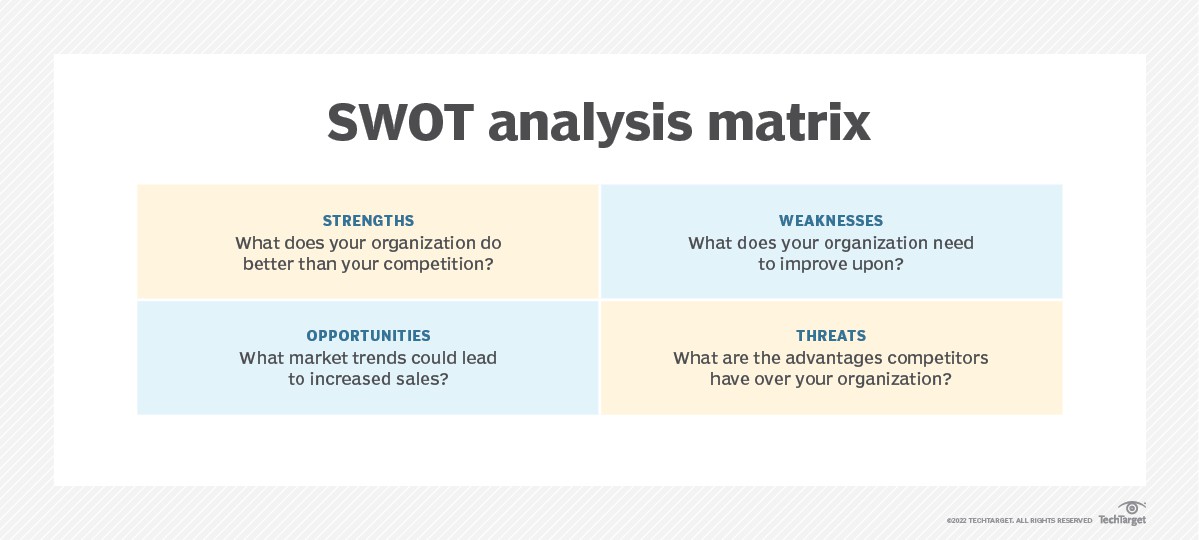
 A SWOT matrix is often used to organize the items identified under each of these four elements. The matrix is usually a square divided into four quadrants, with each quadrant representing one of the specific elements. Decision-makers identify and list specific strengths in the first quadrant, weaknesses in the next, then opportunities and, lastly, threats.


How to Do a SWOT Analysis?
A SWOT analysis can be broken into several steps with actionable items before and after analyzing the four components. In general, a SWOT analysis will involve the following steps.

Step 1: Determine Your Objective
A SWOT analysis can be broad, though more value will likely be generated if the analysis is pointed directly at an objective. For example, the objective of a SWOT analysis may focused only on whether or not to perform a new product rollout. With an objective in mind, a company will have guidance on what they hope to achieve at the end of the process. In this example, the SWOT analysis should help determine whether or not the product should be introduced.

Step 2: Gather Resources
Every SWOT analysis will vary, and a company may need different data sets to support pulling together different SWOT analysis tables. A company should begin by understanding what information it has access to, what data limitations it faces, and how reliable its external data sources are.
In addition to data, a company should understand the right combination of personnel to have involved in the analysis. Some staff may be more connected with external forces, while various staff within the manufacturing or sales departments may have a better grasp of what is going on internally. Having a broad set of perspectives is also more likely to yield diverse, value-adding contributions.

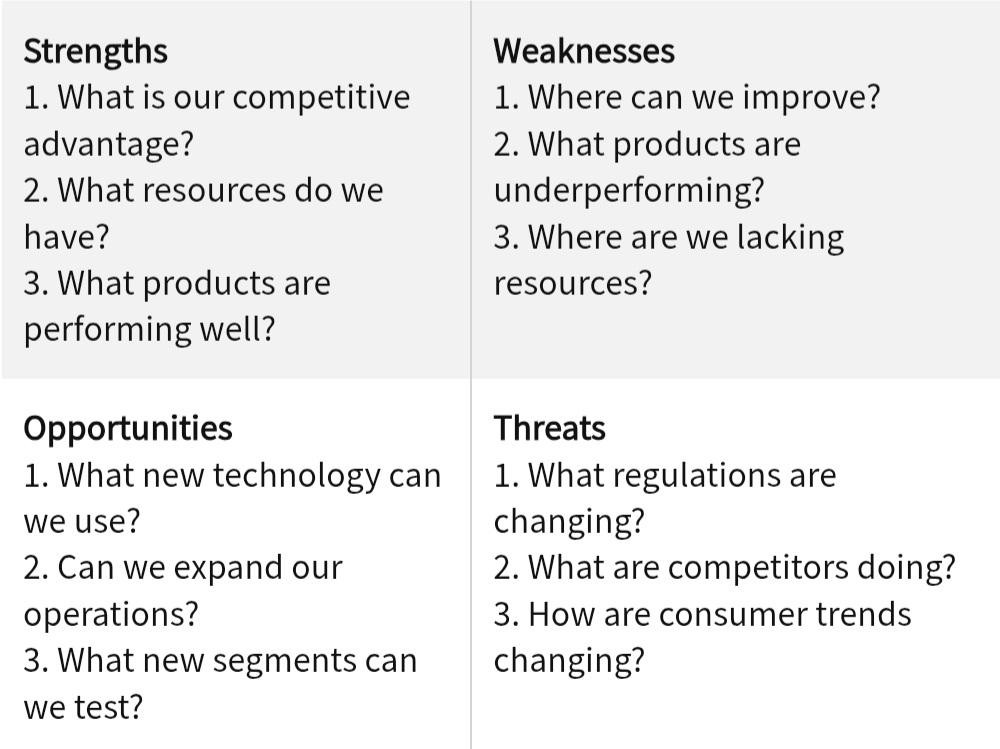
Step 3: Compile Ideas
For each of the four components of the SWOT analysis, the group of people assigned to perform the analysis should begin listing ideas within each category. Examples of questions to ask or consider for each group are in the table below.

Step 4: Refine Findings
With the list of ideas within each category, it is now time to clean-up the ideas. By refining the thoughts that everyone had, a company can focus on only the best ideas or largest risks to the company. This stage may require substantial debate among analysis participants, including bringing in upper management to help rank priorities.


Step 5: Develop the Strategy
Armed with the ranked list of strengths, weaknesses, opportunities, and threats, it is time to convert the SWOT analysis into a strategic plan. Members of the analysis team take the bulleted list of items within each category and create a synthesized plan that provides guidance on the original objective.
For example, the company debating whether to release a new product may have identified that it is the market leader for its existing product and there is the opportunity to expand to new markets. However, increased material costs, strained distribution lines, the need for additional staff, and unpredictable product demand may outweigh the strengths and opportunities. The analysis team develops the strategy to revisit the decision in six months in hopes of costs declining and market demand becoming more transparent.

Example of a SWOT Analysis
The end result of a SWOT analysis should be a chart or list of a subject's characteristics. The following is an example of a SWOT analysis of an imaginary retail employee:
- Strengths: good communication skills, on time for shifts, handles customers well, gets along well with all departments, physical strength, good availability.
- Weaknesses: takes long smoke breaks, has low technical skill, very prone to spending time chatting.
- Opportunities: storefront worker, greeting customers and assisting them to find products, helping keep customers satisfied, assisting customers post-purchase and ensuring buying confidence, stocking shelves.
- Threats: occasionally missing time during peak business due to breaks, sometimes too much time spent per customer post-sale, too much time in interdepartmental chat.

Benefits of SWOT Analysis
- A SWOT analysis makes complex problems more manageable. There may be an overwhelming amount of data to analyze and relevant points to consider when making a complex decision. In general, a SWOT analysis that has been prepared by paring down all ideas and ranking bullets by importance will aggregate a large, potentially overwhelming problem into a more digestible report.
- A SWOT analysis requires external considerations. Too often, a company may be tempted to only consider internal factors when making decisions. However, there are often items out of the company's control that may influence the outcome of a business decision. A SWOT analysis covers both the internal factors a company can manage and the external factors that may be more difficult to control.
- A SWOT analysis can be applied to almost every business question. The analysis can relate to an organization, team, or individual. It can also analyze a full product line, changes to brand, geographical expansion, or an acquisition. The SWOT analysis is a versatile tool that has many applications.
- A SWOT analysis leverages different data sources. A company will likely use internal information for strengths and weaknesses. The company will also need to gather external information relating to broad markets, competitors, or macroeconomic forces for opportunities and threats. Instead of relying on a single, potentially biased source, a good SWOT analysis compiles various angles.
 A SWOT analysis may not be overly costly to prepare. Some SWOT reports do not need to be overly technical; therefore, many different staff members can contribute to its preparation without training or external consulting.


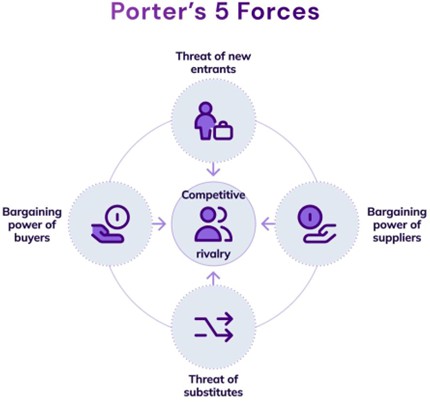
Porter's Five Forces model is a strategic framework that helps to identify and analyze five competitive forces that affect a company’s profitability in any given industry. This framework was developed by Harvard Business School professor Michael Porter in 1979. Understanding these forces enables companies to create strategies for maintaining a competitive advantage.
These five forces are:
- Threat of new entrants
- Bargaining power of suppliers
- Bargaining power of buyers
- Threat of substitute products or services
- Competitive rivalry
 Porter’s Five Forces model is a critical element of strategic analysis that helps companies understand and shape the industry structure to balance competitive forces and maximize profitability. By analyzing the five forces, companies can gain insights into the intensity of the competitive landscape and the factors influencing profitability.

The Five Forces
Threat of New Entrants
 The risk posed by new competitors entering the market.
- New competitors can disrupt the market by introducing new ideas and price competition.
- Barriers to entry (e.g., capital investment, regulations, brand loyalty) affect the risk level.
Examples: High start-up costs in the airline industry reduce threats; low entry barriers in e-commerce increase threats.
Bargaining Power of Suppliers
- The influence suppliers have over pricing and the availability of essential inputs.
- Suppliers control prices and supply availability, impacting production costs and profit margins.
- A few dominant suppliers create strong bargaining power, while multiple suppliers reduce it.
- The influence suppliers have over pricing and the availability of essential inputs.
Example: Tech firms relying on semiconductor suppliers face strong supplier power.

 Bargaining Power of Buyers
- The influence customers have on the pricing and quality of products and services.
- Customers influence prices and demand higher quality products.
- Strong buyer power exists when customers have many alternatives or bulk purchasing power.
- The influence customers have on the pricing and quality of products and services.
Example: Supermarkets negotiating with small food producers have strong buyer power.
Threat of Substitutes (products or services)
- The risk that customers will switch to alternative products or services.
- Alternative products or services that fulfill the same need can limit profitability.
- A high threat exists when switching costs are low or substitutes offer better value.
- The risk that customers will switch to alternative products or services.
Example: Ride-sharing services threatening traditional taxi businesses.
Industry Rivalry
- The intensity of competition among existing competitors within an industry.
- The intensity of competition among existing players determines market profitability.
- Factors: Number of competitors, differentiation, industry growth rate.
- The intensity of competition among existing competitors within an industry.
 Example: Smartphone industry rivalry between Apple, Samsung, and other brands.
Using Porter’s Five Forces for Strategic Advantage
- Industry Analysis: Businesses can identify the key forces shaping their industry and assess their potential impact.
- Strategic Planning: Insights from the Five Forces analysis help in crafting strategies to mitigate threats and capitalize on opportunities.
- Innovation and Differentiation: Companies can focus on innovation and differentiation to reduce the impact of competitive forces.
- Partnerships and Alliances: Forming strategic alliances with suppliers or buyers can help mitigate their bargaining power.
- Monitoring and Adaptation: Regularly updating the analysis allows businesses to adapt to changing market dynamics.


TOOLS FOR MARKET RESEARCH AND DATA GATHERING
Market research and data gathering refers to the process of systematically collecting, analyzing, and interpreting information about a target market, including consumer behavior, preferences, and competitor analysis, by using various methods to gather relevant data, such as surveys, interviews, focus groups, and observation, to gain insights and inform business decisions.
Data gathering is a methodical process of obtaining information on a certain topic. It’s critical to make sure your data is acquired legally, ethically, and completely during the collecting process. Otherwise, your analysis will not be true and might have serious repercussions.


 DATA COLLECTION METHODS:
- Primary research - Gathering data directly from consumers through surveys, interviews, focus groups, or experiments.
- Secondary research - Analyzing existing data from industry reports, government statistics, and market research firms.
- Third-party data - which is data that has been aggregated and rented or sold by organizations that do not have a connection to a company or users.
There are two types of data: qualitative, which is contextual, and quantitative, which is numerical. While many data collection techniques are applicable to both types, some are more appropriate for one than the other.
Gathering Data collection is essential to a company’s success since it allows you to guarantee the data’s completeness, quality, and applicability to your company and the problem at hand.
Organizations can evaluate previous initiatives and stay informed about what needs to change thanks to the information obtained.
 Below are essential tools and approaches used in fostering innovation:

1. Surveys and Polls
Surveys and polls are direct tools for gathering data from target audiences. They are among the most popular methods of primary market research, since they can be used to gather qualitative and quantitative research on market trends, and they can cover a huge range of respondents across your customer base. They’re also a format familiar to many people.

2. Focus Groups and Interviews
Focus groups and interviews is a widely used qualitative research method that involves gathering a small group of participants to discuss a particular topic. The goal is to collect data through a structured or semi-structured group discussion, where participants share their opinions, ideas, and perceptions.

3. Big Data Analytics
Big data analytics involves processing massive datasets to uncover patterns and trends that inform strategic decisions. It acts as a powerful tool for market research and data gathering by allowing businesses to collect, analyze, and interpret vast amounts of data from various sources, uncovering hidden patterns, trends, and consumer insights that can inform strategic decisions, optimize marketing campaigns, and identify new market opportunities, providing a much more comprehensive understanding of customer behavior compared to traditional research methods.

4. Social Media Analytics
Social media analytics tools track online conversations, brand mentions, and customer sentiment.


5. Secondary Data Research
Secondary data refers to information that has been gathered by someone else, such as government agencies, industry reports, academic studies, market research firms, and even a company's internal sales data, which can be accessed and analyzed for market research purposes.

6. Artificial Intelligence (AI) in Market Research
AI-powered tools automate data gathering and analysis, offering deeper insights faster. It utilizes technologies like machine learning and natural language processing to analyze large volumes of data from various sources, allowing researchers to identify trends, predict consumer behavior, and gain deeper insights faster than traditional methods, often through tools like sentiment analysis, customer profiling, and real-time data monitoring, enabling more informed decision-making for businesses.

7. Transactional Tracking
You may better understand your consumer base and make judgments regarding focused marketing by tracking the data each time your customers make a purchase.
E-commerce and point-of-sale platforms frequently let you store data as soon as it is generated, which makes it a smooth way to collect data that might yield valuable insights about your customers.

8. Observation
While it can be challenging to set up observation sessions, you can use a third-party tool to record users’ journeys through your site or observe a user’s interaction with a beta version of your site or product. Seeing people interact with your product or website can be helpful for data collection because it allows for candor. If your user experience is confusing or challenging, you can witness it in real-time.

9. Internet-Based Monitoring
Cookies and pixels are two tools you can use to collect behavioral data. Both of these programs monitor users’ online activity across several websites and reveal what kinds of material they find interesting and frequently interact with. Additionally, you may monitor how users behave on your business’s website, including which sections pique their interest the most, whether they encounter any difficulties utilizing it, and how much time they spend on product pages. This can help you make the website look better and make it easier for people to find what they’re looking for.

10. Social Media Monitoring
Tracking information about the interests and motivations of your audience may be done easily by keeping an eye on your business’s social media accounts for follower interaction. There are third-party social media platforms that provide more comprehensive, structured insights gathered from many sources, however many social media platforms come with analytics built in. Social media data can be used to identify the topics that matter most to your following.
For example, you might observe that when your business shares information about its sustainability initiatives, the quantity of engagements skyrockets.


CLAYTON CHRISTENSEN'S THEORY OF DISRUPTIVE INNOVATIONS
Clayton Christensen's theory of disruptive innovation, first introduced in his 1997 book The Innovator's Dilemma, has profoundly impacted how businesses approach innovation and competition. This theory explains how seemingly insignificant innovations can overturn established industries and disrupt the status quo.


Understanding Disruptive Innovation
At its core, disruptive innovation refers to a process where a new entrant, often with limited resources, challenges established companies (incumbents) by targeting underserved or overlooked market segments. This process unfolds in a series of steps:
- Incumbents Focus on High-End Customers: Established companies prioritize their most profitable customers, often neglecting the needs of lower-end or less demanding segments.
- New Entrants Enter the Low-End: Disruptive innovators enter the market by offering simpler, cheaper, and sometimes less sophisticated products or services that cater to the needs of these overlooked segments.
- Incumbents Ignore the Threat: Established companies often fail to recognize the potential threat posed by these new entrants, continuing to focus on their high-margin customer base.
- New Entrants Move Upmarket: As the disruptive innovator improves its product or service, it gradually moves upmarket, attracting customers who were previously loyal to the incumbent.
 Disruption Occurs: Eventually, the disruptive innovator captures a significant portion of the market, displacing the incumbent and transforming the industry.
 Key Concepts and Applications
Christensen's theory highlights several crucial concepts that businesses must consider:
- Not all innovation is disruptive: While the term "disruptive" is often used loosely, Christensen emphasizes that true disruption involves a specific process of targeting overlooked segments and gradually moving upmarket.
- Disruption can be low-end or new-market: Low-end disruption targets overserved customers by offering a "good enough" solution at a lower price, while new-market disruption addresses underserved segments with products that were previously unavailable.

 Disruptive innovation is a process, not a product: The success of a disruptive innovation depends on its ability to evolve and adapt to meet changing customer needs over time.
- Choose your battles wisely: Incumbent companies must carefully assess potential threats and prioritize their resources to address truly disruptive innovations.


Examples of Disruptive Innovations
 Christensen's theory is illustrated by numerous real-world examples:
Netflix: Initially, Netflix offered a DVD-by-mail service, targeting customers who preferred convenience over instant access to new releases. As the company evolved its business model to streaming, it disrupted the traditional video rental industry, ultimately leading to the decline of companies like Blockbuster.
Apple: Apple's early personal computers were initially marketed as toys for children, targeting a lower-end market segment that could not afford expensive minicomputers. As Apple improved its products and expanded its offerings, it disrupted the computer industry, eventually becoming a dominant force.

 Examples of Disruptive Innovations in the Philippines
Christensen's theory is illustrated by numerous real-world examples in the Philippines:
E-commerce: The rise of online marketplaces like Lazada and Shopee disrupted traditional retail in the Philippines. These platforms offered convenience, lower prices,
and a wider selection of products, attracting customers who were previously reliant on
physical stores. This shift has led to the growth of e-commerce in the country, with more Filipinos now opting to shop online.
Ride-Hailing Services: Grab and Angkas disrupted the traditional taxi industry in the Philippines by offering a more convenient and affordable way to get around. These apps allowed users to book rides quickly and easily, often at lower prices than traditional taxis. This disruption has led to significant changes in the transportation sector, with many Filipinos now relying on ride-hailing services for their daily commutes.
Mobile Banking: The emergence of mobile banking apps like GCash and PayMaya disrupted traditional banking in the Philippines. These apps offered a more convenient and accessible way to manage finances, allowing users to send money, pay bills, and make purchases without visiting a physical bank branch. This disruption has led to increased financial inclusion in the Philippines, with more people now having access to financial services.

 E-Trikes and E-Jeepneys: The introduction of e-trikes and e-jeepneys is disrupting the traditional tricycle and jeepney industry in the Philippines. These electric vehicles offer a more environmentally friendly and efficient alternative to traditional vehicles, with lower operating costs and reduced emissions. This disruption is still in its early stages, but it has the potential to significantly impact the transportation sector in the Philippines.


 Implications and Challenges
Christensen's theory has significant implications for both established companies and new entrants:
Incumbents: Companies must be vigilant in monitoring emerging technologies and market trends to identify potential disruptive threats. They should consider investing in innovation and exploring new market segments to stay ahead of the curve.
New Entrants: Understanding the principles of disruptive innovation can help entrepreneurs identify opportunities to create successful businesses by targeting overlooked customer needs.
However, the theory has also been criticized for its limitations:
Oversimplification: Critics argue that the theory oversimplifies complex market dynamics and does not account for all factors that influence innovation.
External factors: The theory may not fully address the role of external factors, such as government regulations, social trends, and technological advancements, which can significantly impact innovation.


THE ROLE OF AI, BLOCKCHAIN AND OTHER TECHNOLOGIES IN RESHAPING INDUSTRIES
Artificial intelligence (AI)


- a field of study that focuses on creating machines that can learn, reason, and act like humans.
- a set of technologies that enable computers to perform a variety of advanced functions, including the ability to see, understand and translate spoken and written language, analyze data, make recommendations, and more.

Types of Artificial Intelligence (AI)
- Machine learning - a type of AI that helps computers learn from experience. It uses algorithms to study data and make better decisions over time.
- Deep learning - type of machine learning that uses neural networks to help computers learn and process information like the human brain. These models can find patterns in data to make predictions and provide useful insights.
- Generative AI - type of artificial intelligence that can create new content, such as images or text, based on user input. It's used in tools like ChatGPT, Google Gemini, and Microsoft Copilot.

Examples of AI
- Chatbots - use generative AI to respond to user input
- Virtual assistants - Use generative AI to respond to user input
- Recommendation systems - Use generative AI to respond to user input


Roles in reshaping industry
 Automation - AI-powered robots and systems can handle routine tasks, allowing humans to focus on more strategic and creative work, which boosts efficiency and reduces costs.
- Quality Control - AI can detect product defects accurately using vision systems, improving quality control in manufacturing.
- Innovation and design - AI can help in product design by generating new ideas and optimizing designs for better performance.
- Personalized Customer Experience - AI can analyze customer data to deliver tailored recommendations, marketing campaigns, and customer support, enhancing customer satisfaction.

Applications
- Manufacturing
- Healthcare
- Retail
- Finance
- Transportation
Blockchain


- a system in which a record of transactions, especially those made in a cryptocurrency, is maintained across computers that are linked in a peer-to-peer network.
- Blockchain is a decentralized digital ledger that securely records transactions across a network of computers. Each "block" contains a list of transactions, and these blocks are linked together in a "chain" through cryptographic hashes, ensuring the integrity and immutability of the data. This structure allows for transparent and tamper-proof record-keeping

4 Main Types of Blockchain
- Public Blockchain- These are open to anyone who wants to participate. They are decentralized and transparent, meaning any person can join the network, validate transactions and create new blocks.
- Private Blockchain- These are restricted to specific members by the network administrators.
- Consortium Blockchain- Consortium blockchains, also known as federated blockchains. These are controlled by a group of organizations rather than a single one.
- Hybrid Blockchain- These combine elements of public and private blockchains.


What is the main purpose of a blockchain?
 The main purpose of a blockchain is to enable secure, transparent and tamper proof transactions in a decentralized manner.

How blockchain reshape the industries?
- Supply Chain Management- Enhancing transparency and traceability of products from origin to consumer, reducing fraud, and improving inventory management.
- Finance- Facilitating faster and more secure transactions, reducing the need for intermediaries, and enabling decentralized finance (DeFi) applications.
- Healthcare- Securing patient records, ensuring data privacy, and streamlining the sharing of medical information among authorized providers.
- Real Estate- Simplifying property transactions through smart contracts, reducing the reliance on intermediaries, and increasing transaction speed

Role of blockchain in industry innovation
- Smart Contracts- Self-executing contracts with terms directly written into code, enabling automatic execution of agreements when predefined conditions are met.
- Tokenization- Digital representation of assets (e.g., real estate, art) on the blockchain, allowing for fractional ownership and increased liquidity.
 Decentralized Applications (DApps)- Applications that run on blockchain networks, offering services without centralized control, enhancing security, and reducing censorship.
How does blockchain enhance efficiency, transparency, and
 business opportunities?
Blockchain provides a secure, transparent, and decentralized way to record and verify information, which can streamline processes, build trust, and unlock new business possibilities.


Applications and Impact of blockchain across various sector
 Supply Chain Management- Companies are using blockchain to track the provenance of goods, ensuring authenticity and reducing counterfeit products. This leads to increased consumer trust and streamlined logistics.
 Finance- Blockchain enables peer-to-peer transactions, reducing the need for
traditional banking intermediaries, lowering fees, and providing financial services to unbanked populations.
 Healthcare- Securely storing patient data on the blockchain ensures data integrity and privacy, while facilitating seamless sharing of information among authorized healthcare providers, leading to better patient outcomes.
 Real Estate- Blockchain simplifies property transactions by enabling tokenization of assets, allowing for fractional ownership, and reducing the need for intermediaries, thereby lowering transaction costs.
 Voting Systems- Implementing blockchain in voting can enhance transparency and security, ensuring that votes are tamper-proof and verifiable, thereby increasing trust in electoral processes.


Other Technologies

Cloud Computing
- Cloud computing refers to the provision of computing services, including servers, storage, databases, networking, software, analytics, and intelligence, through the internet, commonly known as "the cloud."
- This technology enables faster innovation, flexible resource management, and cost efficiencies. Businesses typically pay only for the cloud services they utilize, allowing them to reduce operational expenses, optimize infrastructure efficiency, and scale according to evolving business requirements.
 Internet of Things (IoT)
 The Internet of Things (IoT) is a network of devices that connect and exchange data over the internet. IoT devices are equipped with sensors, software, and other technologies.

 Examples: Smart sensors, RFID tags, connected devices
Use Cases: Supply chain tracking, predictive maintenance, smart retail, fleet management

Big Data & Analytics
- It refers to the process of collecting, organizing, and analyzing large and complex datasets (known as "big data") to extract valuable insights, patterns, and trends that can inform better decision-making across various industries, utilizing specialized tools and techniques to handle the high volume, velocity, and variety of data involved; essentially, it's about using powerful data analysis methods to uncover meaningful information from massive data sets.
Examples: Google Analytics, Tableau, Apache Hadoop Use Cases: Customer behavior analysis, market trends prediction, business intelligence reporting

5G Technology
- 5G is the fifth generation of wireless cellular technology, which offers faster speeds, more reliable connections, and lower latency than previous generations. Examples: High-speed wireless networks for mobile and IoT Use Cases: Faster data transfer, remote work enhancements, real-time communication

Augmented Reality (AR) & Virtual Reality (VR)
- AR uses a real-world setting while VR is completely virtual. AR users can control their presence in the real world; VR users are controlled by the system. VR requires a headset device, but AR can be accessed with a smartphone. AR enhances both the virtual and real world while VR only enhances a fictional reality. Examples: Meta Quest, Microsoft HoloLens, AR Filters Use Cases: Virtual showrooms, training simulations, interactive marketing campaigns

Robotic Process Automation (RPA)
- Robotic process automation (RPA) is a software technology that uses virtual bots to perform repetitive tasks. RPA helps businesses streamline processes by automating tasks that humans would otherwise do. Examples: UiPath, Blue Prism, Automation Anywhere Use Cases: Automating repetitive tasks, customer support chatbots, invoice processing

Cybersecurity Technologies
- Cyber security technology is a combination of processes, technologies, and controls that protect systems, data, and networks from cyber attacks. The goal of cyber security technology is to reduce the risk of cyber attacks and prevent unauthorized access to systems. Examples: Firewalls, encryption, biometric authentication Use Cases: Data protection, fraud prevention, secure transactions


Quantum Computing
 Quantum computing is a multidisciplinary field comprising aspects of computer science, physics, and mathematics that utilizes quantum mechanics to solve complex problems faster than on classical computers. The field of quantum computing includes hardware research and application development. Examples: IBM Quantum, Google Sycamore Use Cases: Complex problem-solving, encryption, financial modeling

Edge Computing
- Edge computing is a technology that processes and stores data near the user, instead of in a remote data center. It's a distributed computing model that uses edge servers to process data in real time.
Examples: Cisco Edge Computing, AWS Greengrass Use Cases: Reducing cloud dependency, real-time data processing, IoT applications

3D Printing
- 3D printing, also known as additive manufacturing, is a process that creates physical objects from digital models. It involves layering materials like plastic, metal, or powder to create a 3D object.
Examples: Stratasys, Ultimaker, Formlabs Use Cases: Rapid prototyping, custom manufacturing, healthcare implants
 REFERENCES:
Luther, D. (2024, May 30). What Is Trend Analysis? Types & Best Practices. Netsuite. https://www.netsuite.com/portal/resource/articles/business-strategy/trend-analysis.shtml
Planium Pro. (2020b, February 16). PESTEL Analysis - Planium Pro. https://www.planiumpro.com/pestel/Pla
SHU, (2019, January) What is Pestel Analysis? http://blog.shu.ac.uk/shupdreviewtoolkit/files/2019/01/PESTEL-ANALYSIS.pdf Fabyio, V. (2022). PESTEL Analysis: Definition, Factors, Steps & Examples. http://www.questionpro.com/blog/pestel-ana;ysis/
Dube, L., & Lantos, G. P. (2017). Consumer behavior: A practitioner's guide. Routledge.
Fitzpatrick, P., & Stoller, E. (2020). Big data analytics for business decisions: Trends and applications. Springer.
Gartner, Inc. (2021). Market guide for social media analytics. Gartner. https://www.gartner.com/doc/3996194/market-guide-social-media-analytics
Jenkins, A. (2018). Social media analytics: Effective tools for measuring success. Business Expert Press.
Keller, K. L., & Kotler, P. (2020). Marketing management (15th ed.). Pearson.
Liu, Y., & Li, H. (2022). AI in marketing: Real-time data monitoring and insights. Springer.
Manning, P. (2019). The impact of AI in market research. Marketing Intelligence & Planning, 37(5), 621-633.
https://doi.org/10.1108/MIP-02-2019-0144
Sweeney, P. J., & Williams, S. (2019). The power of big data in market research: Best practices and innovations. McGraw-Hill Education.
Harvard Business School Online. (n.d.). 6 data collection methods: From surveys to analytics.
Retrieved from
https://online.hbs.edu/blog/post/data-collection-methods
Disruptive Technology in Ph. (n.d.). Disruptive Technology. https://mms142disruptivetechnology.weebly.com/disruptive-technology-in-ph.html
What is Disruptive Innovation Theory? 4 key concepts. (2016, November 15). Business Insights What Is Disruptive Innovation Theory? 4 Key Concepts - HBS Online
Christensen Institute. (2024, September 4). Disruptive Innovation Theory - Christensen Institute. https://www.christenseninstitute.org/theory/disruptive-innovation/
 What is disruptive innovation? (2024, December 5). Harvard Business Review. https://hbr.org/2015/12/what-is-disruptive-innovation
Investopedia. "Blockchain Facts: What Is It, How It Works, and How It Can Be Used." https://www.investopedia.com/terms/b/blockchain.asp
 Deloitte. "Using blockchain to drive supply chain transparency." https://www2.deloitte.com/us/en/pages/operations/articles/blockchain-supply-chain-innovation.ht ml
IBM. "What Is Blockchain?" https://www.ibm.com/think/topics/blockchain
101 Blockchains. "The Impact of Blockchain Technology on Various Industries." https://101blockchains.com/blockchain-in-various-industries/
PwC. "Making sense of bitcoin, cryptocurrency and blockchain." https://www.pwc.com/us/en/industries/financial-services/fintech/bitcoin-blockchain-cryptocurrenc y.html
IBM. "What are the Benefits of Blockchain?" https://www.ibm.com/think/topics/benefits-of-blockchain
Microsoft Azure. (n.d.). What is cloud computing? Microsoft Azure. Retrieved January 29, 2025, from
https://azure.microsoft.com/en-us/resources/cloud-computing-dictionary/what-is-cloud-computin g
AI vs. Machine Learning: How Do They Differ? | Google Cloud. (n.d.). Google Cloud. https://cloud.google.com/learn/artificial-intelligence-vs-machine-learning
Craig, L., Laskowski, N., & Tucci, L. (2024, October 1). What is AI? Artificial Intelligence explained. Search Enterprise AI.
https://www.techtarget.com/searchenterpriseai/definition/AI-Artificial-Intelligence#:~:text=Machin e%20learning%20is%20the%20science,receiving%20feedback%20on%20their%20actions.
Staff, C. (2024, December 19). What is artificial intelligence? Definition, uses, and types. Coursera. https://www.coursera.org/articles/what-is-artificial-intelligence