Economic objectives and the role of the government
Economic Growth
Economic growth refers to the increase in the production of goods and services in an economy over a period of time.
It is usually measured as the percentage increase in real gross domestic product (GDP) or real GDP per capita.
Economic growth indicates the health of an economy and its ability to improve the standard of living for its population.
Gross Domestic Product (GDP) and GDP per capita
Gross Domestic Product (GDP): This is the total monetary value of all goods and services produced within a country in a specific time period.
It can be measured in three ways: production, income, and expenditure approaches.
GDP per Capita: This is GDP divided by the total population, providing an average economic output per person.
It is a more accurate reflection of an individual's standard of living than GDP alone.
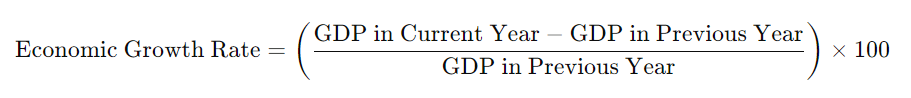
Calculating Economic Growth: The formula to calculate economic growth is:
Analyze Recent and Historical GDP Data
Recent GDP Data: This involves examining the most current GDP statistics to understand the current state of the economy.
Historical GDP Data: This involves looking at GDP data over a longer period to identify trends, patterns, and cycles in economic growth.
Analysis can include looking at periods of recession, economic booms, and long-term growth trends.
Analyze the Determinants of Economic Growth
Investment: Increased investment in physical capital (e.g., machinery, infrastructure) can boost productivity and economic growth.
Technology: Technological advancements can lead to more efficient production processes and the creation of new products and services.
Size of Workforce: An increase in the working-age population or higher labor force participation rates can contribute to economic growth.
Education and Training: A more educated and skilled workforce can increase productivity and innovation.
Availability of Natural Resources: Access to natural resources can support industries such as mining, agriculture, and energy.
Government Policies: Fiscal policies (taxation and government spending), monetary policies (interest rates), and regulations can influence economic growth.
Evaluate the Costs and Benefits of Economic Growth
Economic Impact: Higher GDP can lead to increased income, employment opportunities, and improved living standards.
Social Impact: Economic growth can lead to better access to healthcare, education, and social services, but can also result in income inequality and social unrest if the benefits are not evenly distributed.
Environmental Sustainability: While economic growth can provide resources for environmental protection, it can also lead to environmental degradation, depletion of natural resources, and pollution if not managed sustainably.
Low Unemployment
Employment: This refers to the state in which individuals who are capable and willing to work are engaged in a job, either part-time or full-time, that provides them with an income.
Unemployment: This refers to the situation where individuals who are capable and willing to work are actively seeking employment but are unable to find a job.
Claimant Count
This method measures unemployment based on the number of people who are claiming unemployment benefits, such as Jobseeker's Allowance. It is a straightforward measure but may not include all unemployed individuals, such as those not eligible for benefits or those who do not claim them.
Calculate the Unemployment Rate
Unemployment Rate Formula:
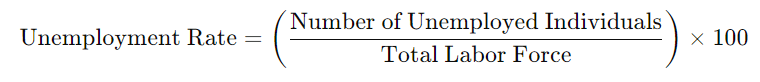
Total Labor Force: This includes all individuals who are either employed or actively seeking employment.
Analyze Recent and Historical Unemployment Figures
Recent Unemployment Figures: Examining the latest unemployment data helps understand the current employment situation in the economy.
Historical Unemployment Figures: Analyzing past data can help identify trends, cycles, and changes in unemployment rates over time, including periods of economic recession or growth.
Types of Unemployment
Cyclical Unemployment: This type of unemployment is related to the economic cycle. It increases during recessions and decreases during periods of economic expansion.
Frictional Unemployment: This occurs when individuals are temporarily unemployed while transitioning from one job to another. It includes new entrants into the labor force and people who have voluntarily left their jobs.
Seasonal Unemployment: This type of unemployment happens when individuals are out of work during off-peak seasons, typically seen in industries like agriculture, tourism, and retail.
Structural Unemployment: This occurs when there is a mismatch between the skills of the workforce and the skills needed for available jobs, often due to technological changes or shifts in the economy.
Causes and Consequences of Unemployment for Individuals, Regions, and the Government
Causes of Unemployment:
Economic Downturns: Reduced demand for goods and services leading to job cuts.
Technological Changes: Automation and new technologies replacing certain jobs.
Globalization: Shifts in production to countries with cheaper labor.
Labor Market Policies: Minimum wage laws, unemployment benefits, and other regulations can impact employment levels.
Consequences of Unemployment:
For Individuals: Loss of income, reduced standard of living, psychological effects like stress and depression, and loss of skills over time.
For Regions: Increased poverty levels, reduced economic activity, and potential for increased crime rates.
For the Government: Higher expenditure on unemployment benefits, reduced tax revenues, and potential for increased social unrest.
Fair Distribution of Income
Distribution of Income:
This refers to how a nation’s total earnings are divided among its population. It includes how fairly or unevenly income is distributed across different individuals or groups in an economy.
Types of Income:
Wages and Salaries: Earnings from employment.
Rent: Income from property or land ownership.
Interest: Earnings from investments and savings.
Dividends: Share of profits received by shareholders of a company.
Transfer Payments: Government payments such as pensions, unemployment benefits, and welfare.
Income vs. Wealth:
Income: Flow of money received over a period of time, typically as payment for work, investments, or benefits.
Wealth: Stock of assets owned at a particular point in time, including property, stocks, bonds, and other forms of investments.
Calculate Income and Wealth
Calculating Income:
Total income is calculated by summing all sources of income received by an individual or household over a specific period, usually a year.
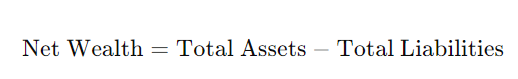
Calculating Wealth:
Wealth is calculated by summing the value of all owned assets and subtracting any liabilities (debts).
Formula:
Causes of Differences in the Distribution of Income and Wealth and the Consequences for an Economy
Causes of Differences in Distribution:
Education and Skills: Higher levels of education and skills typically lead to higher-paying jobs.
Experience and Age: Older individuals tend to have more experience and may earn higher incomes.
Inheritance: Wealth can be passed down through generations, contributing to inequality.
Employment Opportunities: Availability and quality of jobs can vary by region, impacting income distribution.
Discrimination: Gender, racial, and other forms of discrimination can lead to unequal income distribution.
Government Policies: Taxation, welfare, and minimum wage laws can influence the distribution of income.
Consequences for an Economy:
Economic Growth: Inequality can both hinder and stimulate economic growth. High inequality might lead to underinvestment in education and health, reducing growth. Conversely, it can incentivize productivity and innovation.
Social Stability: High levels of income inequality can lead to social unrest, crime, and reduced social cohesion.
Health and Education: Inequality can result in disparities in access to healthcare and education, impacting overall human capital development.
Consumption Patterns: Differences in income affect consumption patterns and demand for goods and services, influencing economic activity.
Price Stability
Price stability refers to the condition in which prices in the economy do not change much over time.
This means low and stable inflation, which is important for economic stability. It allows consumers and businesses to make long-term plans without worrying about significant changes in the purchasing power of money.
Inflation is the rate at which the general level of prices for goods and services rises, eroding purchasing power.
It is measured as an annual percentage increase. Central banks attempt to limit inflation—and avoid deflation—in order to keep the economy running smoothly.
Real vs. Nominal Values
Nominal Values: These are measured in current money terms, without adjusting for inflation. For example, if you earn $50,000 a year, this is your nominal income.
Real Values: These are adjusted for inflation, reflecting the true purchasing power. For example, if the inflation rate is 2% and your nominal income is $50,000, the real income is calculated by considering the inflation rate to understand the actual value in constant dollars.
Measuring Inflation: Consumer Price Index (CPI)
The Consumer Price Index (CPI) is a key indicator used to measure inflation. It represents the average change over time in the prices paid by urban consumers for a market basket of consumer goods and services. The steps involved include:
Selecting the Basket: Determining the goods and services that represent the typical consumption habits of households.
Collecting Price Data: Gathering data on the prices of these items over time.
Calculating the Index: Using a formula to compute the index number, which reflects the change in prices compared to a base year.
Calculating the Effect of Inflation on Prices
To calculate the effect of inflation on prices, you can use the formula:

where n is the number of years.
For example, if the current price of an item is $100 and the annual inflation rate is 3%, the price in 5 years would be:
Analyzing Recent and Historical Inflation Figures
Inflation figures can be analyzed by:
Looking at historical data to identify trends and patterns.
Comparing inflation rates across different periods to understand economic conditions.
Considering external factors such as oil prices, exchange rates, and economic policies that influence inflation.
Evaluating Causes and Consequences of Inflation
Causes of Inflation:
Demand-Pull Inflation: Occurs when demand for goods and services exceeds supply, leading to higher prices.
Cost-Push Inflation: Results from an increase in the cost of production, such as wages and raw materials, which producers pass on to consumers.
Built-In Inflation: Happens when workers demand higher wages to keep up with the cost of living, leading to increased production costs and higher prices.
Consequences of Inflation:
For Consumers: Reduced purchasing power, leading to a decrease in the standard of living if wages do not keep up with inflation.
For Producers: Increased production costs can reduce profit margins unless prices are increased. Uncertainty about future costs can lead to less investment.
For Savers: The value of savings decreases over time if the interest rate is lower than the inflation rate.
For the Government: Inflation can lead to higher tax revenues if incomes and prices increase, but it can also increase the cost of government borrowing and servicing debt.
Fiscal Policy
Government Spending and Revenue
Purposes of Government Spending:
Public Goods and Services: Funding for essential services such as education, healthcare, defense, and infrastructure.
Welfare and Social Security: Providing support for the unemployed, elderly, and other vulnerable groups.
Economic Stability and Growth: Stimulating economic activity during downturns and investing in long-term growth projects.
Redistribution of Income: Reducing inequality through social programs and benefits.
Sources of Government Revenue:
Direct Taxes: Taxes directly levied on individuals and businesses, including:
Income Tax: Tax on personal and corporate income.
Property Tax: Tax on property ownership.
Indirect Taxes: Taxes on goods and services, including:
Value-Added Tax (VAT): Tax on the value added at each stage of production.
Sales Tax: Tax on the sale of goods and services.
Excise Duties: Taxes on specific goods like alcohol, tobacco, and fuel.
Balanced Government Budget, Budget Surplus, and Budget Deficit
Balanced Government Budget: Occurs when government revenue equals government spending in a fiscal year. It indicates fiscal discipline and economic stability.
Budget Surplus: When government revenue exceeds spending. This can be used to pay off debt or saved for future expenses.
Budget Deficit: When government spending exceeds revenue. This is often financed through borrowing, leading to an increase in public debt.
Fiscal Policy and Economic Objectives
Fiscal Policy: The use of government spending and taxation to influence the economy. It aims to achieve various economic objectives, including:
Economic Growth: Stimulating growth through increased government spending and tax cuts.
Employment: Reducing unemployment by creating jobs through public projects and incentivizing businesses.
Price Stability: Controlling inflation by adjusting tax rates and public spending.
Equitable Distribution of Income: Using taxes and transfers to reduce income inequality.
Effects of Taxes and Government Spending
Taxes and Market Effects:
Consumer Behavior: Higher taxes can reduce disposable income, decreasing consumer spending.
Business Investment: Corporate taxes can impact business profits and investment decisions.
Resource Allocation: Taxes on specific goods can alter consumption patterns, affecting market supply and demand.
Government Spending and Market Effects:
Aggregate Demand: Government spending increases aggregate demand, boosting economic activity.
Infrastructure Development: Public investment in infrastructure can enhance productivity and long-term economic growth.
Public Services: Spending on education, healthcare, and social services improves human capital and social welfare.
Costs and Benefits of Fiscal Policy
Costs:
Opportunity Cost: Resources allocated to government projects could be used elsewhere in the economy.
Budget Deficits: High levels of government spending can lead to budget deficits and increased public debt.
Crowding Out: Increased government borrowing can lead to higher interest rates, reducing private sector investment.
Benefits:
Economic Stability: Counter-cyclical fiscal policies can stabilize the economy during recessions.
Social Welfare: Government programs can improve the quality of life and reduce poverty.
Long-Term Growth: Strategic investments in infrastructure and education can drive sustainable growth.
Redistribution of Income and Wealth
Progressive Taxes: A tax system where the tax rate increases as income increases. It aims to reduce income inequality by taxing higher earners at a higher rate and using the revenue to fund social programs.
Economic Consequences:
Equity: Progressive taxes can lead to a more equitable distribution of income and wealth.
Incentives: High tax rates on the wealthy may discourage investment and work effort.
Government Revenue: Provides a significant source of revenue for funding public goods and services.
Monetary Policy
Definition and Objectives: Monetary policy refers to the actions taken by a country's central bank to manage the money supply and interest rates to achieve specific economic objectives. These objectives typically include:
Price Stability: Controlling inflation to ensure stable prices.
Full Employment: Promoting maximum employment levels.
Economic Growth: Encouraging sustainable economic growth.
Financial Stability: Ensuring the stability of the financial system.
Tools of Monetary Policy:
Interest Rates: Central banks adjust the benchmark interest rate to influence borrowing and lending in the economy.
Open Market Operations (OMOs): Buying or selling government securities to influence the money supply.
Reserve Requirements: Changing the amount of funds banks must hold in reserve.
Quantitative Easing (QE): Large-scale purchase of financial assets to increase the money supply and lower interest rates.
Forward Guidance: Communicating future policy intentions to influence expectations and economic behavior.
Impact on Growth, Employment, and Price Stability
Economic Growth:
Expansionary Policy: Lowering interest rates and increasing the money supply can stimulate economic activity by making borrowing cheaper and encouraging investment and consumption.
Contractionary Policy: Raising interest rates and reducing the money supply can slow down economic activity to prevent overheating and control inflation.
Employment:
Expansionary Policy: Lower interest rates reduce borrowing costs for businesses, leading to increased investment and hiring, thereby reducing unemployment.
Contractionary Policy: Higher interest rates can lead to reduced business investment and hiring, potentially increasing unemployment but preventing wage inflation and overheating.
Price Stability:
Inflation Control: Central banks raise interest rates to reduce borrowing and spending, which can help lower inflation.
Deflation Control: Lowering interest rates can increase borrowing and spending, helping to prevent deflation and promote stable price levels.
Effects on Consumer Spending, Borrowing, Saving, and Investment
Consumer Spending:
Lower Interest Rates: Reduce the cost of borrowing, encouraging consumers to take loans for big-ticket items (houses, cars) and increase overall spending.
Higher Interest Rates: Increase the cost of borrowing, leading to reduced consumer spending as loans become more expensive.
Borrowing:
Lower Interest Rates: Make borrowing cheaper, encouraging both consumers and businesses to take out loans for consumption and investment.
Higher Interest Rates: Make borrowing more expensive, discouraging loans and reducing spending and investment.
Saving:
Lower Interest Rates: Provide lower returns on savings, potentially reducing the incentive to save and increasing consumption.
Higher Interest Rates: Offer higher returns on savings, encouraging people to save more and spend less.
Investment:
Lower Interest Rates: Reduce the cost of financing for businesses, encouraging investment in capital projects, which can drive economic growth.
Higher Interest Rates: Increase the cost of financing, reducing business investment as borrowing becomes more expensive.
Evaluation of Monetary Policy
Benefits:
Flexible and Timely: Central banks can quickly implement policy changes to respond to economic conditions.
Effective for Inflation Control: Interest rate adjustments can effectively manage inflation and stabilize prices.
Support for Economic Growth: Expansionary monetary policy can provide the necessary stimulus during economic downturns.
Costs and Limitations:
Time Lags: There is often a delay between policy implementation and its effects on the economy.
Liquidity Traps: When interest rates are near zero, further cuts may not stimulate borrowing and spending (as seen in the 2008 financial crisis).
Potential for Overheating: Excessive monetary stimulus can lead to high inflation and asset bubbles.
Dependency on Other Policies: Monetary policy alone may not be sufficient to address all economic issues, requiring coordination with fiscal policy.
Supply side policies
Supply side policies are measures undertaken by the government intended to increase the productivity and efficiency of the economy. These policies aim to improve the long-term productive potential of the economy by enhancing the supply side of the economy. Supply side policies can be divided into two main categories: market-based policies and interventionist policies.
Market-Based Policies
These policies aim to reduce government intervention in markets, thereby promoting free market operations and improving economic efficiency. Key market-based supply side policies include:
Tax Reforms: Reducing income tax and corporation tax to provide incentives for individuals to work harder and for firms to invest and expand.
Deregulation: Removing excessive regulations and red tape to encourage competition and innovation.
Labor Market Reforms: Reducing trade union power, implementing flexible labor laws, and promoting policies that make it easier to hire and fire workers.
Privatization: Selling state-owned enterprises to the private sector to increase efficiency and competitiveness.
Free Trade Agreements: Reducing tariffs and trade barriers to promote international trade and competition.
Interventionist Policies
These policies involve government intervention to correct market failures and improve the productive capacity of the economy. Key interventionist supply side policies include:
Education and Training: Investing in education and vocational training to improve the skill level of the workforce.
Infrastructure Investment: Spending on transport, communication, and energy infrastructure to reduce costs and improve productivity.
Research and Development (R&D): Providing grants and subsidies for R&D to foster innovation and technological advancement.
Industrial Policy: Supporting key industries through subsidies, tax incentives, and other forms of assistance to promote growth and competitiveness.
Healthcare Investment: Improving healthcare services to ensure a healthy workforce, reducing absenteeism, and increasing productivity.
Achieving Economic Objectives
Supply side policies aim to achieve several economic objectives:
Economic Growth: By increasing the productive capacity of the economy, supply side policies help achieve sustainable long-term economic growth.
Low Inflation: By improving efficiency and productivity, supply side policies can reduce cost-push inflation.
Low Unemployment: By making labor markets more flexible and investing in skills and education, supply side policies can reduce structural and frictional unemployment.
Improved Trade Balance: By enhancing competitiveness and productivity, supply side policies can improve the trade balance by increasing exports.
Economic Stability: By fostering a more dynamic and competitive economy, supply side policies can contribute to economic stability and resilience against shocks.
Costs and Benefits of Supply Side Policies
Benefits
Increased Efficiency: Supply side policies can lead to more efficient allocation of resources and higher productivity.
Sustainable Growth: By improving the productive capacity, supply side policies can lead to sustainable long-term economic growth.
Reduced Inflation: Enhanced productivity and efficiency can help control inflation by reducing production costs.
Lower Unemployment: Flexible labor markets and investment in education can reduce unemployment rates.
Higher Living Standards: Improved productivity and economic growth can lead to higher incomes and improved living standards.
Costs
Time Lag: The benefits of supply side policies may take time to materialize, leading to short-term economic challenges.
Opportunity Cost: Resources allocated to supply side policies could have been used elsewhere, potentially leading to missed opportunities.
Income Inequality: Some market-based supply side policies, such as tax cuts, can disproportionately benefit the wealthy, leading to increased income inequality.
Budget Deficits: Government spending on infrastructure, education, and other interventionist policies can lead to budget deficits and increased public debt.
Market Failures: Deregulation and privatization may lead to market failures, such as monopolies and reduced public goods provision.
Limitations of Markets
Positive and Negative Externalities
Externalities are costs or benefits incurred or received by third parties who are not involved in the economic transaction. They are a form of market failure because the true costs or benefits of goods or services are not reflected in the market prices.
Positive Externalities: Benefits received by third parties. Examples include education (which benefits society through a more informed citizenry) and vaccination (which reduces the spread of diseases).
Negative Externalities: Costs imposed on third parties. Examples include pollution (which affects health and the environment) and noise from factories (which disturbs nearby residents).
Government Policies to Correct Externalities
Governments can use various policies to correct positive and negative externalities and ensure that the market operates more efficiently.
Taxation and Subsidies
Taxation: Governments can impose taxes on goods or services that generate negative externalities. For example, carbon taxes on emissions aim to reduce pollution by making it more expensive to pollute.
Subsidies: Governments can provide subsidies for goods or services that generate positive externalities. For example, subsidies for renewable energy projects encourage the use of cleaner energy sources.
State Provision
The government can directly provide goods and services that generate positive externalities. Examples include public education and healthcare services, where the government ensures availability to all citizens.
Legislation and Regulation
Legislation: Governments can pass laws to limit or ban activities that produce negative externalities. For instance, laws that limit emissions from factories help reduce pollution.
Regulation: Governments can set standards and regulations that limit the level of externalities. For example, vehicle emission standards can reduce air pollution.
Information Provision
Governments can provide information to the public about the benefits and costs of certain activities. For instance, public health campaigns on the dangers of smoking can reduce the negative externalities associated with smoking.
Evaluation of Government Policies
Use and Impact of Policies
Taxation and Subsidies
Advantages: Taxation can effectively reduce negative externalities by making harmful activities more expensive. Subsidies can encourage beneficial activities.
Disadvantages: Determining the optimal level of taxes and subsidies can be challenging. Taxes might be passed on to consumers, leading to higher prices.
State Provision
Advantages: Ensures that essential services with positive externalities are available to all, regardless of income.
Disadvantages: Can be costly for the government and may lead to inefficiencies if not managed properly.
Legislation and Regulation
Advantages: Directly limits harmful activities and ensures compliance with standards.
Disadvantages: Can be costly to enforce and may stifle innovation or economic activity if too stringent.
Information Provision
Advantages: Educates the public, leading to informed decisions and voluntary reduction of negative externalities.
Disadvantages: Relies on public response and may not be effective if people ignore the information.
Costs and Benefits
Opportunity Cost
The resources used to implement these policies (e.g., funds for subsidies, enforcement costs for regulations) have alternative uses. The opportunity cost is the value of the next best alternative foregone.
Benefits
Social Welfare: Correcting externalities can lead to an overall increase in social welfare by aligning private costs/benefits with social costs/benefits.
Economic Efficiency: Policies that internalize externalities can lead to more efficient market outcomes.