Week 3 Financial Statement Analysis
Fundamentals of Corporate Finance
Lecture Overview
Annual Report: Overview of key financial statements.
Ratio Analysis: Techniques for analyzing firm performance through financial ratios.
Du Pont Identity: An approach to break down Return on Equity (ROE).
Using Financial Statement Information: Strategies for analyzing financial data over time and against peers.
The Annual Report
Key Components:
Statement of Financial Position (Balance Sheet): Snapshot of financial standing at a specific time.
Assets: What the firm owns (e.g., cash, inventory).
Liabilities: What the firm owes (e.g., debts, obligations).
Equity: Difference between assets and liabilities.
Income Statement: Measures firm performance over a period.
Revenues: Income earned from business activities.
Expenses: Costs incurred in earning revenues.
Statement of Cash Flows: Shows cash inflows and outflows during a period.
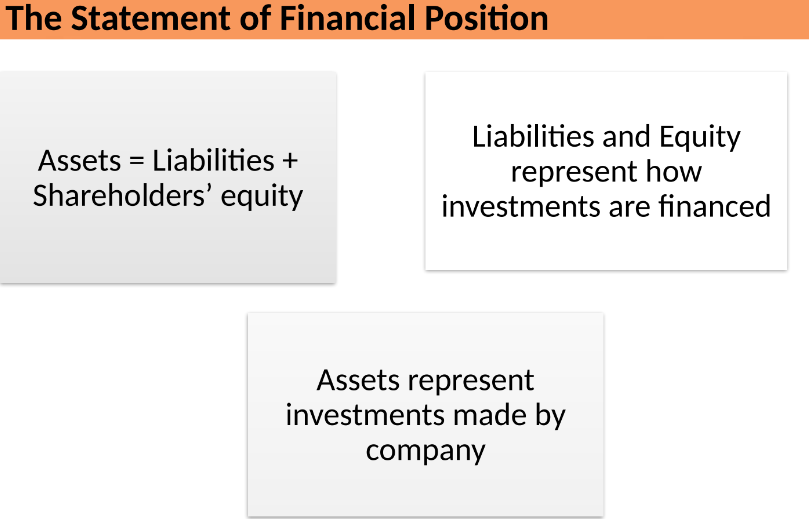
Statement of Financial Position
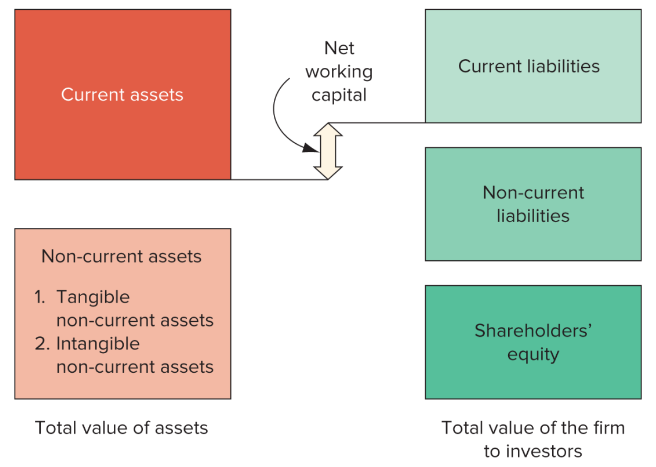
Equation: Assets = Liabilities + Shareholders' Equity
Assets: Represent investments made by the company.
Liabilities and Equity: Indicate how those investments are financed.
Components:
Current Assets: Cash, accounts receivable, inventory (used within a year).
Non-Current Assets: Property, plant, equipment, intangible assets.
Current Liabilities: Obligations due within a year.
Non-Current Liabilities: Long-term obligations due later.
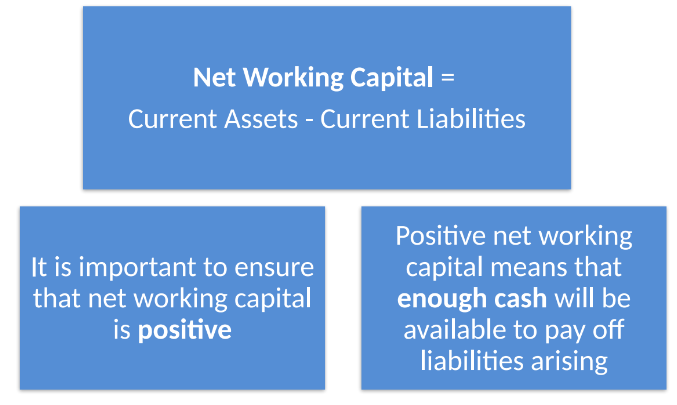
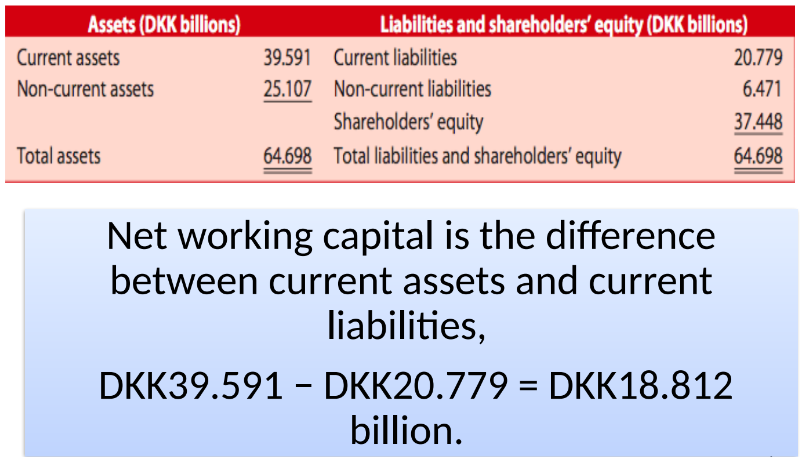
Net Working Capital: Current Assets - Current Liabilities.
Important for ensuring enough cash is available to pay off liabilities.
Book Value vs. Market Value
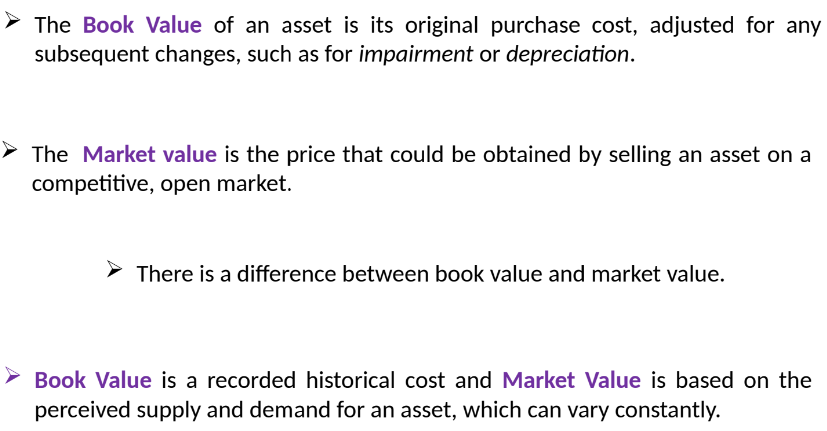
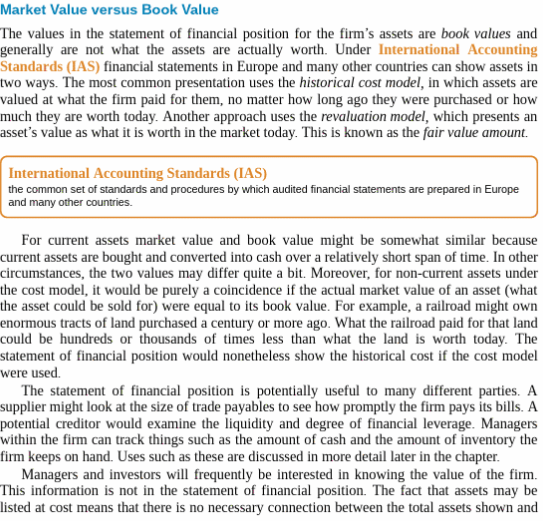
Book Value: Recorded historical cost of an asset, adjusted for impairments and depreciation.
Market Value: The price attainable by selling the asset in the market; can fluctuate based on demand.
Example:
Machine bought for £100,000 with £20,000 depreciation.
Current market price of £90,000 leads to:
Net Book Value = £100,000 - £20,000 = £80,000.
Profit = Market Value - Book Value = £90,000 - £80,000 = £10,000.
Income Statement
Purpose: Measures performance over a specific timeframe.
Components: Revenues, Expenses, and Net Income calculation.
Analysis Techniques:
Trend Analysis: Comparison of line items across multiple periods.
Ratio Analysis: In-depth evaluation through calculated ratios.
The Cash Flow Report
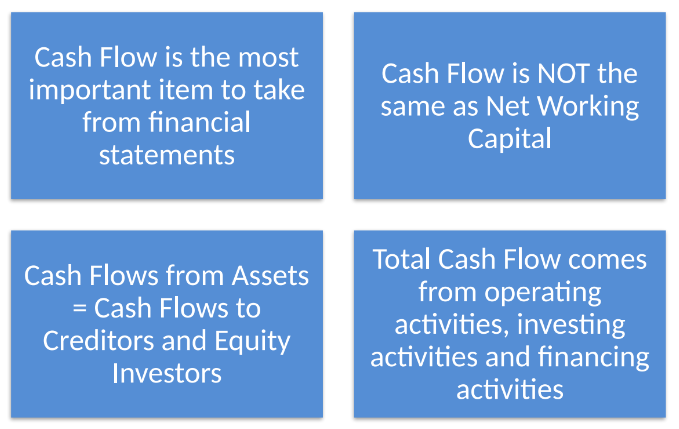
Importance: Indicates financial health through cash management.
Components:
Operating Activities: Cash flows from business operations.
Investing Activities: Cash flows relating to the acquisition or sale of assets.
Financing Activities: Cash flows relating to borrowing and repaying debt, or issuing equity.
Ratio Analysis
Purpose: Analyze and compare financial performance.
Types of Ratios:
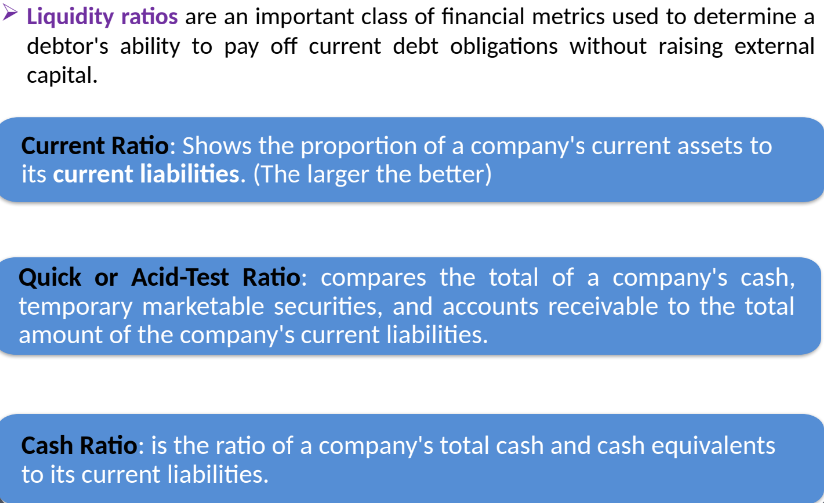
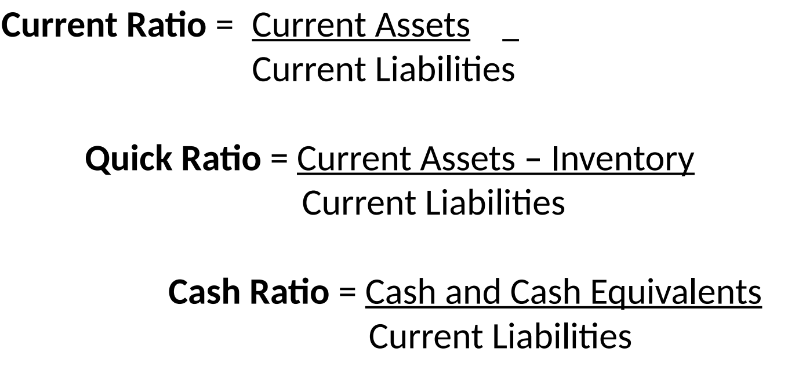
Liquidity Ratios: Assess short-term financial health.
Current Ratio, Quick Ratio, Cash Ratio.
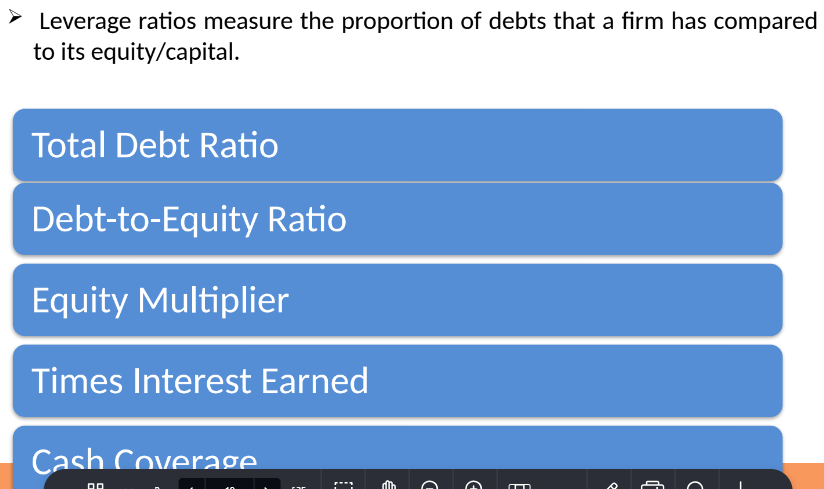
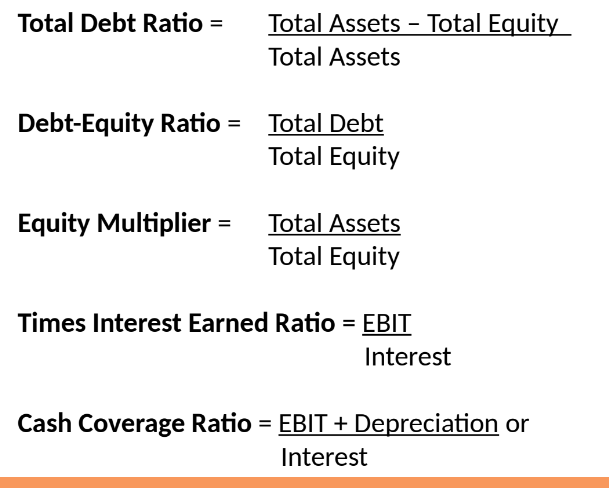
Leverage Ratios: Measure debt levels relative to equity.
Total Debt Ratio, Debt-to-Equity Ratio.
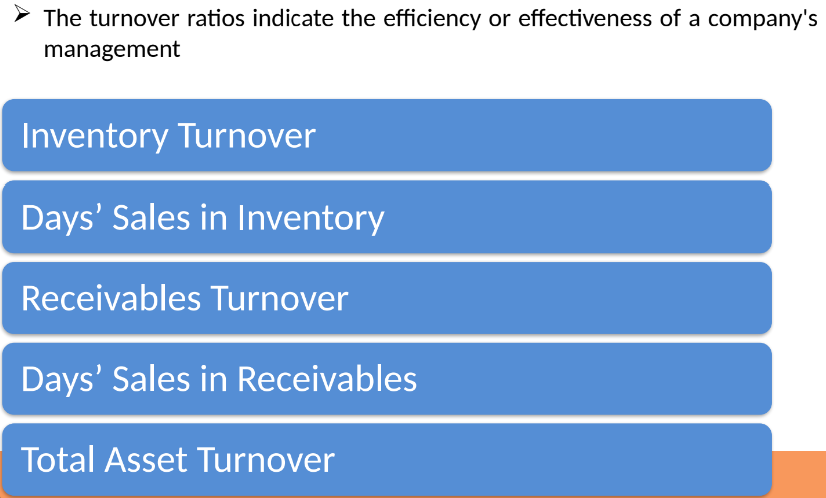
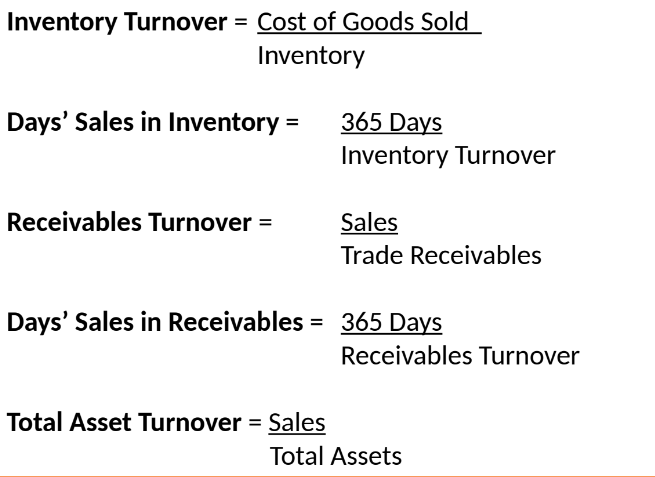
Turnover Ratios: Evaluate efficiency.
Inventory Turnover, Total Asset Turnover.
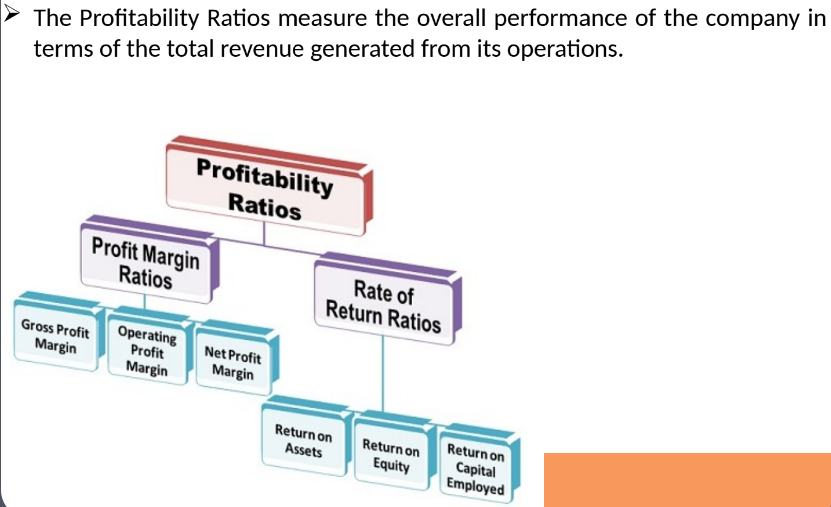
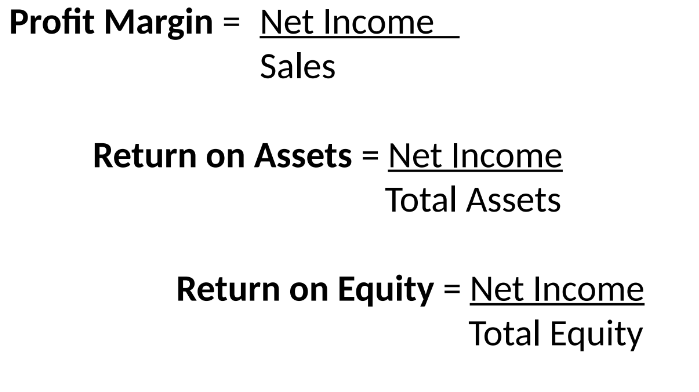
Profitability Ratios: Assess company efficiency in generating profits.
Profit Margin, Return on Assets, Return on Equity.
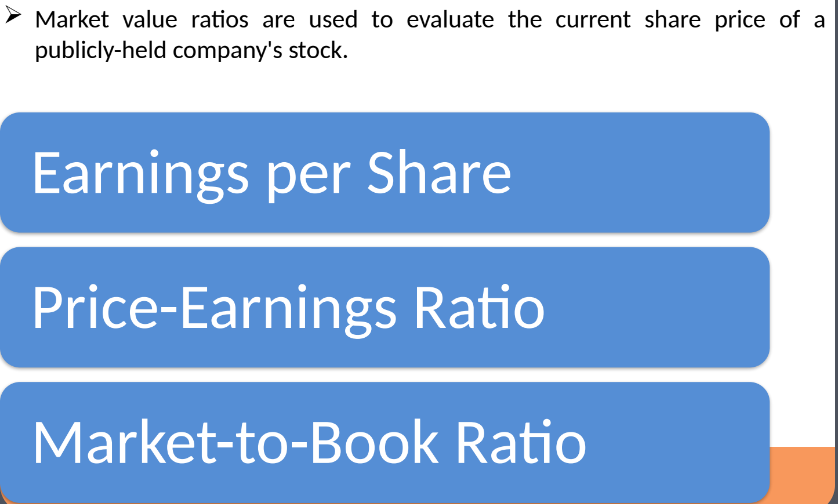
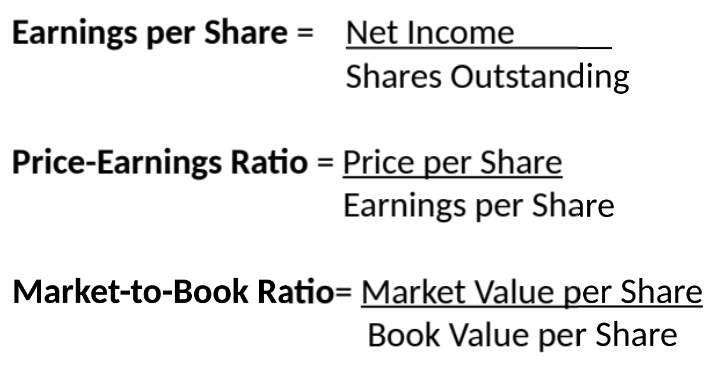
Market Value Ratios: Evaluate stock performance.
Earnings per Share, Price-Earnings Ratio.
The Du Pont Identity
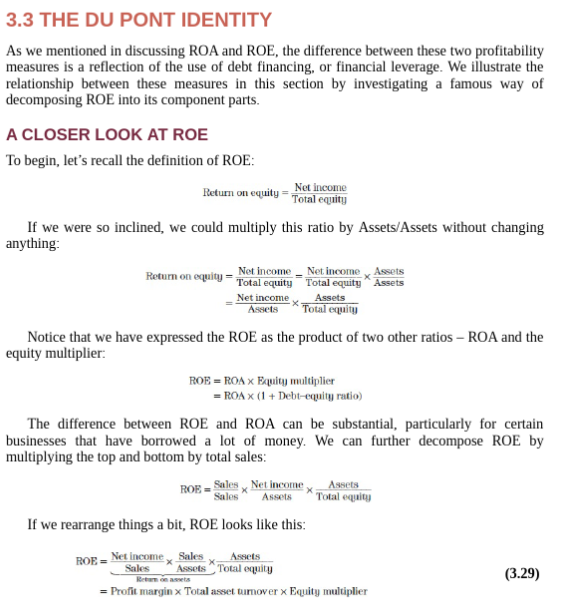
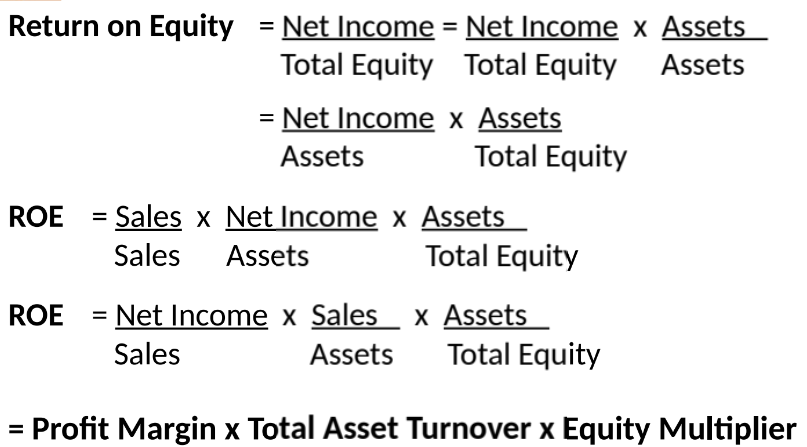
Overview: A tool to analyze and improve Return on Equity (ROE).
Components:
Profit Margin: Net Income/Sales.
Total Asset Turnover: Sales/Total Assets.
Financial Leverage: Total Assets/Total Equity.
Formula: ROE = Profit Margin x Total Asset Turnover x Equity Multiplier.
Using Financial Statement Information
Trend Analysis: Evaluates the same ratio over multiple years.
Peer Group Analysis: Compares a firm’s ratios with those in similar industries.
Aspirant Analysis: Compares with top-performing firms in the sector.
Financial Planning: Long-term planning through financial statements and sale percentages.
