
Complete logbooks #2 .docx
Haidar Alnasser – 620690
CHP207 – Week 2 Logbook entry
Pre-Lab Question/Task
No prelab question to complete. Review material from week 1-2 in preparation for the workshop.
Questions
Case 1: Surfactant
The alveoli are surrounded by surfactant, which helps reduce surface tension. Alveoli are surrounded by water molecules, which raise surface tension and may result in alveolar collapse. Alveolar collapse is avoided, and surface tension is reduced when surfactant molecules are involved. This is because the forces holding the water molecules together are disrupted by the surfactant molecules. In addition to promoting adequate gas exchange, this maintains the alveolar structure. Laplace's law states that the tension inside a spherical or cylindrical structure's wall is exactly proportionate to the total of the structure's internal pressure and radius. (P x r = T)
An alveoli may collapse into another alveoli with less tension if there is greater tension on one and surfactant is not helping to reduce this tension. As a result, the collapsing pressure of the lung increases, increasing collapsing forces and decreasing lung compliance.
Because the expansion of the thoracic cavity must grow to equalise the force, functional residual capacity will decrease if collapsing forces are greater.
Airway resistance increases as a result of increased friction and drag brought on by the alveolar radius and lung volume contracting owing to stress. Remaining air is transferred from collapsing alveoli to less tensioned alveoli as an alveolar collapses. As a result, air is forced into a different alveoli, which further increases airway resistance.
A decrease in volume change results in a decrease in ventilation.
If more alveoli collapse, it will have an impact on gas exchange. Thus, for gas exchange to be effective, surface area must decrease. (PCO2 rises, but PO2 falls).
O2 pressure will drop since there is less gas exchange. This indicates that there is less O2 available to support and aid in the body's O2 circulation.
Diffuse oxygen intake by red blood cells is decreased. This indicates that the body's organs and tissues aren't receiving enough oxygen through red blood cells. This consequently compromises bodily function. When this happens, haemoglobin with a high affinity for oxygen is either underutilised or inefficient.
CHP207 – Week 3 Logbook entry
Pre-Lab Question/Task
Describe how ventilation is controlled. In your answer describe the neural centres and the sensors/receptors involved and how changes in the partial pressures of oxygen and carbon dioxide affect breathing.
Ventilation is controlled by the medulla's reparatory centre. Changes in the partial pressure of carbon dioxide and oxygen are detected by the respiratory centre in the medulla, which then signals the lungs to alter breathing to restore the body's homeostatic balance. Very small changes in PCO2 are the main source of ventilation changes since they are unfavourable and are thus observed. On the other hand, PO2 might fluctuate considerably prior to inducing a need for ventilation.
Practical Data/Results
Record your results from the practical here (Baseline (1a) + Breaking point (2a, b, c)
Trial/condition | PAO2 (mmHg) | PACO2 (mmHg) | Time (sec) |
Normal/Rest (use the ‘theoretical values for alveolar PO2/PCO2 at rest) | 118 | 29.54 | N/A |
Breath-hold | 91.62 | 39.50 | 46.82 |
Hyperventilation | 126.91 | 25.95 | N/A |
Hyperventilation + Breath-hold | 90.91 | 41.07 | 37 |
Questions
The theoretical value for PAO2 is 104mmHg and 40mmHg for PACO2.
The results show an increase of PAO2 at 118mmHg and a decrease for PACO2 at 29.54mmHg.
The three factors are perfusion, diffusion, and ventilation.
Because of effective gas exchange, the partial pressures of carbon dioxide (PACO2) and oxygen (PAO2) in the alveoli closely match those in the arterial blood leaving the lungs. Elevated alveolar pH (PAO2) raises arterial blood oxygen levels, but elevated alveolar pH also raises arterial blood carbon dioxide levels. This is essential for preserving homeostasis, making sure that tissues receive enough oxygen, and eliminating carbon dioxide.
Breath-hold (2a): PAO2 = 91.62mmHg, PACO2 = 39.50mmHg
Hyperventilation (2b): PAO2 = 126.91mmHg, PACO2 = 25.95mmHg
While the tissues are not obtaining new air, they continue to produce carbon dioxide and use oxygen, which causes PAO2 to rise throughout the breath-hold (2a) relative to the baseline. For hyperventilation (2b) the opposite has occurred as an excess amount of air is breathed in at a higher rate, increasing the oxygen levels and decreasing CO2 levels.
Because of the lower starting CO2 levels, one may anticipate a longer breath-hold duration following hyperventilation, which would postpone the need to breathe. The shorter breath-hold duration in 2c may be the result of additional physiological factors influencing breath-holding ability or a higher need to breathe brought on by rapid CO2 accumulation.
The trials show that CO2 levels have a significant influence on breathing regulation. Breathing desire is substantially stimulated by increased PACO2 (hypercapnia). The urge to breathe can be temporarily delayed by hyperventilation, which decreases CO2 levels initially, but the strong respiratory drive that follows can be caused by the sudden rise in CO2 levels.
The ratio of CO2 produced to O2 consumed by the body's tissues is known as the respiratory quotient, or RQ. The diet's macronutrient composition has an impact on it. For a mixed diet consisting of proteins, lipids, and carbs, an RQ of 0.8 is usually assumed. The body metabolises a balanced combination of these macronutrients in this average metabolic state, which is represented by this value.
Alveolar gas equation: PAO2 = PIO2 – (PACO2 / RQ)
PIO2 = 0.21% x (760-47) = 149.73 mmHg
PAO2 = 149.73 – (29.54 / 0.8) = 112.805mmHg
There is a little difference between the directly measured PAO2 (118 mmHg) and the computed PAO2 (112.805 mmHg). This slight discrepancy can be the result of tiny changes in measurement accuracy or physiological parameters.
CHP207 – Week 4 Logbook entry
Pre-Lab Question/Task
Define the following terms: TLC, FRC, RV, FEV1 and FVC, and draw a diagram to show the different lung volumes and capacities.
TLC - the amount of air that the lungs can contain following their maximal intake.
FRC - the amount of air in the lungs that remains after a typical, leisurely exhale.
RV - the amount of air in the lungs that is still there after maximal expiration. It is not possible to willingly release this air.
FEV1 - The amount of air that can be expelled vigorously in the first second after taking a complete breath. When evaluating respiratory function and identifying obstructive lung disorders, it is an essential measurement.
FVC - the total amount of air that can be exhaled vigorously following a full inhale.
Practical Data/Results
Record your spirometry data here:
Construct a scatter plot of FEV1 and FVC versus height for males and females in the class:
Questions
Check your measurements vs the standards for your demographic. Are your measurements within the expected range?
What is the relationship between FEV1 and FVC? Do the graphs for males and females intersect? i.e. can the difference between sexes be explained entirely by height?
The difference can’t be explained entirely by height.
What do you think the FEV1/FVC ratio tells you about lung function?
In pulmonary function tests, the FEV1/FVC ratio is an essential metric that aids in the distinction between restrictive and obstructive lung illnesses. A normal or high ratio with a decreased FVC implies restrictive diseases, where lung volumes are reduced but airflow is mostly preserved, whereas a low ratio indicates obstructive diseases, where airflow is hindered. Thus, this ratio offers important information regarding the kind and degree of lung disease.
Exercise 2: Effect of obstruction
How did obstruction effect FEV1 and FVC?
Airflow restriction brought on by obstructive lung illnesses results in a considerable decrease in FEV1, a decrease that may also be seen in FVC but less. When determining the severity of obstructive lung disorders, the distinctively low FEV1/FVC ratio plays a critical role in diagnosis.
Exercise 3: Effect of restriction
How would a restrictive condition such as fibrosis effect FEV1 and FVC?
Because of decreased lung compliance and volumes, restrictive diseases such pulmonary fibrosis lower both FEV1 and FVC; yet, the FEV1/FVC ratio stays normal or even slightly rises. Clinicians can distinguish between obstructive and restrictive lung disorders with the use of this distinctive pattern.
CHP207 – Week 5 Logbook entry
Pre-Lab Question/Task
Describe how an action potential propagates down an axon. In your answer describe why action potential propagation is important, and what would happen to muscles when they get stimulated by an action potential.
The voltage at resting membrane potential is -70 mV. Something depolarizes the resting membrane, raising the voltage to the threshold (-50 mV). A Na+ influx results from the opening of voltage-gated sodium ion channels at threshold. More voltage-gated sodium channels open as a result of Na+ inflow, raising the voltage. K+ starts to gradually expand at the threshold and keeps opening till after hyperpolarization. Repolarization starts when the action potential peaks, and the potassium flow exceeds the sodium flow. Na+ inflow is stopped at maximal potential (+30–40 mV) by activating inactivation gates. During repolarization, potassium channels stay open and cause K+ outflow. As a result, hyperpolarization occurs, lowering the voltage to -90 mV below the resting membrane potential. K+ potassium channels close and the resting membrane is restored during this phase, which is known as the relative refractory period.
Results
Table of amplitude and latency of the EMG trace following stimulation
Reading | EMG activity visible? | Amplitude (mV) | Latency (ms) |
1 | Yes | 0.531 | 8 |
2 | Yes | 0.219 | 10 |
3 | Yes | 0.974 | 9 |
4 | Yes | 0.661 | 10 |
5 | Yes | 1.946 | 9 |
Mean | 0.8662 | 9.2 |
Estimated conduction velocity (in metres per second, ms-1): 27.17 ms-1.
Questions
Answer the following questions with reference to the data set collected in class:
Our measured conduction velocity was 27.17 m/s, which is less than the alpha motor fiber's typical conduction speed of 30 to 60 m/s. The stimulus not occurring precisely at the scheduled time or something similar to the 30–60 m/s research The alpha motor fibre may have moved more fast in the programming due to minute delays or timing errors, such as having more expensive equipment. The time it takes for the action potential to move from one spot on the forearm to another would probably be measured using other, more expensive equipment, and the results would probably be more accurate. This would explain the latency's contraction time.
If the muscle contraction is subtracted from the elbow to the muscle contraction, the time it takes for the action potential to travel from the elbow to the wrist can be utilised to more accurately compute the conduction velocity of the nerve.
A nerve's rate of conduction stays constant regardless of the strength of the action potential, as seen by the noticeable increase in voltage amplitude when the stimulator's current is increased and the trace's latency staying constant with that of the lower current.
CHP207 – Week 6 Logbook entry
Pre-Lab Question/Task
Following action potential propagation to the pre-synaptic terminal, describe the key steps that occur in order for neurotransmitters to be released into the synaptic cleft?
- Depolarisation of the terminal results from action potential propagation in the pre-synaptic terminal.
- The voltage-gated calcium channels in the vesicle are where the action potential opens after travelling down the axon.
- The SNARE complex facilitates vesicle binding when Ca2+ enters the cell.
- The vesicle then travels and attaches itself to the pre-synaptic terminal membrane.
- Exocytosis: After this, neurotransmitters are diffused into the synaptic cleft from the vesicle.
- After binding to the post-synaptic terminal's receptors, neurotransmitters cause the terminal to open, allowing ions to enter and affect the cell. Glutamate can bind to particular glutamate receptors on post-synaptic neurones; this can control the amount and degree of excitement emitted. Messenger waves back and forth.
- When Ca2+ attaches to synaptotagmin, the SNARE complex is activated, directing the vesicle to travel to the pre-synaptic terminal membrane and discharge its contents into the synaptic cleft.
Questions
Membrane Potential
Ion | [Concentration outside the cell]o | [Concentration inside the cell]i |
K+ | 5mM | 140mM |
Na+ | 140mM | 12mM |
Cl- | 140mM | 10mM |
Using your knowledge of membrane potential physiology, calculate the equilibrium potential for each ion.
Note the following values:
F (Faraday’s constant) = 96540 C.mole-1 ; R (Ideal Gas Constant) = 8.31 J.deg-1mole-1 ;
T (absolute temperature) = 310 K (body temperature)
N.B. Shortcut – at this temperature, RT/F = 0.0267V (or 26.7mV). This can be worked out at the beginning to save time
Ion | Valence (Z) | Equilibrium potential (EM) (mV) |
K+ | +1 | -89mV |
Na+ | +1 | 66mV |
Cl- | -1 | 70mV |
Conductance
Ex = 26.7 x ln ((100x5) + (1x140) + (5x10) / (100x140) + (1x12) + (5x140))
Ex = -82mV
The resting membrane potential is most similar to K+. Because various ions have an impact on the equilibrium potential, it is different.
Synaptic Transmission
A new disease is discovered. Scientists have found that there are mutations in the protein machinery that tethers vesicles to ion channels that initiate neurotransmitter release.
Ca2+ ions
Influx of Ca2+ into the pre-synaptic terminal.
Neurotransmission release may be less effective if anchoring of the vesicle is compromised by mutations in the protein machinery (SNARE complex). This could result in a longer diffusion time of Ca2+. Moreover, injury to the SNARE complex may prevent the vesicle from travelling to the pre-synaptic terminal membrane, preventing ions from being neurotransmitted into the synaptic cleft.
The ‘tottering’ mouse is a spontaneously occurring mutant line of mice that has a wobbly gait, ataxia, and intermittent absence seizures. In 1996 it was discovered that this was due to a mutation in the Cav2.1 (a voltage gated calcium channel). Among other effects, this mutation leads to a change in the voltage dependence of the calcium channel, see below:
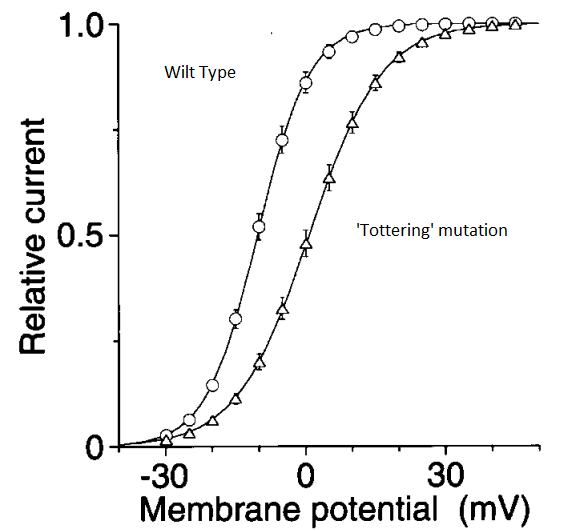
The graphic illustrates how neurotransmission release into the synaptic cleft is influenced by variations in the effectiveness of calcium release into the pre-synaptic terminal. The mouse is tottering because of a mutation that causes less ions and neurotransmitters to enter the synaptic cleft and takes a longer time to do so. This indicates that the cell is impaired or that the threshold has changed.
NMDA receptors have been described as nature’s coincidence detector.
Because glutamate and depolarisation are needed to release NDMAs from their magnesium block and allow them to flow calcium, which initiates long-term potentiation (LTP) of synaptic connections, NMDA is referred to as nature's coincidence detector.
You are performing electrical recording from a neuron in an underfunded lab, and you apply GABA. GABA changes the membrane potential of the cell, and you wonder whether this is due to GABA activating GABAA or GABAB receptors. You cannot afford antagonists to these receptors to give you a simple answer. However, the current-voltage relationship of the GABA-evoked currents look like this.
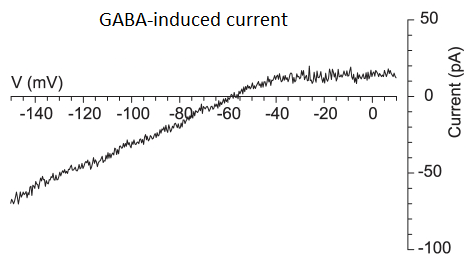
Since the current rise in the figure cannot occur with GABAa receptors, GABAb receptors must be involved.
The activity of the cell is impacted by GABAa receptors. GABAa's function is to restore the membrane potential to the Cl-equilibrium potential, also known as the resting membrane potential, if the cell is being affected by any other source of depolarisation. GABAa is known as the inhibitory neurotransmitter for this reason.
CHP207 – Week 7 Logbook entry
Pre-Lab Question/Task
The autonomic nervous system uses a two-neuron chain system to signal to effector tissues. Describe the two-neuron chain system, where each neuron is located, and how this system differs between the two divisions of the autonomic nervous system.
An essential component of the autonomic nervous system is the two-neuron chain system. It is composed of a preganglionic neurone that comes from the central nervous system and a postganglionic neurone that is located in a peripheral ganglion. The system's parasympathetic and sympathetic branches are distinct from one another. Preganglionic neurones are part of the sympathetic division and are found in the thoracolumbar region of the spinal cord. They interact with postganglionic neurones in sympathetic chain ganglia and prevertebral ganglia. In the parasympathetic division, preganglionic neurones are located in the nucleus of the sacral spinal cord or the cranial nerve, whereas postganglionic neurones are found in the ganglia of the cranial nerve or the sacral ganglia near the target organs. These ganglia are arranged to represent the distribution and innervation patterns of each body division.
Results
Table of skin conductance, skin temperature and heart rate during mental arithmetic (a mild stress).
Baseline Values | Stress | Recovery | ||||||||
Skin cond. (mV) | Skin temp. (°C) | Heart rate (bpm) | Skin cond. (mV) | Skin temp. (°C) | Heart rate (bpm) | Skin cond. (mV) | Skin temp. (°C) | Heart rate (bpm) | ||
-1.459 | 30.128 | 93.669 | -1.564 | 30.0216 | 93.815 | -1.461 | 30.0863 | 62.2978 | ||
-1.672 | 29.9956 | 94.248 | ||||||||
-1.666 | 29.9782 | 98.146 | ||||||||
-1.698 | 29.9558 | 96.382 | ||||||||
-1.716 | 29.9297 | 74.350 | ||||||||
-1.749 | 29.9191 | 84.558 | ||||||||
-1.753 | 29.9172 | 92.355 | ||||||||
-1.701 | 29.957 | 88.363 | ||||||||
-1.622 | 29.984 | 76.258 | ||||||||
-1.614 | 30.0114 | 71.017 | ||||||||
Mean | Mean | Mean | Mean | Mean | Mean | Mean | Mean | Mean | ||
-1.459 | 30.128 | 93.669 | -1.676 | 29.967 | 86.949 | -1.461 | 30.0863 | 62.2978 | ||
Questions
Answer the following questions with reference to the data set collected in class:
Skin conductance: As stress has persisted, conductance has been demonstrated to continuously decline.
Skin temperature: The findings indicate that, during stress, skin temperature drops relatively slightly. It appears that your skin temperature is lower than that of a healthy adult based on average.
Heart rate: It is difficult to interpret the results of heart rate because they are erratic. The adult average resting heart rate ranges from 60 to 100 beats per minute, with a mean of 86.949 beats per minute.
Stress primarily activates the sympathetic division of the autonomic nervous system. Stress causes the sympathetic branch to become active, which causes bodily responses that are similar to the "fight-or-flight" response. Norepinephrine is the primary neurotransmitter regulating this reaction. This reaction has been linked to a number of symptoms, such as elevated blood pressure, dilated pupils, elevated heart rate, heightened attentiveness, nervousness, jitteriness, and increased sweating.
After a stressful event, the parasympathetic nervous system is triggered during recuperation. Acetylcholine is the primary neurotransmitter that regulates this reaction. The primary signs of this are reduced blood pressure and heart rate, constricted pupils, tranquilly, and enhanced salivation and digestive abilities. Based on our findings, the only thing that truly supports this is the lower mean heart rate during the recovery and stress tests.
CHP207 – Week 8 Logbook entry
Pre-Lab Question/Task
Write a paragraph in your lab book defining the components of a typical electrocardiogram trace in particular what cardiac events produce the typical waves we see on an ECG. Explain what the ECG tells you about the electrical activity of the heart.
Differentiating waves that represent different heart events make up an electrocardiogram (ECG) trace. Atrial depolarisation, or the P wave, indicates that the atria have contracted. The QRS complex, which is associated with ventricular depolarisation, displays the ventricles' contraction. Ventricular repolarization, or the T wave, signifies that the ventricles have relaxed and reset.
When combined, these waves provide information on the heart's electrical activity. The ECG is used to assess the heart's overall cardiac health as well as its rhythm and speed. Anatomical abnormalities, aberrant conduction routes, cardiac ischemia, irregular heart rhythms (arrhythmias), and electrolyte imbalances are among the defects that it can detect.
By examining the ECG waveform, medical professionals can detect various heart issues and monitor the effectiveness of therapy. The electrocardiogram (ECG) is a valuable diagnostic and therapeutic tool for determining the electrical activity of the heart.
Results
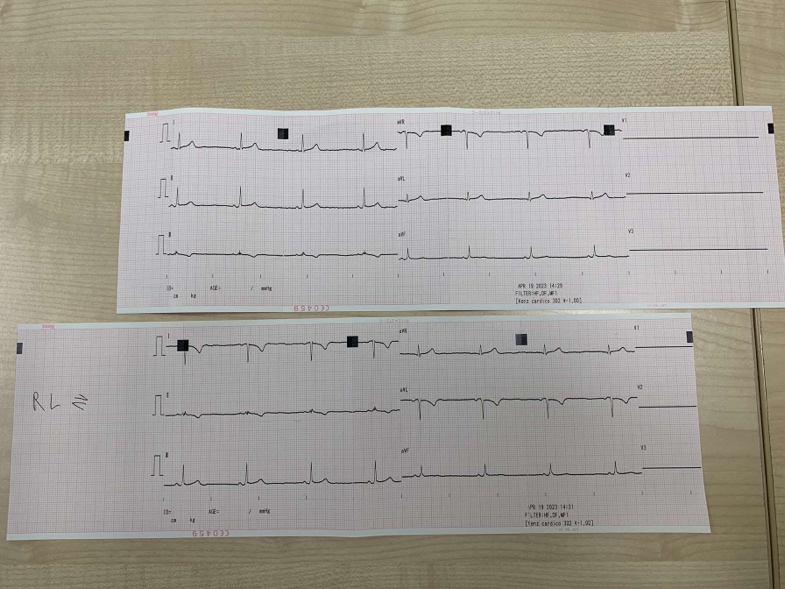
Your two ECG traces (normal and electrodes swapped) go here:
Questions
Using your ECG traces, answer the following:
Lead 1 from the original test and the one after the electrodes were switched exhibit exactly the same length in the peaks; however, the graph shows the peaks moving downhill as opposed to upward. This is because the electrodes that were utilised to record the signal caused a shift in the electrical vector's direction. A particular direction or angle of the heart's electrical activity is shown by each lead in an ECG. The results of the two tests' leads 2 and 3 are entirely different.
Big positive spike
Negative spike with the peaks going downwards
Would be the flattest.
No, estimating the QRS axis based only on one complex is insufficient. This is due to the fact that the QRS represents the general direction of ventricular depolarisation in the heart, and it is frequently examined using a number of leads to obtain a more accurate approximation.
Lead 1 can, however, provide an estimate that may indicate the QRS complex is somewhere between 0 and 90º if it is primarily positive.
Use the relative heights (in mm) of the two largest positive QRS wave deflections (often lead I and lead III work best) waves to determine your QRS axis. You can use chart paper to do this or the print-out of the cardiac axis provided. Please make sure you add the chart paper should to your log book if you decide to use it.
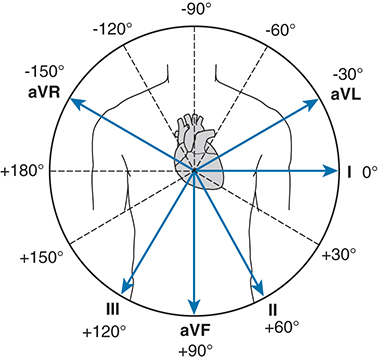
45º
CHP207 – Week 9 Logbook entry
Pre-Lab Question/Task
Write a short paragraph in your lab book outlining exactly when during a cardiac cycle systolic and diastolic blood pressure are measured. Explain whether you can have a change in systolic blood pressure independent of a change in diastolic blood pressure.
Systolic blood pressure is measured at the systolic phase, which coincides with the ventricles contracting. When the heart pumps blood into the bloodstream, it generates the greatest pressure possible. Diastolic blood pressure is determined during the diastolic phase, which occurs when the heart relaxes and fills with blood in between heartbeats. The diastolic blood pressure indicates the lowest arterial pressure during this period of rest.
Changes in diastolic blood pressure are not always accompanied by changes in systolic blood pressure. For example, systolic blood pressure tends to rise sharply during exercise or physical activity because of the increased cardiac output and peripheral resistance. However, diastolic blood pressure may see a little change or even a slight decrease as a result of vasodilation in certain blood arteries.
Results and Questions
Experiment 1: Impact of site of measurement on blood pressure recordings
Systolic Blood pressure (mmHg) | Diastolic Blood pressure (mmHg) | Heart rate (bpm) | |
Automatic blood pressure monitor on the upper arm | 112 | 66 | 53 |
Automatic blood pressure monitor on the lower arm (forearm) | 98 | 74 | 54 |
Automatic blood pressure monitor on the lower leg (calf) | 152 | 109 | 58 |
Systolic Blood pressure (mmHg) | Diastolic Blood pressure (mmHg) | Mean arterial pressure (MAP) | |
Automatic blood pressure monitor on the upper arm | 112 | 66 | 81.3 |
Q1. Was blood pressure similar or different between the different sites? If it was different, why is this the case?
They're not the same.
More muscle is required to combat the high pressure in the calf (squeezing both the arteries and the muscle).
Because the arm is farther from the heart, there is less pressure there.
Experiment 2: Effects of exercise on blood pressure and heart rate
Event | Systolic pressure (mmHg) | Diastolic pressure (mmHg) | Heart rate (bpm) | MAP |
Rest 1 (2min) | 112 | 75 | 58 | 87.3 |
Rest 2 (4min) | 110 | 68 | 54 | 82 |
Post-exercise 1 | 147 | 70 | 91 | 95.6 |
Post-exercise 2 | 128 | 71 | 64 | 90 |
Post-exercise 3 | 119 | 69 | 70 | 85.6 |
Post-exercise 4 | 115 | 65 | 66 | 81.6 |
Post-exercise 5 | 117 | 67 | 68 | 83.6 |
Task: Draw graphs of the systolic blood pressure and heart rate as they change over time using the axes provided below.


Q1. Explain whether the following increased or decreased during exercise and include a brief explanation as to why/what is driving the change:
Exercise raised the systolic blood pressure. The need for more blood flow to the muscles during exercise in order to supply oxygen and eliminate waste products like lactic acid increases the muscles' demand for oxygen. Because of this, the heart pumps blood more forcefully and with greater volume during exercise, which raises blood pressure levels.
Exercise also causes an increase in heart rate. As previously explained, increased heart rate results from the heart having to work harder to supply the body with the increased blood flow and oxygen distribution that exercise requires.
Exercise causes a rise in mean arterial blood pressure. Activation of the sympathetic nervous system during exercise results in the release of chemicals like adrenaline, which promotes vasoconstriction and reroutes blood flow. This raises MAP together with the increased cardiac output that comes with exercise.
Q2. How does the magnitude of the change in mean arterial blood pressure compare to the change in systolic blood pressure from rest to the first measurement after exercise (i.e., rest vs post-exercise 1)? If there is a difference in the change, make sure you try and explain why this is the case.
Generally speaking, the change in systolic blood pressure is larger than that of MAPs. Exercise causes an increase in peripheral resistance and an increased cardiac output, which results in a more visible rise in systolic blood pressure. Therefore, the difference between the resting systolic blood pressure and the first post-exercise measurement is usually greater than the difference between the resting MAP and the first post-exercise measurement.
CHP207 – Week 10 Logbook entry
Pre-Lab Question/Task
Describe the main physiological mechanisms that comprise the dive response.
Holding one's breath while immersed is known as the "diving response". Similar to what happens when one submerges their head in water, the body senses when breath is being retained and responds by slowing the heart rate through the parasympathetic nervous system. The parasympathetic nervous system becomes more active and releases more acetylcholine when one is in touch with water, in addition to the heart rate decreasing when one is holding their breath underwater. The presence of cold and wet water can be detected by a number of receptors on the face, which further activates the PNS and decreases heart rate.
The diving reaction gets its name from the three primary physiological changes that result from this interaction during aquatic submersion: bradycardia, increased peripheral vascular resistance, and apnea. When combined, these physiological changes reduce the strain on the heart and redirect the body's oxygen supply to vital organs, such as the brain, allowing them to operate normally even in submerged conditions.
Results and Questions
Part A: Impact of breath hold on heart rate and blood flow
Event/Time (sec) | Heart Rate | Finger pulse amplitude |
Baseline 1 (2min) | 75.23 | 30.74 |
Baseline 2 (4min) | 73.84 | 29.07 |
Breath hold (15sec) | 84.60 | 29.17 |
Breath hold (30sec) | 74.26 | 32.29 |
Breath hold (60sec) | - | - |
30sec after breath hold | 67.52 | 40.85 |
Describe the patterns in heart rate and peripheral blood flow you observed.
Heart rate was revealed to have increased throughout the breath hold compared to the baseline. After the breath hold is over, it is seen to drop once more. It is difficult to interpret the results because the finger pulse measurements are aberrant.
Consider this experimental design – what is the value of determining the effect of breath holding on heart rate?
It makes important knowledge about the cardiovascular system, neurotransmitter response, and brain function possible. This covers how the autonomic nervous system operates. Understanding human limitations, the need for gas exchange between oxygen and carbon dioxide, and the importance of blood flow in the human body can all be greatly aided by this.
Part B: Impact of dive response on heart rate and blood flow
Event/Time (sec) | Heart Rate | Finger pulse amplitude |
Baseline 1 (2min) | 60.98 | 19.36 |
Baseline 2 (4min) | 73.56 | 19.69 |
Breath hold (15sec) | 112 | 46.15 |
Breath hold (30sec) | 104 | 50.77 |
Breath hold (60sec) | - | - |
30sec after breath hold | 69.73 | 35.96 |
Describe the patterns in heart rate and peripheral blood flow you observed.
Between the average baseline and breath hold underwater, there was a markedly anomalous increase in both heart rate and finger pulse amplitude. Following the breath hold, both variables also appeared to have sharply reduced.
How did heart rate and blood flow changes in the cold water dive compare with the breath hold only?
Compared to a regular breath hold, the underwater breath hold produced higher heart rate rates. This is highly unusual since the parasympathetic nervous system was more strongly stimulated by the receptors on the face that sensed the cold and moisture, which meant that the heart rate should have decreased rather than risen.
CHP207 – Week 11 Logbook entry
Pre-Lab Question/Task
Briefly describe the concept of renal clearance (you will have to research this on your own!)
Renal clearance is a concept used to evaluate and measure the degree to which a substance is eliminated from the bloodstream by the kidneys. It is defined as the volume of plasma from which a chemical is completely removed in a specified length of time. Renal clearance provides crucial information on the kidneys' ability to eliminate different solutes from the bloodstream, including waste materials, medications, and other solutes. Moreover, during the procedure, the renal tubules are utilised for secretion, reabsorption, and filtering.
C = (U x V) / P
Problems and Questions
Objective – to illustrate the independence of inulin clearance from the concentration of inulin in plasma and the rate of urine flow.
Using the following data calculate the inulin clearance and indicate the units for clearance.
Urine flow (mL/min) | Plasma inulin concentration (mg/mL) | Urine inulin concentration (mg/mL) | Inulin clearance ( ) |
A | |||
1.2 | 0.8 | 45 | 67.5 |
1.3 | 1.4 | 68 | 63.1 |
1.0 | 2.4 | 141 | 58.8 |
1.4 | 3.8 | 168 | 61.9 |
1.2 | 5.7 | 294 | 61.9 |
B | |||
1.3 | 0.5 | 23 | 59.8 |
2.1 | 0.5 | 17 | 71.4 |
3.1 | 0.4 | 8 | 49.6 |
5.7 | 0.5 | 5 | 57 |
6.6 | 0.5 | 5 | 66 |
The concentration of inulin in plasma increases with the amount of inulin in the urine. This is because the rising plasma level of inulin causes more of it to be easily filtered in the glomerulus. The increasing substrate suggests that more is flowing into the urine even while GFR stays same.
As the rate of urine flow increases, the amount of inulin in the urine decreases. Because of the stability of inulin's plasma concentration, the amount of inulin filtered remains relatively constant. Because the pee flow rate is increasing but nothing else is, there will be a higher dilution factor and a corresponding lower concentration of inulin in the urine.
Objective – to demonstrate the concept of steady state. When a person is in steady state the output of a given substance is equal to the input of that substance.
In the following study, inulin was infused into the antecubital vein of a healthy student volunteer whose GFR was 120 mL/min. The inulin was infused at a steady rate of 72 mg/min and periodically blood was withdrawn for determination of the plasma inulin concentration (Pin).
Elapsed time (min) | Rate of inulin infusion (mg/min) | GFR (mL/min) | Pin (mg/mL) | Urinary excretion of inulin (mg/min) |
1 | 72 | 120 | 0.005 | 0.6 |
5 | 72 | 120 | 0.02 | 2.4 |
10 | 72 | 120 | 0.05 | 6 |
50 | 72 | 120 | 0.24 | 28.8 |
100 | 72 | 120 | 0.47 | 56.4 |
110 | 72 | 120 | 0.6 | 72 |
120 | 72 | 120 | 0.6 | 72 |
It would be predicted that the plasma concentrations would be 0 g/mL.
The body excretes inulin at a slower rate (output) than it infuses it (input) up until 110 minutes. Thus, until 110 minutes have elapsed, and the excretion rate reaches the infusion rate, the plasma concentration increases.
The increase in plasma insulin levels stops around 110 minutes. This is because the excretion rate has increased to 72 mg/min in order to match the infusion rate of 72 mg/min. This refers to the steady state concentration.
Objective – to illustrate that the clearance of creatinine can be used as well as the clearance of inulin to estimate GFR.
The following data was collected from a patient over the course of 24 hours.
Urine flow (mL/min) | Pin (mg/dL) | Uin (mg/dL) | Clearance ( ) | Pcr (mg/dL) | Ucr (mg/dL) | Clearance ( ) |
1.0 | 102 | 5076 | 13.1 | 673 | 51.4 | |
1.1 | 104 | 4601 | 14.0 | 630 | 49.4 | |
0.9 | 106 | 6017 | 15.5 | 890 | 51.7 | |
1.0 | 107 | 5137 | 16.0 | 792 | 49.5 |
Using the data given, calculate the inulin and creatinine clearances. Supply the appropriate units for clearance.
The most accurate measure of GFR would come from inulin, as it is only filtered in the glomerulus and is neither secreted nor reabsorbed throughout the tubules. Because creatine might be released along the tubule, the amount does not exactly reflect the amount filtered by the kidneys.
One advantage of using creatine is that it is naturally found in the blood and that these levels stay rather constant over time.
Elevated levels of plasma creatine indicate a malfunctioning GFR that is filtering less substrate. More creatine remains in the blood as a result of the rate of creatine removal slowing down.
Another explanation for the elevated plasma creatine levels could be an increase in creatine production to the point that it outpaces the rate of excretion. To counter this, excretion rates would also need to increase.
CHP207 – Week 12 Logbook entry
Pre-Lab Question/Task
Identify where ADH acts on the nephron and describe how it regulates water permeability at this site. What would be the status of ADH in a dehydrated person versus well hydrated person?
The kidney's collecting ducts are home to ADH, which controls water permeability. Its purpose is to improve water permeability by facilitating the reabsorption of water from the urine and back into the bloodstream while also allowing the urine to become more concentrated.
More ADH is generated in a dehydrated individual in order to increase the amount of water that is drawn from the urine and reabsorbed into the bloodstream. This aids in controlling urine concentration and the body's water balance.
Results and Questions
Renal Practical - RESULTS
Group Members:
Table 1: Results for control subject (drinks no water)
Sample | 1 | 2 | 3 | 4 | 5 | 6 |
Time (min) | 0 | 20 | 40 | 60 | 90 | 120 |
Time elapsed from last sample (min) | 0 | 20 | 20 | 20 | 30 | 30 |
Volume (v: ml) | 205 | 25 | 15 | 15 | 17 | 19 |
Rate of excretion of urine (V: ml/min) | - | 1.25 | 0.75 | 0.75 | 0.57 | 0.63 |
Specific gravity (x) | 0.017 | 0.015 | 0.017 | 0.015 | 0.019 | 0.02 |
Urine osmolarity (mOsm/L) | 540 | 480 | 540 | 480 | 610 | 640 |
[Na+] (mmol/L) | 83 | 41 | 74 | 65 | 79 | 91 |
[K+] (mmol/L) | 64 | 43 | 61 | 58 | 79 | 80 |
Rate of excretion of Na (μmol/L) | - | 2050 | 3700 | 3250 | 2633 | 3033 |
Rate of excretion of K (μmol/L) | - | 2150 | 3050 | 2900 | 2633 | 2667 |
Table 2: Results for test subject (drinks 1 L of water)
Sample | 1 | 2 | 3 | 4 | 5 | 6 |
Time (min) | 0 | 20 | 40 | 60 | 90 | 120 |
Time elapsed from last sample (min) | 0 | 20 | 20 | 20 | 30 | 30 |
Volume (v: ml) | 52 | 18 | 34 | 200 | 345 | 295 |
Rate of excretion of urine (V: ml/min) | - | 0.9 | 1.7 | 10 | 11.5 | 9.83 |
Specific gravity (x) | - | - | - | - | - | - |
Urine osmolarity (mOsm/L) | 1010 | 775 | 470 | 315 | 285 | 315 |
[Na+] (mmol/L) | 93 | 41 | 14 | 5 | 2 | 2 |
[K+] (mmol/L) | 67 | 43 | 19 | 8 | 8 | 11 |
Rate of excretion of Na (μmol/L) | - | 2050 | 700 | 250 | 70 | 70 |
Rate of excretion of K (μmol/L) | - | 2150 | 950 | 400 | 270 | 370 |
Questions:
1.04mL/min x 1.5L per 24 hours
Because of this, at the start of the trial, the 'test' individual produced 0.9 mL/min of urine for the first 20 minutes, compared to 1.25 mL/min for the 'control' participant.
The expected osmolarity, on average, is around 275 mOsm/L. The control individual had urine with an osmolarity of 540 mOsm/L at the start of the experiment, while the test patient had 1010 mOsm/L. At this time, it goes much beyond what was anticipated.
This indicates that at the start of the trial, the urine outputs of the test group and the control group were strikingly similar. Both groups' urine output values were in close range of the average and were indicative of a normal water balance. Both the test subject and the control group exhibited elevated urine osmolarities in comparison. The test subject displayed mild dehydration, which might have been attributed to variations in their pre-experiment water intake and morning foods.
Use the data you collect in the above tables to plot a graph of your results in the space below. For both control and test subjects plot the rate of sodium and potassium excretion against time on one graph and the rate of urine excretion against time on another graph. Use the graphs to answer the following questions. If you prefer using excel, you are welcome to plot this data in excel and replace the graphs below with the excel generated graphs.
Rate of sodium and potassium excretion against time 
Questions:
The control subject's urine output decreases over the course of two hours, starting at 1.25 mL/min and ending at 0.63 mL/min. On the other hand, after 90 minutes, the test subject's urine excretion rate increased to a maximum of 11.50 mL/min.
When the urine production increased from 34 to 200 mL and the excretion rate from 1.7 to 10 mL/min at the 60-minute mark, the diuresis was first observed. The increase in pee flow, which indicates diuresis, highlights the massive amount of fluid/water in the urine.
ADH stimulates urine production when it is absent. The blood's decreasing osmolarity stimulates the pituitary gland to reduce or stop secreting ADH. ADH encourages the collecting tubule to reabsorb water when the body has too much of it. ADH release is slowed because the body does not want to reabsorb all of this water, which causes less water to be reabsorbed and more water to be in the urine.
A decrease in blood asmolarity is detected by asmoreceptors in the hypothalamus and carotid artery, and an increase in blood volume is detected by baroreceptors in the carotid sinus and aortic arch. These subsequently have an impact on the pituitary gland's release of ADH.
At the onset of the experiment, the control participant's ADH levels would have been somewhat normal. As the experiment went on and they kept urinating, the body's water levels would have begun to drop. To maintain water homoeostasis, the body would have increased plasma levels, increased ADH secretion from the pituitary gland, and increased water reabsorption in the collecting tubule. This is noticeable when the urine volume dramatically decreases from 205 mL to 25 mL and 15 mL, respectively, at approximately the 20 to 40 minute mark.
The control individual would have had somewhat normal ADH levels at the start of the investigation. The body's water content would have started to decrease as the experiment continued and they continued to urinate. The body would have higher plasma levels, more pituitary gland release of ADH, and higher water reabsorption in the collecting tubule in order to preserve water homoeostasis. This is apparent at about the 20 to 40 minute mark, when the urine volume drops substantially from 205 mL to 25 mL and 15 mL, respectively.
CHP207 – Week 13 Logbook entry
Pre-Lab Question/Task
What are the three main systems/mechanisms that help regulate pH status in the body. Explain the time-course of when each his activated in response to a pH change.
The body uses three different ways to maintain pH: the buffer system, respiratory control, and renal compensation. The initial line of defence in the event of a pH shift is the buffer system, which kicks in immediately and stabilises the pH by releasing hydrogen ions to neutralise it. If the pH shift continues, respiratory control controls the depth and rate of breathing, which controls the blood's CO2 levels. Chemoreceptors trigger this reaction, regulating breathing's respiratory effort to assist in bringing pH levels back to normal. The lengthy process of renal compensation maintains pH values in the urine by controlling the concentration of hydrogen and bicarbonate ions.
Questions and problems
Question 1. Classify the acid-base disorders from the arterial blood values for each of the following scenarios and provide the primary cause and compensatory processes.
pH (7.35-7.45) | pCO2 (35-45mmHg) | HCO3- (22-32mM) | |
a) | 7.32 | 28 | 14 |
b) | 7.47 | 20 | 14 |
c) | 7.51 | 49 | 38 |
d) | 7.70 | 15 | 18 |
e) | 7.20 | 40 | 14 |
a) Metabolic acidosis with respiratory compensation
b) Respiratory alkalosis with metabolic compensation
c) Metabolic alkalosis with respiratory compensation
d) Respiratory alkalosis with metabolic compensation
e) Mixed metabolic and respiratory acidosis
Case scenario
Steve is 35-years-old and has Type 1 Diabetes. Steve is found unconscious at home by his wife and is brought into hospital via ambulance. His wife is unsure of exactly how much insulin he’d been taking recently, but she thinks he may have cut back a bit due to his very poor appetite over the last few days. He is clinically dehydrated.
Arterial blood and gas analysis shows:
pH 7.20 (7.35-7.45)
paCO2 20 mmHg (35-45 mmHg)
HCO3- 14 mmol/L (22-32 mmol/L)
Na+ 140 mmol/L (135-145 mmol/L)
K+ 5.9 mmol/L (3.5-5.2 mmol/L)
Cl- 97 mmol/L (95-110 mmol/L)
Glucose 35 mmol/L (4.0-6.0 mmol/L)
Lactate 1.2 mmol/L (<2 mmol/L)
Urinalysis is positive for glucose and ketones.
Question 1
Primary metabolic acidosis with respiratory compensation
The main reason for this disruption is the drop in blood bicarbonate ions.
Question 2
Explain the physiological defence mechanisms that would be activated and working to correct the acid base disorder in Steve’s body.
The kidneys repair this by utilising CO2 and H20 from the blood to synthesise HCO3- and eliminating the excess H+ in the urine. This will cause the pH to rise.
Question 3
With reference to renal physiology, explain how type 1 diabetes alters ECF potassium (K+) levels:
Acidosis, which results in excess K+ leaving cells and entering them instead, is a condition that affects people with type 1 diabetes who are not making insulin. The person and blood become hyperkalemic as a result.
Over time, the body will begin to release aldosterone, which lowers blood K+ levels by stimulating K+ excretion and Na+ reabsorption. More K+ is being flushed out as a result of a constant concentration gradient between the cells and the tubules as well as a high tubular flow. Elevated secretion can be attributed to elevated substrate levels, increased basolateral pump activity, and high plasma K+ concentration. Thus, the sum of these three pathways results in a decrease in blood K+ levels and an increase in urine K+ levels.
Scenario 2
A few days later, Steve is brought into hospital via ambulance because his condition has deteriorated. His wife reports that he has a respiratory tract infection over the past four days and has been complaining about being short of breath. Arterial blood and gas analysis now shows:
pH 7.02 (7.35-7.45)
paCO2 40 mmHg (35-45 mmHg)
HCO3- 10 mmol/L (22-32 mmol/L)
Na+ 140 mmol/L (135-145 mmol/L)
K+ 5.9 mmol/L (3.5-5.2 mmol/L)
Cl- 97 mmol/L (95-110 mmol/L)
Glucose 35 mmol/L (4.0-6.0 mmol/L)
Lactate 1.2 mmol/L (<2 mmol/L)
Urinalysis is still positive for glucose and ketones.
Question 3
Classify the Steve’s acid base disorder in this scenario.
Metabolic Acidosis and respiratory acidosis
Comment on the pH and pCO2 in this case. How does the Steve’s acid base status differ from that seen in the first scenario above?
More HCO3-has dropped, pH has dropped even more, and pC02 has stabilised to normal levels. Although his pCO2 should be low, the fact that it is within normal ranges indicates that his body is not responding appropriately to the respiratory tract infection.
Does the normal pCO2 exclude a respiratory acid base disorder?
No. If he were attempting to counteract the metabolic acidosis, a low pC02 would be predicted, which suggests that he has a respiratory acid-based disease. This suggested that he has respiratory acidosis because it is not usual in a person with metabolic acidosis. His pH is being further lowered by this.
Haidar Alnasser – 620690
CHP207 – Week 2 Logbook entry
Pre-Lab Question/Task
No prelab question to complete. Review material from week 1-2 in preparation for the workshop.
Questions
Case 1: Surfactant
The alveoli are surrounded by surfactant, which helps reduce surface tension. Alveoli are surrounded by water molecules, which raise surface tension and may result in alveolar collapse. Alveolar collapse is avoided, and surface tension is reduced when surfactant molecules are involved. This is because the forces holding the water molecules together are disrupted by the surfactant molecules. In addition to promoting adequate gas exchange, this maintains the alveolar structure. Laplace's law states that the tension inside a spherical or cylindrical structure's wall is exactly proportionate to the total of the structure's internal pressure and radius. (P x r = T)
An alveoli may collapse into another alveoli with less tension if there is greater tension on one and surfactant is not helping to reduce this tension. As a result, the collapsing pressure of the lung increases, increasing collapsing forces and decreasing lung compliance.
Because the expansion of the thoracic cavity must grow to equalise the force, functional residual capacity will decrease if collapsing forces are greater.
Airway resistance increases as a result of increased friction and drag brought on by the alveolar radius and lung volume contracting owing to stress. Remaining air is transferred from collapsing alveoli to less tensioned alveoli as an alveolar collapses. As a result, air is forced into a different alveoli, which further increases airway resistance.
A decrease in volume change results in a decrease in ventilation.
If more alveoli collapse, it will have an impact on gas exchange. Thus, for gas exchange to be effective, surface area must decrease. (PCO2 rises, but PO2 falls).
O2 pressure will drop since there is less gas exchange. This indicates that there is less O2 available to support and aid in the body's O2 circulation.
Diffuse oxygen intake by red blood cells is decreased. This indicates that the body's organs and tissues aren't receiving enough oxygen through red blood cells. This consequently compromises bodily function. When this happens, haemoglobin with a high affinity for oxygen is either underutilised or inefficient.
CHP207 – Week 3 Logbook entry
Pre-Lab Question/Task
Describe how ventilation is controlled. In your answer describe the neural centres and the sensors/receptors involved and how changes in the partial pressures of oxygen and carbon dioxide affect breathing.
Ventilation is controlled by the medulla's reparatory centre. Changes in the partial pressure of carbon dioxide and oxygen are detected by the respiratory centre in the medulla, which then signals the lungs to alter breathing to restore the body's homeostatic balance. Very small changes in PCO2 are the main source of ventilation changes since they are unfavourable and are thus observed. On the other hand, PO2 might fluctuate considerably prior to inducing a need for ventilation.
Practical Data/Results
Record your results from the practical here (Baseline (1a) + Breaking point (2a, b, c)
Trial/condition | PAO2 (mmHg) | PACO2 (mmHg) | Time (sec) |
Normal/Rest (use the ‘theoretical values for alveolar PO2/PCO2 at rest) | 118 | 29.54 | N/A |
Breath-hold | 91.62 | 39.50 | 46.82 |
Hyperventilation | 126.91 | 25.95 | N/A |
Hyperventilation + Breath-hold | 90.91 | 41.07 | 37 |
Questions
The theoretical value for PAO2 is 104mmHg and 40mmHg for PACO2.
The results show an increase of PAO2 at 118mmHg and a decrease for PACO2 at 29.54mmHg.
The three factors are perfusion, diffusion, and ventilation.
Because of effective gas exchange, the partial pressures of carbon dioxide (PACO2) and oxygen (PAO2) in the alveoli closely match those in the arterial blood leaving the lungs. Elevated alveolar pH (PAO2) raises arterial blood oxygen levels, but elevated alveolar pH also raises arterial blood carbon dioxide levels. This is essential for preserving homeostasis, making sure that tissues receive enough oxygen, and eliminating carbon dioxide.
Breath-hold (2a): PAO2 = 91.62mmHg, PACO2 = 39.50mmHg
Hyperventilation (2b): PAO2 = 126.91mmHg, PACO2 = 25.95mmHg
While the tissues are not obtaining new air, they continue to produce carbon dioxide and use oxygen, which causes PAO2 to rise throughout the breath-hold (2a) relative to the baseline. For hyperventilation (2b) the opposite has occurred as an excess amount of air is breathed in at a higher rate, increasing the oxygen levels and decreasing CO2 levels.
Because of the lower starting CO2 levels, one may anticipate a longer breath-hold duration following hyperventilation, which would postpone the need to breathe. The shorter breath-hold duration in 2c may be the result of additional physiological factors influencing breath-holding ability or a higher need to breathe brought on by rapid CO2 accumulation.
The trials show that CO2 levels have a significant influence on breathing regulation. Breathing desire is substantially stimulated by increased PACO2 (hypercapnia). The urge to breathe can be temporarily delayed by hyperventilation, which decreases CO2 levels initially, but the strong respiratory drive that follows can be caused by the sudden rise in CO2 levels.
The ratio of CO2 produced to O2 consumed by the body's tissues is known as the respiratory quotient, or RQ. The diet's macronutrient composition has an impact on it. For a mixed diet consisting of proteins, lipids, and carbs, an RQ of 0.8 is usually assumed. The body metabolises a balanced combination of these macronutrients in this average metabolic state, which is represented by this value.
Alveolar gas equation: PAO2 = PIO2 – (PACO2 / RQ)
PIO2 = 0.21% x (760-47) = 149.73 mmHg
PAO2 = 149.73 – (29.54 / 0.8) = 112.805mmHg
There is a little difference between the directly measured PAO2 (118 mmHg) and the computed PAO2 (112.805 mmHg). This slight discrepancy can be the result of tiny changes in measurement accuracy or physiological parameters.
CHP207 – Week 4 Logbook entry
Pre-Lab Question/Task
Define the following terms: TLC, FRC, RV, FEV1 and FVC, and draw a diagram to show the different lung volumes and capacities.
TLC - the amount of air that the lungs can contain following their maximal intake.
FRC - the amount of air in the lungs that remains after a typical, leisurely exhale.
RV - the amount of air in the lungs that is still there after maximal expiration. It is not possible to willingly release this air.
FEV1 - The amount of air that can be expelled vigorously in the first second after taking a complete breath. When evaluating respiratory function and identifying obstructive lung disorders, it is an essential measurement.
FVC - the total amount of air that can be exhaled vigorously following a full inhale.
Practical Data/Results
Record your spirometry data here:
Construct a scatter plot of FEV1 and FVC versus height for males and females in the class:
Questions
Check your measurements vs the standards for your demographic. Are your measurements within the expected range?
What is the relationship between FEV1 and FVC? Do the graphs for males and females intersect? i.e. can the difference between sexes be explained entirely by height?
The difference can’t be explained entirely by height.
What do you think the FEV1/FVC ratio tells you about lung function?
In pulmonary function tests, the FEV1/FVC ratio is an essential metric that aids in the distinction between restrictive and obstructive lung illnesses. A normal or high ratio with a decreased FVC implies restrictive diseases, where lung volumes are reduced but airflow is mostly preserved, whereas a low ratio indicates obstructive diseases, where airflow is hindered. Thus, this ratio offers important information regarding the kind and degree of lung disease.
Exercise 2: Effect of obstruction
How did obstruction effect FEV1 and FVC?
Airflow restriction brought on by obstructive lung illnesses results in a considerable decrease in FEV1, a decrease that may also be seen in FVC but less. When determining the severity of obstructive lung disorders, the distinctively low FEV1/FVC ratio plays a critical role in diagnosis.
Exercise 3: Effect of restriction
How would a restrictive condition such as fibrosis effect FEV1 and FVC?
Because of decreased lung compliance and volumes, restrictive diseases such pulmonary fibrosis lower both FEV1 and FVC; yet, the FEV1/FVC ratio stays normal or even slightly rises. Clinicians can distinguish between obstructive and restrictive lung disorders with the use of this distinctive pattern.
CHP207 – Week 5 Logbook entry
Pre-Lab Question/Task
Describe how an action potential propagates down an axon. In your answer describe why action potential propagation is important, and what would happen to muscles when they get stimulated by an action potential.
The voltage at resting membrane potential is -70 mV. Something depolarizes the resting membrane, raising the voltage to the threshold (-50 mV). A Na+ influx results from the opening of voltage-gated sodium ion channels at threshold. More voltage-gated sodium channels open as a result of Na+ inflow, raising the voltage. K+ starts to gradually expand at the threshold and keeps opening till after hyperpolarization. Repolarization starts when the action potential peaks, and the potassium flow exceeds the sodium flow. Na+ inflow is stopped at maximal potential (+30–40 mV) by activating inactivation gates. During repolarization, potassium channels stay open and cause K+ outflow. As a result, hyperpolarization occurs, lowering the voltage to -90 mV below the resting membrane potential. K+ potassium channels close and the resting membrane is restored during this phase, which is known as the relative refractory period.
Results
Table of amplitude and latency of the EMG trace following stimulation
Reading | EMG activity visible? | Amplitude (mV) | Latency (ms) |
1 | Yes | 0.531 | 8 |
2 | Yes | 0.219 | 10 |
3 | Yes | 0.974 | 9 |
4 | Yes | 0.661 | 10 |
5 | Yes | 1.946 | 9 |
Mean | 0.8662 | 9.2 |
Estimated conduction velocity (in metres per second, ms-1): 27.17 ms-1.
Questions
Answer the following questions with reference to the data set collected in class:
Our measured conduction velocity was 27.17 m/s, which is less than the alpha motor fiber's typical conduction speed of 30 to 60 m/s. The stimulus not occurring precisely at the scheduled time or something similar to the 30–60 m/s research The alpha motor fibre may have moved more fast in the programming due to minute delays or timing errors, such as having more expensive equipment. The time it takes for the action potential to move from one spot on the forearm to another would probably be measured using other, more expensive equipment, and the results would probably be more accurate. This would explain the latency's contraction time.
If the muscle contraction is subtracted from the elbow to the muscle contraction, the time it takes for the action potential to travel from the elbow to the wrist can be utilised to more accurately compute the conduction velocity of the nerve.
A nerve's rate of conduction stays constant regardless of the strength of the action potential, as seen by the noticeable increase in voltage amplitude when the stimulator's current is increased and the trace's latency staying constant with that of the lower current.
CHP207 – Week 6 Logbook entry
Pre-Lab Question/Task
Following action potential propagation to the pre-synaptic terminal, describe the key steps that occur in order for neurotransmitters to be released into the synaptic cleft?
- Depolarisation of the terminal results from action potential propagation in the pre-synaptic terminal.
- The voltage-gated calcium channels in the vesicle are where the action potential opens after travelling down the axon.
- The SNARE complex facilitates vesicle binding when Ca2+ enters the cell.
- The vesicle then travels and attaches itself to the pre-synaptic terminal membrane.
- Exocytosis: After this, neurotransmitters are diffused into the synaptic cleft from the vesicle.
- After binding to the post-synaptic terminal's receptors, neurotransmitters cause the terminal to open, allowing ions to enter and affect the cell. Glutamate can bind to particular glutamate receptors on post-synaptic neurones; this can control the amount and degree of excitement emitted. Messenger waves back and forth.
- When Ca2+ attaches to synaptotagmin, the SNARE complex is activated, directing the vesicle to travel to the pre-synaptic terminal membrane and discharge its contents into the synaptic cleft.
Questions
Membrane Potential
Ion | [Concentration outside the cell]o | [Concentration inside the cell]i |
K+ | 5mM | 140mM |
Na+ | 140mM | 12mM |
Cl- | 140mM | 10mM |
Using your knowledge of membrane potential physiology, calculate the equilibrium potential for each ion.
Note the following values:
F (Faraday’s constant) = 96540 C.mole-1 ; R (Ideal Gas Constant) = 8.31 J.deg-1mole-1 ;
T (absolute temperature) = 310 K (body temperature)
N.B. Shortcut – at this temperature, RT/F = 0.0267V (or 26.7mV). This can be worked out at the beginning to save time
Ion | Valence (Z) | Equilibrium potential (EM) (mV) |
K+ | +1 | -89mV |
Na+ | +1 | 66mV |
Cl- | -1 | 70mV |
Conductance
Ex = 26.7 x ln ((100x5) + (1x140) + (5x10) / (100x140) + (1x12) + (5x140))
Ex = -82mV
The resting membrane potential is most similar to K+. Because various ions have an impact on the equilibrium potential, it is different.
Synaptic Transmission
A new disease is discovered. Scientists have found that there are mutations in the protein machinery that tethers vesicles to ion channels that initiate neurotransmitter release.
Ca2+ ions
Influx of Ca2+ into the pre-synaptic terminal.
Neurotransmission release may be less effective if anchoring of the vesicle is compromised by mutations in the protein machinery (SNARE complex). This could result in a longer diffusion time of Ca2+. Moreover, injury to the SNARE complex may prevent the vesicle from travelling to the pre-synaptic terminal membrane, preventing ions from being neurotransmitted into the synaptic cleft.
The ‘tottering’ mouse is a spontaneously occurring mutant line of mice that has a wobbly gait, ataxia, and intermittent absence seizures. In 1996 it was discovered that this was due to a mutation in the Cav2.1 (a voltage gated calcium channel). Among other effects, this mutation leads to a change in the voltage dependence of the calcium channel, see below:
The graphic illustrates how neurotransmission release into the synaptic cleft is influenced by variations in the effectiveness of calcium release into the pre-synaptic terminal. The mouse is tottering because of a mutation that causes less ions and neurotransmitters to enter the synaptic cleft and takes a longer time to do so. This indicates that the cell is impaired or that the threshold has changed.
NMDA receptors have been described as nature’s coincidence detector.
Because glutamate and depolarisation are needed to release NDMAs from their magnesium block and allow them to flow calcium, which initiates long-term potentiation (LTP) of synaptic connections, NMDA is referred to as nature's coincidence detector.
You are performing electrical recording from a neuron in an underfunded lab, and you apply GABA. GABA changes the membrane potential of the cell, and you wonder whether this is due to GABA activating GABAA or GABAB receptors. You cannot afford antagonists to these receptors to give you a simple answer. However, the current-voltage relationship of the GABA-evoked currents look like this.
Since the current rise in the figure cannot occur with GABAa receptors, GABAb receptors must be involved.
The activity of the cell is impacted by GABAa receptors. GABAa's function is to restore the membrane potential to the Cl-equilibrium potential, also known as the resting membrane potential, if the cell is being affected by any other source of depolarisation. GABAa is known as the inhibitory neurotransmitter for this reason.
CHP207 – Week 7 Logbook entry
Pre-Lab Question/Task
The autonomic nervous system uses a two-neuron chain system to signal to effector tissues. Describe the two-neuron chain system, where each neuron is located, and how this system differs between the two divisions of the autonomic nervous system.
An essential component of the autonomic nervous system is the two-neuron chain system. It is composed of a preganglionic neurone that comes from the central nervous system and a postganglionic neurone that is located in a peripheral ganglion. The system's parasympathetic and sympathetic branches are distinct from one another. Preganglionic neurones are part of the sympathetic division and are found in the thoracolumbar region of the spinal cord. They interact with postganglionic neurones in sympathetic chain ganglia and prevertebral ganglia. In the parasympathetic division, preganglionic neurones are located in the nucleus of the sacral spinal cord or the cranial nerve, whereas postganglionic neurones are found in the ganglia of the cranial nerve or the sacral ganglia near the target organs. These ganglia are arranged to represent the distribution and innervation patterns of each body division.
Results
Table of skin conductance, skin temperature and heart rate during mental arithmetic (a mild stress).
Baseline Values | Stress | Recovery | ||||||||
Skin cond. (mV) | Skin temp. (°C) | Heart rate (bpm) | Skin cond. (mV) | Skin temp. (°C) | Heart rate (bpm) | Skin cond. (mV) | Skin temp. (°C) | Heart rate (bpm) | ||
-1.459 | 30.128 | 93.669 | -1.564 | 30.0216 | 93.815 | -1.461 | 30.0863 | 62.2978 | ||
-1.672 | 29.9956 | 94.248 | ||||||||
-1.666 | 29.9782 | 98.146 | ||||||||
-1.698 | 29.9558 | 96.382 | ||||||||
-1.716 | 29.9297 | 74.350 | ||||||||
-1.749 | 29.9191 | 84.558 | ||||||||
-1.753 | 29.9172 | 92.355 | ||||||||
-1.701 | 29.957 | 88.363 | ||||||||
-1.622 | 29.984 | 76.258 | ||||||||
-1.614 | 30.0114 | 71.017 | ||||||||
Mean | Mean | Mean | Mean | Mean | Mean | Mean | Mean | Mean | ||
-1.459 | 30.128 | 93.669 | -1.676 | 29.967 | 86.949 | -1.461 | 30.0863 | 62.2978 | ||
Questions
Answer the following questions with reference to the data set collected in class:
Skin conductance: As stress has persisted, conductance has been demonstrated to continuously decline.
Skin temperature: The findings indicate that, during stress, skin temperature drops relatively slightly. It appears that your skin temperature is lower than that of a healthy adult based on average.
Heart rate: It is difficult to interpret the results of heart rate because they are erratic. The adult average resting heart rate ranges from 60 to 100 beats per minute, with a mean of 86.949 beats per minute.
Stress primarily activates the sympathetic division of the autonomic nervous system. Stress causes the sympathetic branch to become active, which causes bodily responses that are similar to the "fight-or-flight" response. Norepinephrine is the primary neurotransmitter regulating this reaction. This reaction has been linked to a number of symptoms, such as elevated blood pressure, dilated pupils, elevated heart rate, heightened attentiveness, nervousness, jitteriness, and increased sweating.
After a stressful event, the parasympathetic nervous system is triggered during recuperation. Acetylcholine is the primary neurotransmitter that regulates this reaction. The primary signs of this are reduced blood pressure and heart rate, constricted pupils, tranquilly, and enhanced salivation and digestive abilities. Based on our findings, the only thing that truly supports this is the lower mean heart rate during the recovery and stress tests.
CHP207 – Week 8 Logbook entry
Pre-Lab Question/Task
Write a paragraph in your lab book defining the components of a typical electrocardiogram trace in particular what cardiac events produce the typical waves we see on an ECG. Explain what the ECG tells you about the electrical activity of the heart.
Differentiating waves that represent different heart events make up an electrocardiogram (ECG) trace. Atrial depolarisation, or the P wave, indicates that the atria have contracted. The QRS complex, which is associated with ventricular depolarisation, displays the ventricles' contraction. Ventricular repolarization, or the T wave, signifies that the ventricles have relaxed and reset.
When combined, these waves provide information on the heart's electrical activity. The ECG is used to assess the heart's overall cardiac health as well as its rhythm and speed. Anatomical abnormalities, aberrant conduction routes, cardiac ischemia, irregular heart rhythms (arrhythmias), and electrolyte imbalances are among the defects that it can detect.
By examining the ECG waveform, medical professionals can detect various heart issues and monitor the effectiveness of therapy. The electrocardiogram (ECG) is a valuable diagnostic and therapeutic tool for determining the electrical activity of the heart.
Results
Your two ECG traces (normal and electrodes swapped) go here:
Questions
Using your ECG traces, answer the following:
Lead 1 from the original test and the one after the electrodes were switched exhibit exactly the same length in the peaks; however, the graph shows the peaks moving downhill as opposed to upward. This is because the electrodes that were utilised to record the signal caused a shift in the electrical vector's direction. A particular direction or angle of the heart's electrical activity is shown by each lead in an ECG. The results of the two tests' leads 2 and 3 are entirely different.
Big positive spike
Negative spike with the peaks going downwards
Would be the flattest.
No, estimating the QRS axis based only on one complex is insufficient. This is due to the fact that the QRS represents the general direction of ventricular depolarisation in the heart, and it is frequently examined using a number of leads to obtain a more accurate approximation.
Lead 1 can, however, provide an estimate that may indicate the QRS complex is somewhere between 0 and 90º if it is primarily positive.
Use the relative heights (in mm) of the two largest positive QRS wave deflections (often lead I and lead III work best) waves to determine your QRS axis. You can use chart paper to do this or the print-out of the cardiac axis provided. Please make sure you add the chart paper should to your log book if you decide to use it.
45º
CHP207 – Week 9 Logbook entry
Pre-Lab Question/Task
Write a short paragraph in your lab book outlining exactly when during a cardiac cycle systolic and diastolic blood pressure are measured. Explain whether you can have a change in systolic blood pressure independent of a change in diastolic blood pressure.
Systolic blood pressure is measured at the systolic phase, which coincides with the ventricles contracting. When the heart pumps blood into the bloodstream, it generates the greatest pressure possible. Diastolic blood pressure is determined during the diastolic phase, which occurs when the heart relaxes and fills with blood in between heartbeats. The diastolic blood pressure indicates the lowest arterial pressure during this period of rest.
Changes in diastolic blood pressure are not always accompanied by changes in systolic blood pressure. For example, systolic blood pressure tends to rise sharply during exercise or physical activity because of the increased cardiac output and peripheral resistance. However, diastolic blood pressure may see a little change or even a slight decrease as a result of vasodilation in certain blood arteries.
Results and Questions
Experiment 1: Impact of site of measurement on blood pressure recordings
Systolic Blood pressure (mmHg) | Diastolic Blood pressure (mmHg) | Heart rate (bpm) | |
Automatic blood pressure monitor on the upper arm | 112 | 66 | 53 |
Automatic blood pressure monitor on the lower arm (forearm) | 98 | 74 | 54 |
Automatic blood pressure monitor on the lower leg (calf) | 152 | 109 | 58 |
Systolic Blood pressure (mmHg) | Diastolic Blood pressure (mmHg) | Mean arterial pressure (MAP) | |
Automatic blood pressure monitor on the upper arm | 112 | 66 | 81.3 |
Q1. Was blood pressure similar or different between the different sites? If it was different, why is this the case?
They're not the same.
More muscle is required to combat the high pressure in the calf (squeezing both the arteries and the muscle).
Because the arm is farther from the heart, there is less pressure there.
Experiment 2: Effects of exercise on blood pressure and heart rate
Event | Systolic pressure (mmHg) | Diastolic pressure (mmHg) | Heart rate (bpm) | MAP |
Rest 1 (2min) | 112 | 75 | 58 | 87.3 |
Rest 2 (4min) | 110 | 68 | 54 | 82 |
Post-exercise 1 | 147 | 70 | 91 | 95.6 |
Post-exercise 2 | 128 | 71 | 64 | 90 |
Post-exercise 3 | 119 | 69 | 70 | 85.6 |
Post-exercise 4 | 115 | 65 | 66 | 81.6 |
Post-exercise 5 | 117 | 67 | 68 | 83.6 |
Task: Draw graphs of the systolic blood pressure and heart rate as they change over time using the axes provided below.
Q1. Explain whether the following increased or decreased during exercise and include a brief explanation as to why/what is driving the change:
Exercise raised the systolic blood pressure. The need for more blood flow to the muscles during exercise in order to supply oxygen and eliminate waste products like lactic acid increases the muscles' demand for oxygen. Because of this, the heart pumps blood more forcefully and with greater volume during exercise, which raises blood pressure levels.
Exercise also causes an increase in heart rate. As previously explained, increased heart rate results from the heart having to work harder to supply the body with the increased blood flow and oxygen distribution that exercise requires.
Exercise causes a rise in mean arterial blood pressure. Activation of the sympathetic nervous system during exercise results in the release of chemicals like adrenaline, which promotes vasoconstriction and reroutes blood flow. This raises MAP together with the increased cardiac output that comes with exercise.
Q2. How does the magnitude of the change in mean arterial blood pressure compare to the change in systolic blood pressure from rest to the first measurement after exercise (i.e., rest vs post-exercise 1)? If there is a difference in the change, make sure you try and explain why this is the case.
Generally speaking, the change in systolic blood pressure is larger than that of MAPs. Exercise causes an increase in peripheral resistance and an increased cardiac output, which results in a more visible rise in systolic blood pressure. Therefore, the difference between the resting systolic blood pressure and the first post-exercise measurement is usually greater than the difference between the resting MAP and the first post-exercise measurement.
CHP207 – Week 10 Logbook entry
Pre-Lab Question/Task
Describe the main physiological mechanisms that comprise the dive response.
Holding one's breath while immersed is known as the "diving response". Similar to what happens when one submerges their head in water, the body senses when breath is being retained and responds by slowing the heart rate through the parasympathetic nervous system. The parasympathetic nervous system becomes more active and releases more acetylcholine when one is in touch with water, in addition to the heart rate decreasing when one is holding their breath underwater. The presence of cold and wet water can be detected by a number of receptors on the face, which further activates the PNS and decreases heart rate.
The diving reaction gets its name from the three primary physiological changes that result from this interaction during aquatic submersion: bradycardia, increased peripheral vascular resistance, and apnea. When combined, these physiological changes reduce the strain on the heart and redirect the body's oxygen supply to vital organs, such as the brain, allowing them to operate normally even in submerged conditions.
Results and Questions
Part A: Impact of breath hold on heart rate and blood flow
Event/Time (sec) | Heart Rate | Finger pulse amplitude |
Baseline 1 (2min) | 75.23 | 30.74 |
Baseline 2 (4min) | 73.84 | 29.07 |
Breath hold (15sec) | 84.60 | 29.17 |
Breath hold (30sec) | 74.26 | 32.29 |
Breath hold (60sec) | - | - |
30sec after breath hold | 67.52 | 40.85 |
Describe the patterns in heart rate and peripheral blood flow you observed.
Heart rate was revealed to have increased throughout the breath hold compared to the baseline. After the breath hold is over, it is seen to drop once more. It is difficult to interpret the results because the finger pulse measurements are aberrant.
Consider this experimental design – what is the value of determining the effect of breath holding on heart rate?
It makes important knowledge about the cardiovascular system, neurotransmitter response, and brain function possible. This covers how the autonomic nervous system operates. Understanding human limitations, the need for gas exchange between oxygen and carbon dioxide, and the importance of blood flow in the human body can all be greatly aided by this.
Part B: Impact of dive response on heart rate and blood flow
Event/Time (sec) | Heart Rate | Finger pulse amplitude |
Baseline 1 (2min) | 60.98 | 19.36 |
Baseline 2 (4min) | 73.56 | 19.69 |
Breath hold (15sec) | 112 | 46.15 |
Breath hold (30sec) | 104 | 50.77 |
Breath hold (60sec) | - | - |
30sec after breath hold | 69.73 | 35.96 |
Describe the patterns in heart rate and peripheral blood flow you observed.
Between the average baseline and breath hold underwater, there was a markedly anomalous increase in both heart rate and finger pulse amplitude. Following the breath hold, both variables also appeared to have sharply reduced.
How did heart rate and blood flow changes in the cold water dive compare with the breath hold only?
Compared to a regular breath hold, the underwater breath hold produced higher heart rate rates. This is highly unusual since the parasympathetic nervous system was more strongly stimulated by the receptors on the face that sensed the cold and moisture, which meant that the heart rate should have decreased rather than risen.
CHP207 – Week 11 Logbook entry
Pre-Lab Question/Task
Briefly describe the concept of renal clearance (you will have to research this on your own!)
Renal clearance is a concept used to evaluate and measure the degree to which a substance is eliminated from the bloodstream by the kidneys. It is defined as the volume of plasma from which a chemical is completely removed in a specified length of time. Renal clearance provides crucial information on the kidneys' ability to eliminate different solutes from the bloodstream, including waste materials, medications, and other solutes. Moreover, during the procedure, the renal tubules are utilised for secretion, reabsorption, and filtering.
C = (U x V) / P
Problems and Questions
Objective – to illustrate the independence of inulin clearance from the concentration of inulin in plasma and the rate of urine flow.
Using the following data calculate the inulin clearance and indicate the units for clearance.
Urine flow (mL/min) | Plasma inulin concentration (mg/mL) | Urine inulin concentration (mg/mL) | Inulin clearance ( ) |
A | |||
1.2 | 0.8 | 45 | 67.5 |
1.3 | 1.4 | 68 | 63.1 |
1.0 | 2.4 | 141 | 58.8 |
1.4 | 3.8 | 168 | 61.9 |
1.2 | 5.7 | 294 | 61.9 |
B | |||
1.3 | 0.5 | 23 | 59.8 |
2.1 | 0.5 | 17 | 71.4 |
3.1 | 0.4 | 8 | 49.6 |
5.7 | 0.5 | 5 | 57 |
6.6 | 0.5 | 5 | 66 |
The concentration of inulin in plasma increases with the amount of inulin in the urine. This is because the rising plasma level of inulin causes more of it to be easily filtered in the glomerulus. The increasing substrate suggests that more is flowing into the urine even while GFR stays same.
As the rate of urine flow increases, the amount of inulin in the urine decreases. Because of the stability of inulin's plasma concentration, the amount of inulin filtered remains relatively constant. Because the pee flow rate is increasing but nothing else is, there will be a higher dilution factor and a corresponding lower concentration of inulin in the urine.
Objective – to demonstrate the concept of steady state. When a person is in steady state the output of a given substance is equal to the input of that substance.
In the following study, inulin was infused into the antecubital vein of a healthy student volunteer whose GFR was 120 mL/min. The inulin was infused at a steady rate of 72 mg/min and periodically blood was withdrawn for determination of the plasma inulin concentration (Pin).
Elapsed time (min) | Rate of inulin infusion (mg/min) | GFR (mL/min) | Pin (mg/mL) | Urinary excretion of inulin (mg/min) |
1 | 72 | 120 | 0.005 | 0.6 |
5 | 72 | 120 | 0.02 | 2.4 |
10 | 72 | 120 | 0.05 | 6 |
50 | 72 | 120 | 0.24 | 28.8 |
100 | 72 | 120 | 0.47 | 56.4 |
110 | 72 | 120 | 0.6 | 72 |
120 | 72 | 120 | 0.6 | 72 |
It would be predicted that the plasma concentrations would be 0 g/mL.
The body excretes inulin at a slower rate (output) than it infuses it (input) up until 110 minutes. Thus, until 110 minutes have elapsed, and the excretion rate reaches the infusion rate, the plasma concentration increases.
The increase in plasma insulin levels stops around 110 minutes. This is because the excretion rate has increased to 72 mg/min in order to match the infusion rate of 72 mg/min. This refers to the steady state concentration.
Objective – to illustrate that the clearance of creatinine can be used as well as the clearance of inulin to estimate GFR.
The following data was collected from a patient over the course of 24 hours.
Urine flow (mL/min) | Pin (mg/dL) | Uin (mg/dL) | Clearance ( ) | Pcr (mg/dL) | Ucr (mg/dL) | Clearance ( ) |
1.0 | 102 | 5076 | 13.1 | 673 | 51.4 | |
1.1 | 104 | 4601 | 14.0 | 630 | 49.4 | |
0.9 | 106 | 6017 | 15.5 | 890 | 51.7 | |
1.0 | 107 | 5137 | 16.0 | 792 | 49.5 |
Using the data given, calculate the inulin and creatinine clearances. Supply the appropriate units for clearance.
The most accurate measure of GFR would come from inulin, as it is only filtered in the glomerulus and is neither secreted nor reabsorbed throughout the tubules. Because creatine might be released along the tubule, the amount does not exactly reflect the amount filtered by the kidneys.
One advantage of using creatine is that it is naturally found in the blood and that these levels stay rather constant over time.
Elevated levels of plasma creatine indicate a malfunctioning GFR that is filtering less substrate. More creatine remains in the blood as a result of the rate of creatine removal slowing down.
Another explanation for the elevated plasma creatine levels could be an increase in creatine production to the point that it outpaces the rate of excretion. To counter this, excretion rates would also need to increase.
CHP207 – Week 12 Logbook entry
Pre-Lab Question/Task
Identify where ADH acts on the nephron and describe how it regulates water permeability at this site. What would be the status of ADH in a dehydrated person versus well hydrated person?
The kidney's collecting ducts are home to ADH, which controls water permeability. Its purpose is to improve water permeability by facilitating the reabsorption of water from the urine and back into the bloodstream while also allowing the urine to become more concentrated.
More ADH is generated in a dehydrated individual in order to increase the amount of water that is drawn from the urine and reabsorbed into the bloodstream. This aids in controlling urine concentration and the body's water balance.
Results and Questions
Renal Practical - RESULTS
Group Members:
Table 1: Results for control subject (drinks no water)
Sample | 1 | 2 | 3 | 4 | 5 | 6 |
Time (min) | 0 | 20 | 40 | 60 | 90 | 120 |
Time elapsed from last sample (min) | 0 | 20 | 20 | 20 | 30 | 30 |
Volume (v: ml) | 205 | 25 | 15 | 15 | 17 | 19 |
Rate of excretion of urine (V: ml/min) | - | 1.25 | 0.75 | 0.75 | 0.57 | 0.63 |
Specific gravity (x) | 0.017 | 0.015 | 0.017 | 0.015 | 0.019 | 0.02 |
Urine osmolarity (mOsm/L) | 540 | 480 | 540 | 480 | 610 | 640 |
[Na+] (mmol/L) | 83 | 41 | 74 | 65 | 79 | 91 |
[K+] (mmol/L) | 64 | 43 | 61 | 58 | 79 | 80 |
Rate of excretion of Na (μmol/L) | - | 2050 | 3700 | 3250 | 2633 | 3033 |
Rate of excretion of K (μmol/L) | - | 2150 | 3050 | 2900 | 2633 | 2667 |
Table 2: Results for test subject (drinks 1 L of water)
Sample | 1 | 2 | 3 | 4 | 5 | 6 |
Time (min) | 0 | 20 | 40 | 60 | 90 | 120 |
Time elapsed from last sample (min) | 0 | 20 | 20 | 20 | 30 | 30 |
Volume (v: ml) | 52 | 18 | 34 | 200 | 345 | 295 |
Rate of excretion of urine (V: ml/min) | - | 0.9 | 1.7 | 10 | 11.5 | 9.83 |
Specific gravity (x) | - | - | - | - | - | - |
Urine osmolarity (mOsm/L) | 1010 | 775 | 470 | 315 | 285 | 315 |
[Na+] (mmol/L) | 93 | 41 | 14 | 5 | 2 | 2 |
[K+] (mmol/L) | 67 | 43 | 19 | 8 | 8 | 11 |
Rate of excretion of Na (μmol/L) | - | 2050 | 700 | 250 | 70 | 70 |
Rate of excretion of K (μmol/L) | - | 2150 | 950 | 400 | 270 | 370 |
Questions:
1.04mL/min x 1.5L per 24 hours
Because of this, at the start of the trial, the 'test' individual produced 0.9 mL/min of urine for the first 20 minutes, compared to 1.25 mL/min for the 'control' participant.
The expected osmolarity, on average, is around 275 mOsm/L. The control individual had urine with an osmolarity of 540 mOsm/L at the start of the experiment, while the test patient had 1010 mOsm/L. At this time, it goes much beyond what was anticipated.
This indicates that at the start of the trial, the urine outputs of the test group and the control group were strikingly similar. Both groups' urine output values were in close range of the average and were indicative of a normal water balance. Both the test subject and the control group exhibited elevated urine osmolarities in comparison. The test subject displayed mild dehydration, which might have been attributed to variations in their pre-experiment water intake and morning foods.
Use the data you collect in the above tables to plot a graph of your results in the space below. For both control and test subjects plot the rate of sodium and potassium excretion against time on one graph and the rate of urine excretion against time on another graph. Use the graphs to answer the following questions. If you prefer using excel, you are welcome to plot this data in excel and replace the graphs below with the excel generated graphs.
Rate of sodium and potassium excretion against time
Questions:
The control subject's urine output decreases over the course of two hours, starting at 1.25 mL/min and ending at 0.63 mL/min. On the other hand, after 90 minutes, the test subject's urine excretion rate increased to a maximum of 11.50 mL/min.
When the urine production increased from 34 to 200 mL and the excretion rate from 1.7 to 10 mL/min at the 60-minute mark, the diuresis was first observed. The increase in pee flow, which indicates diuresis, highlights the massive amount of fluid/water in the urine.
ADH stimulates urine production when it is absent. The blood's decreasing osmolarity stimulates the pituitary gland to reduce or stop secreting ADH. ADH encourages the collecting tubule to reabsorb water when the body has too much of it. ADH release is slowed because the body does not want to reabsorb all of this water, which causes less water to be reabsorbed and more water to be in the urine.
A decrease in blood asmolarity is detected by asmoreceptors in the hypothalamus and carotid artery, and an increase in blood volume is detected by baroreceptors in the carotid sinus and aortic arch. These subsequently have an impact on the pituitary gland's release of ADH.
At the onset of the experiment, the control participant's ADH levels would have been somewhat normal. As the experiment went on and they kept urinating, the body's water levels would have begun to drop. To maintain water homoeostasis, the body would have increased plasma levels, increased ADH secretion from the pituitary gland, and increased water reabsorption in the collecting tubule. This is noticeable when the urine volume dramatically decreases from 205 mL to 25 mL and 15 mL, respectively, at approximately the 20 to 40 minute mark.
The control individual would have had somewhat normal ADH levels at the start of the investigation. The body's water content would have started to decrease as the experiment continued and they continued to urinate. The body would have higher plasma levels, more pituitary gland release of ADH, and higher water reabsorption in the collecting tubule in order to preserve water homoeostasis. This is apparent at about the 20 to 40 minute mark, when the urine volume drops substantially from 205 mL to 25 mL and 15 mL, respectively.
CHP207 – Week 13 Logbook entry
Pre-Lab Question/Task
What are the three main systems/mechanisms that help regulate pH status in the body. Explain the time-course of when each his activated in response to a pH change.
The body uses three different ways to maintain pH: the buffer system, respiratory control, and renal compensation. The initial line of defence in the event of a pH shift is the buffer system, which kicks in immediately and stabilises the pH by releasing hydrogen ions to neutralise it. If the pH shift continues, respiratory control controls the depth and rate of breathing, which controls the blood's CO2 levels. Chemoreceptors trigger this reaction, regulating breathing's respiratory effort to assist in bringing pH levels back to normal. The lengthy process of renal compensation maintains pH values in the urine by controlling the concentration of hydrogen and bicarbonate ions.
Questions and problems
Question 1. Classify the acid-base disorders from the arterial blood values for each of the following scenarios and provide the primary cause and compensatory processes.
pH (7.35-7.45) | pCO2 (35-45mmHg) | HCO3- (22-32mM) | |
a) | 7.32 | 28 | 14 |
b) | 7.47 | 20 | 14 |
c) | 7.51 | 49 | 38 |
d) | 7.70 | 15 | 18 |
e) | 7.20 | 40 | 14 |
a) Metabolic acidosis with respiratory compensation
b) Respiratory alkalosis with metabolic compensation
c) Metabolic alkalosis with respiratory compensation
d) Respiratory alkalosis with metabolic compensation
e) Mixed metabolic and respiratory acidosis
Case scenario
Steve is 35-years-old and has Type 1 Diabetes. Steve is found unconscious at home by his wife and is brought into hospital via ambulance. His wife is unsure of exactly how much insulin he’d been taking recently, but she thinks he may have cut back a bit due to his very poor appetite over the last few days. He is clinically dehydrated.
Arterial blood and gas analysis shows:
pH 7.20 (7.35-7.45)
paCO2 20 mmHg (35-45 mmHg)
HCO3- 14 mmol/L (22-32 mmol/L)
Na+ 140 mmol/L (135-145 mmol/L)
K+ 5.9 mmol/L (3.5-5.2 mmol/L)
Cl- 97 mmol/L (95-110 mmol/L)
Glucose 35 mmol/L (4.0-6.0 mmol/L)
Lactate 1.2 mmol/L (<2 mmol/L)
Urinalysis is positive for glucose and ketones.
Question 1
Primary metabolic acidosis with respiratory compensation
The main reason for this disruption is the drop in blood bicarbonate ions.
Question 2
Explain the physiological defence mechanisms that would be activated and working to correct the acid base disorder in Steve’s body.
The kidneys repair this by utilising CO2 and H20 from the blood to synthesise HCO3- and eliminating the excess H+ in the urine. This will cause the pH to rise.
Question 3
With reference to renal physiology, explain how type 1 diabetes alters ECF potassium (K+) levels:
Acidosis, which results in excess K+ leaving cells and entering them instead, is a condition that affects people with type 1 diabetes who are not making insulin. The person and blood become hyperkalemic as a result.
Over time, the body will begin to release aldosterone, which lowers blood K+ levels by stimulating K+ excretion and Na+ reabsorption. More K+ is being flushed out as a result of a constant concentration gradient between the cells and the tubules as well as a high tubular flow. Elevated secretion can be attributed to elevated substrate levels, increased basolateral pump activity, and high plasma K+ concentration. Thus, the sum of these three pathways results in a decrease in blood K+ levels and an increase in urine K+ levels.
Scenario 2
A few days later, Steve is brought into hospital via ambulance because his condition has deteriorated. His wife reports that he has a respiratory tract infection over the past four days and has been complaining about being short of breath. Arterial blood and gas analysis now shows:
pH 7.02 (7.35-7.45)
paCO2 40 mmHg (35-45 mmHg)
HCO3- 10 mmol/L (22-32 mmol/L)
Na+ 140 mmol/L (135-145 mmol/L)
K+ 5.9 mmol/L (3.5-5.2 mmol/L)
Cl- 97 mmol/L (95-110 mmol/L)
Glucose 35 mmol/L (4.0-6.0 mmol/L)
Lactate 1.2 mmol/L (<2 mmol/L)
Urinalysis is still positive for glucose and ketones.
Question 3
Classify the Steve’s acid base disorder in this scenario.
Metabolic Acidosis and respiratory acidosis
Comment on the pH and pCO2 in this case. How does the Steve’s acid base status differ from that seen in the first scenario above?
More HCO3-has dropped, pH has dropped even more, and pC02 has stabilised to normal levels. Although his pCO2 should be low, the fact that it is within normal ranges indicates that his body is not responding appropriately to the respiratory tract infection.
Does the normal pCO2 exclude a respiratory acid base disorder?
No. If he were attempting to counteract the metabolic acidosis, a low pC02 would be predicted, which suggests that he has a respiratory acid-based disease. This suggested that he has respiratory acidosis because it is not usual in a person with metabolic acidosis. His pH is being further lowered by this.