MRU - Supply, demand, and equilibrium
The demand curve
- What is a demand curve? A demand curve illustrates on a graph how much of a particular good or service people are willing to buy as its price changes.
- When the price for a good or service goes down, demand tends to increase. That’s why stores can look a little crazy on Black Friday: retailers cut prices to ensure that they’ll be “in the black” for the year and shoppers load up on presents for Christmas.
- On a graph, the demand curve slopes downward with prices indicated on the vertical axis and the quantity demanded on the horizontal axis. Every good or service has its own demand curve, but they function the same way.
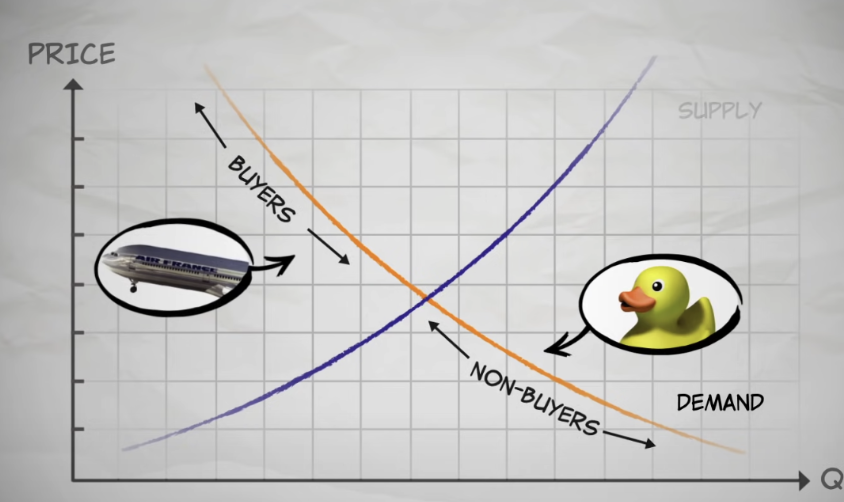
- Oil is a crucial good throughout the world, so let’s take a look at its demand curve. When the price for oil is high, let’s say $55 per barrel, the quantity demanded might be five million barrels. Oil has a lot of uses, but some of them are considered low-value and there are substitute goods available. So if the price of oil is on the high end, demand for these low-value uses will be lower.
- However, oil has a number of high-value uses without many substitutes. For example, planes requires oil for jet fuel. At that high price of $55 per barrel, you’re still going to need to pay up in order to fly a plane. But at that same price, drivers may opt to carpool, switch to a vehicle that can use ethanol or a hybrid car, or take fewer trips to avoid the high price of gas.
- When the price becomes too high, people will economize for the low value uses of a good. For example oil, when the price becomes high, it will only be used for fuel instead of toys (plastic). People will economize by buying wooden toys.
- Now, when oil drops to $20 or even $5 per barrel, many more barrels are demanded. Suddenly, it makes sense to use oil instead of finding substitute goods or economizing for oil’s low-value uses.
The supply curve
- Suppliers of a good change how much they supply as the price changes. And a supply curve shows us how much suppliers are willing to supply at different prices. There’s a supply curve for every good and service out there (just like with the demand curve).
- Supply curve: a function that shows the quantity supplied at different prices. Represents the behavior of sellers.
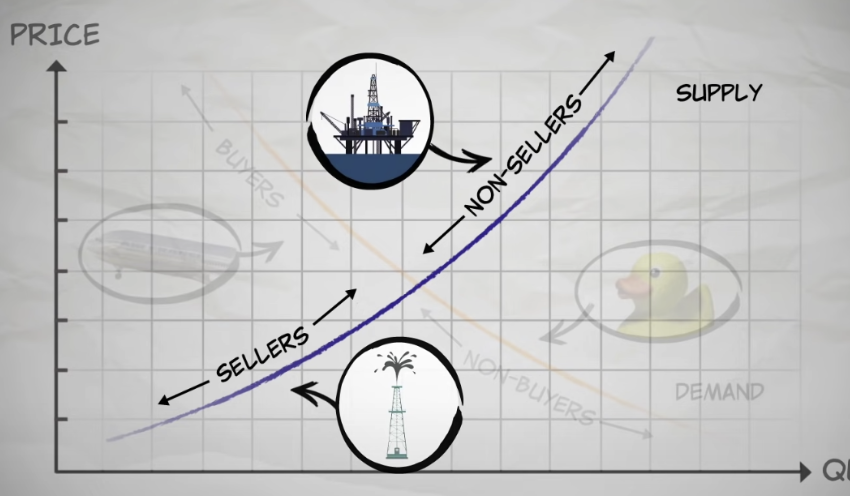
- Let’s take a look a the classic economic example of oil. As the price of oil increases, the quantity of oil that suppliers (in this case, oil companies) are willing to supply also increases. It’s a pretty intuitive relationship.
- But why is it the case that the higher the price, the more oil supplied?
- Oil is a global product. You can find it – and it’s used – all over the world. However, ease of extraction is not so global. In some places, like Saudi Arabia, it's easy, and therefore cheap, to get oil out of the ground. But Alaska? Not so much. Extraction requires drilling deep in the earth and the cost can be eight times as high as it is in Saudi Arabia. Oil rigs off the Gulf Coast have even higher extraction costs. They have to drop a mile underwater just to begin drilling.
- These varying extraction costs means that some suppliers can turn a profit even when the price of oil is relatively low. But many others cannot. However, when prices rise, it suddenly becomes profitable to drill in places like Alaska and the Gulf Coast.
- Starting to make sense? The supply curve slopes upward because, to increase the quantity of oil supplied, companies have to use higher cost sources. The supply curve for oil summarizes how oil companies respond to changes in cost per barrel. But the idea is essentially the same no matter the good or service and its suppliers.
The equilibrium price and quantity
- How are prices set in a market? The interactions of buyers (demand) and sellers (supply) determine the price of a good or service.
- The equilibrium price is the price where the quantity demanded is equal to the quantity supplied. That quantity is known as the equilibrium quantity.
- You can visualize the equilibrium price as a ball in bowl. The bowl can can be tipped and the ball will move, but it will find its way back to a stable place. The equilibrium price works that same way. At any other price, forces are put into play that will push the price back towards equilibrium.
- The first thing you need to understand about this process is how the competition works. Buyers are competing against other buyers and sellers are competing against other sellers. Buyers are not competing sellers.
- Buyers get the item by bidding at the highest price, while sellers sell at the lowest price to outcompete other sellers.
- Let’s examine how this works with oil. If oil is $50 per barrel, but the equilibrium price is $30 per barrel, what happens? Well, the quantity demanded is lower than the quantity supplied – there’s a surplus. Sellers can’t sell as much as they’d like at $50 per barrel, so they lower the price. And what happens to demand? It goes up! Eventually, the price reaches equilibrium and the quantity demanded equals the quantity supplied.
- When the price of oil is too low and the quantity demanded is higher than the quantity supplied, there’s a shortage. The correction process in this case works much the same way. Buyers compete by bidding up the price so that they can get more oil. Sellers have an incentive to raise the price so that, once again, price and quantity reaches equilibrium.
- At any specific price, there's a group of buyers who value a good enough to demand it at that price. As the price changes, so do the buyers and their uses.
- There will also always be a group of suppliers whose cost is low enough to be profitable at that price.
- The grain from trade is the difference between the buyer value and the seller cost.
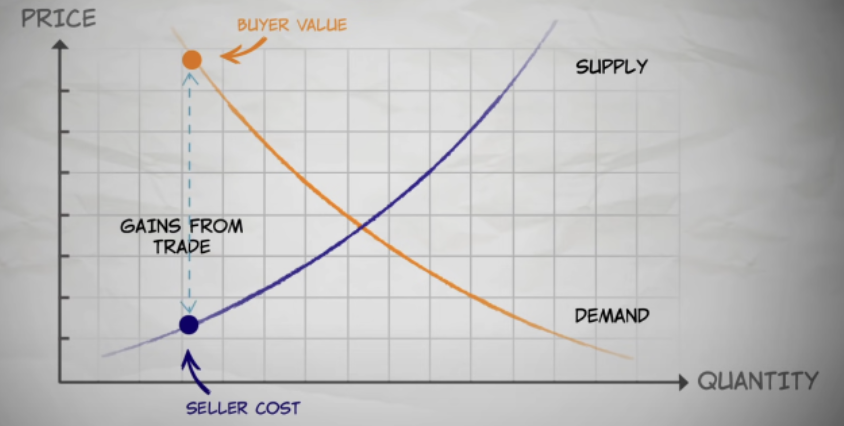
- on the other side, this would be waste
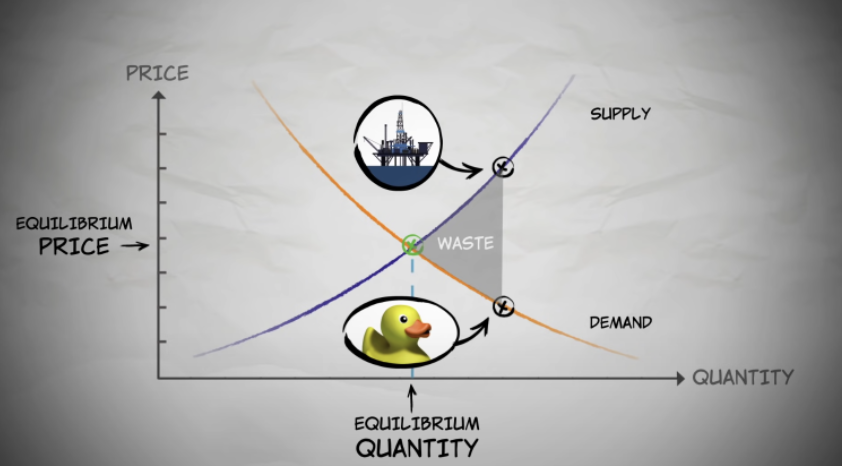
- Equilibrium: allocating goods to the highest value buyers from the lowest cost sellers that maximizes the gains from trade
- To recap, the only stable price is the equilibrium price. If the price is not at equilibrium, the actions of buyers and sellers will push the price back towards equilibrium.
Demand curve: shifts and consumer surplus
- Demand curves can be read in two ways:
- Horizontally: the quantity buyers are willing and able to purchase at a given price.
- Vertically: the maximum price that buyers are willing to pay for a given unit.
- Consumer surplus: the consumer's gain from exchange.
- The difference between the maximum price a consumer is willing to pay for a given quantity and the market price.
- Total consumer surplus: the sum of consumer surplus of all buyers. Graphically, it is measured by the area below the demand curve and above the price.
What shifts the demand curve?
- The demand curve shifts to the right during an increase in demand.
- Increase in the maximum willingness to pay for a given quantity.
- The same is true for the opposite.
- 5 factors change demand:
- Income: an increase in income increases demand
- Inferior goods: the higher the income, the lower the demand
- Normal goods: the higher the income, the higher the demand
- Population: the number of potential buyers changes. The population increases, so does the demand.
- Taste: influenced by tendencies.
- Related goods:
- Substitutes: two products that serve the same purpose, such as a hot dog and hamburguers.
- Complements: two products that are often used together, such as cereal and milk.
- Expectations: of market prices or market events.
- If people expect the price of a good to be higher in the future, quantity demanded will increase today.
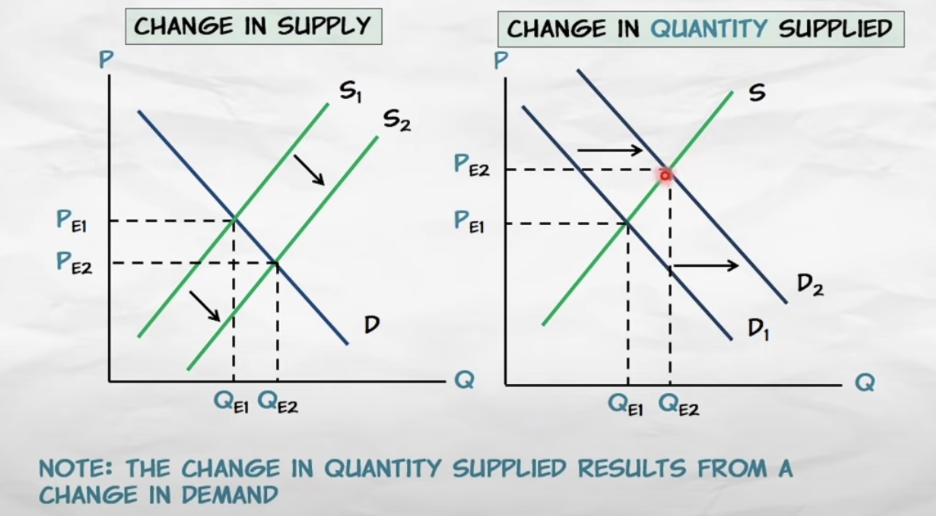
Change in demand vs change in quantity demanded
- Change in quantity demanded: movement along the curve.
- Caused by a change in the price.
- Change in demand: a shift in the demand curve.
- Cause by a change in one of the shifters of the supply curve.

Supply curve: shifts and producer surplus
- Supply curves can be read in two ways
- Horizontally: how much suppliers are willing and able to sell at a given price
- Vertically: the minimum price at which suppliers will sell a given quantity.
- Producer surplus: the producer's gian from exchange.
- The difference between the market price and the minimum price at which producers would be willing ot sell a given quantity
- total producer surplus: the sum of the producer surplus of each seler. The area above the supply curve and below the price.
- the supplier at the margin earns nothing.
What shifts the supply curve?
- An increase in supply shifts it downward to the right.
- The major reason the supply decreases is an increase in costs.
- 6 factors shift the supply curve:
- technological innovations: lowers costs, increases supply
- input prices: increases costs, decreases supply
- taxes and subsidies: taxes increase cost while subsidies decrease them
- expectations: the expectation of a higher price in the future increases the cost of supplying now and decreases current supply by storing it to sell later
- entry or exit of producers: entry implies more sellers, increasing supply
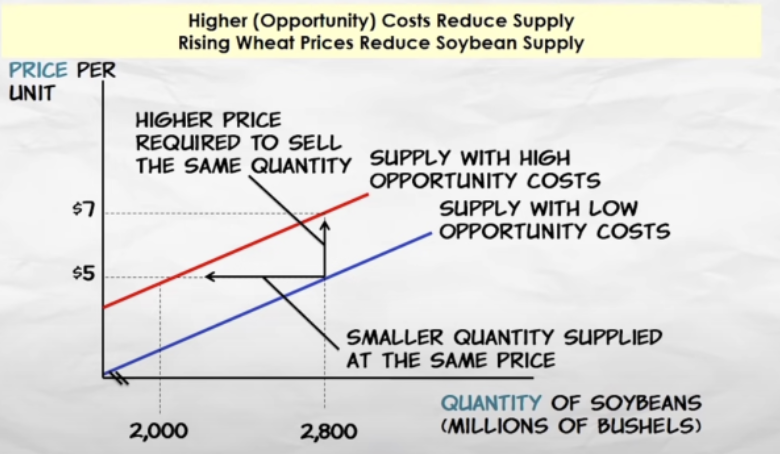
- changes in opportunity costs
- inputs used in production have opportunity costs, and sellers will choose to employ those imputs i nthe production of the highest priced final goods
Exploring equilibrium
- Unexploited gains from trade: deadweight loss. When the price is not at equilibrium
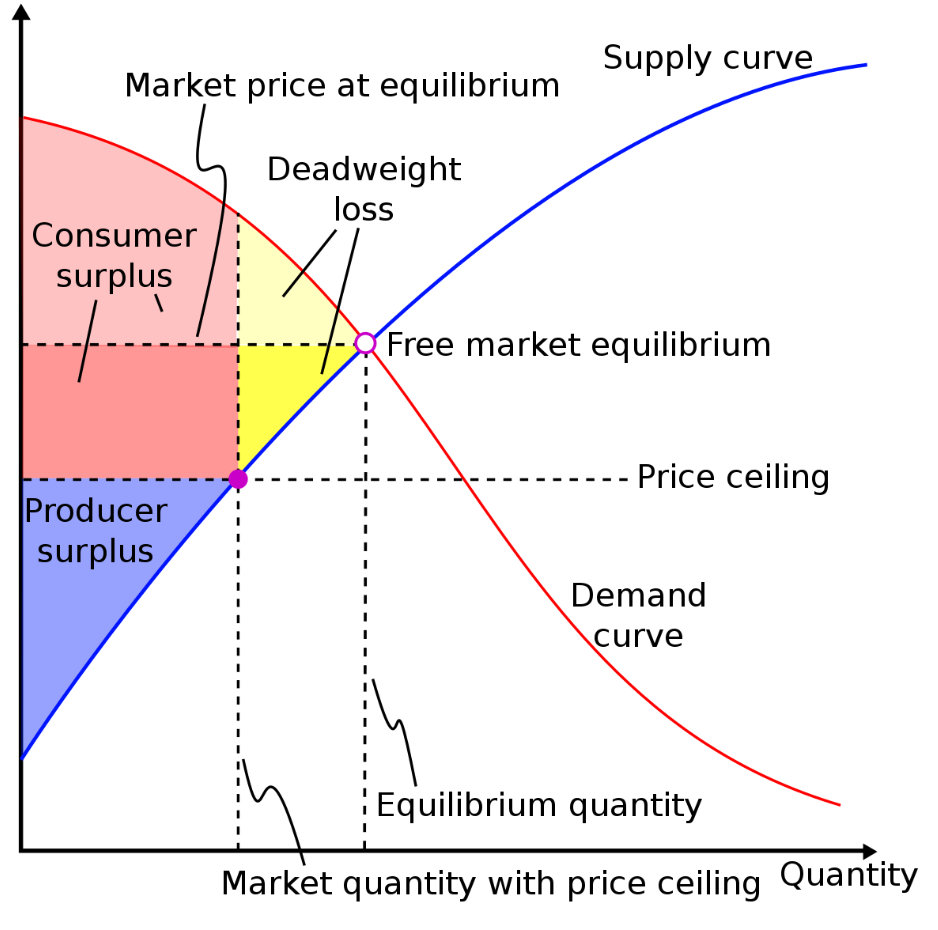
- At the other side there's waste.
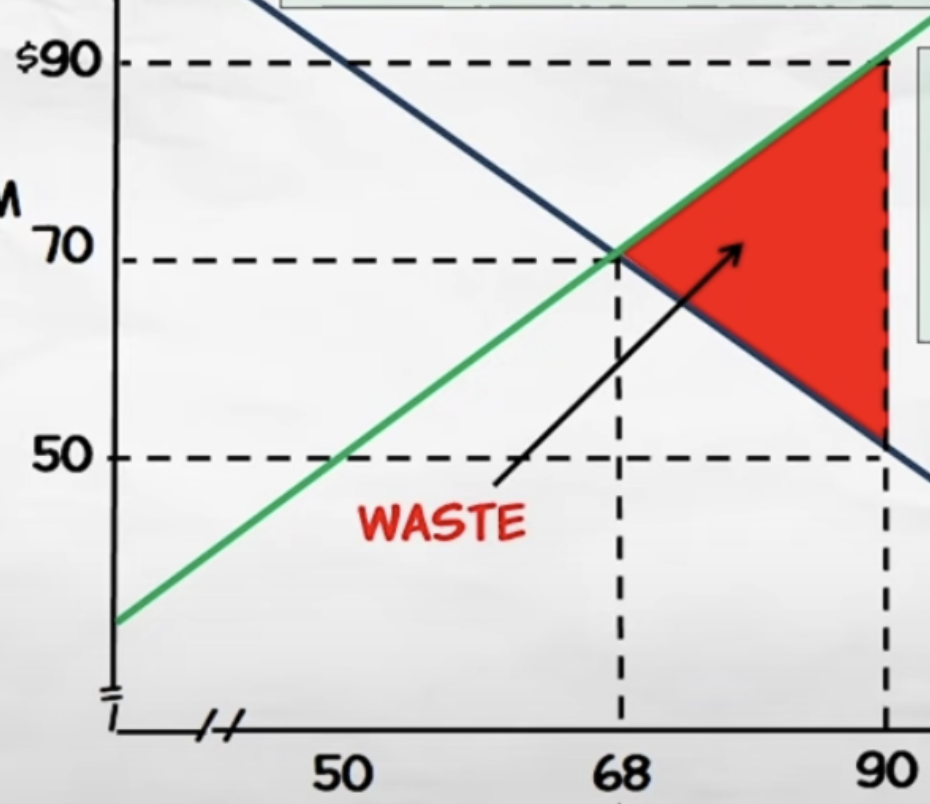
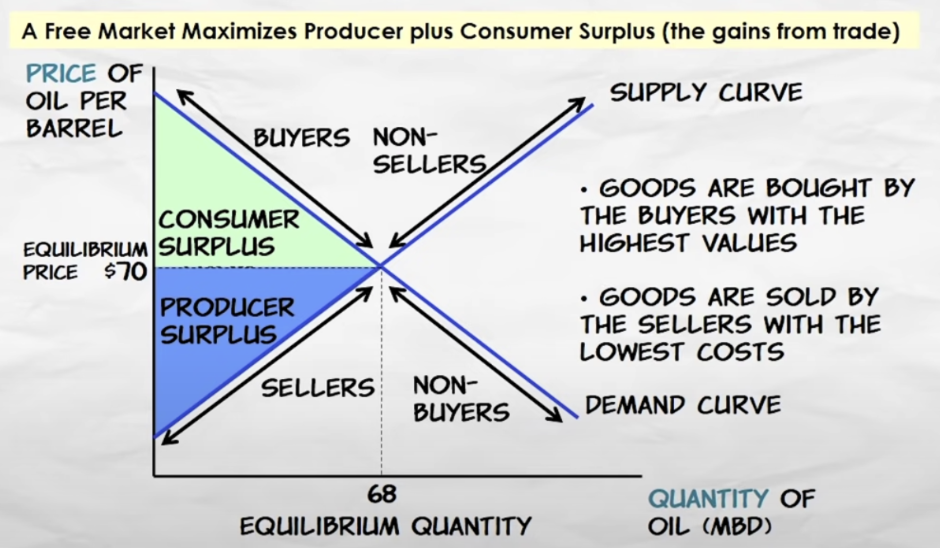
- A free market maximizes the gains from trade.
- the supply of goods is bought by buyers with the highest willingness to pay
- the supply of goods are sold by the sellers with the lowest costs.
- between the buyers and sellers, there are no unexploited gains from trade or any wasteful trades
Supply and demand terminology
- This video just repeats what is explained in the video "demand vs quantity demanded"