Unit 2
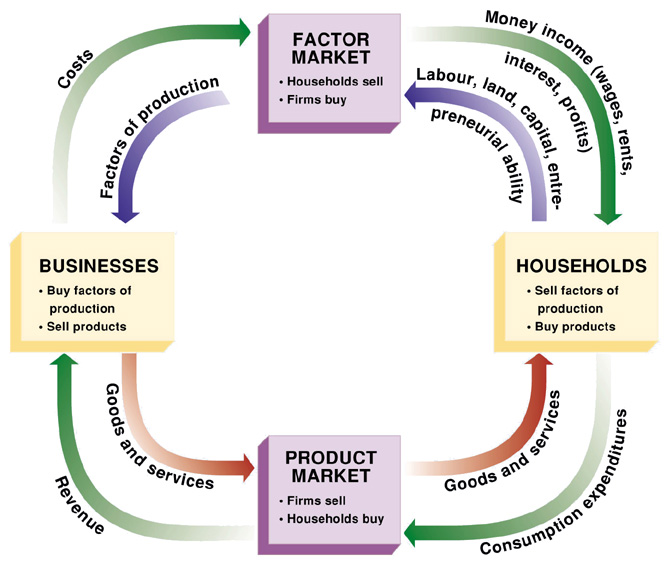
Circular-Flow Diagram
Simple model of macroeconomics representing inflows and outflows.
Contains households and firms
household - a person or group of people who share income
firm - an organization that produces goods and services for sale
Expanded Circular-Flow Diagram
inflow must equal outflow
government, households, firms, rest of the world
Gross Domestic Product (GDP)
GDP - total value of all final goods and services produced in the economy during a given year.
Three ways to calculate GDP:
value added approach - survey firms and add up their contributions to the value of final goods and services
expenditure approach - to add up aggregate spending on domestically produced final goods and services in the economy
consumer spending + investment spen + gov purchases + exports - imports
income approach - add up the total factor income earned by households from firms in the economy, including rent, wages, interest, and profit
IF IF U -
Intermediate goods/services
Financial assets and transfer payments
Inputs used in production
Foreign-produced goods and services
Used goods
aggregate output - the total quantity of final goods and services the economy produces.
real gdp - the total value of all final goods and services produced in the economy during a given year, calculated using the prices of a selected base year in order to remove the effects of price changes.
comes with information about what the base year is.
nominal gdp - gdp at current prices.
chain linking - the method of calculating changed in real GDP using the average between the growth rate calculated using an early base year and the growth rate calculated using a late base year.
adopted measure by u.s. national accounts
GDP per capita - GDP divided by the size of population; equivalent to the average GDP per person.
eliminates effect of differences in population size.
useful for comparison of labor productivity.
not sufficient measure of real gdp.
Unemployment
employment - people are currently holding a job in the economy, either full time or part time.
retired and disabled do not count
unemployment - people are actively looking for work but aren’t currently employed
unemployed considered to be “jobless, looking for jobs, available for work.”
labor force - equal to the sum of employed and unemployed.
labor force participation rate - percentage of population aged 16+ that is in the labor force.
labor force/population age 16+ x 100
unemployment rate - percentage of the total number of people in the labor force who are unemployed
# of unemployed workers/labor force x 100
estimated based on surveys sent to 60,000 american families
indicator of how difficult it is to find a job in the economy
Overstating and Understating Employment
Unemployment never falls to zero, despite many unemployed.
discouraged workers - nonworking people who are capable of working but have given up looking for a job due to the state of the job market.
understated unemployment because they were originally looking for jobs, but gave up
known as marginally attached - would like to be employed and have looked for a job in the recent past but are not currently looking for work.
marginally attached workers ended their job search for a reason other than belief that no job was available for them.
not included when calculating the unemployment rate.
underemployed - workers who would like to work more hours or who are overqualified for their jobs.
Job Creation and Destruction
structural changes in technology can result in job loss & creation.
ex: employment rise in high-tech industries because of the new technologies emerging.
Types of Unemployment
frictional unemployment - unemployment due to the time workers spend in job search.
workers lose a job and chose to not take the first new job offered.
always exist in the economy
job search - workers who spend time looking for employment.
structural unemployment - unemployment that results when workers lack the skills required for the available jobs, or there are more people seeking jobs in a labor market than there are jobs available at the current wage rate.
Wages - Money
minimum wage government mandated floor on the price of labor.
binded minimum wages are for less skilled workers
lead to structural unemployment
labor unions are organizations between workers to maintain or improve it
lead to structural employment
exercise bargaining power by threatening firms with a labor strike.
greater bargaining power = higher wages demanded
efficiency wages - wages that employers set above the equilibrium wage rate as an incentive for better employee performance.
natural rate of unemployment - unemployment rate that arises from the effects of frictional plus structural unemployment.
natural unemployment = frictional unemployment + structural unemployment
cyclical unemployment - the deviation of the actual rate of unemployment from the natural rate.
actual unemployment = natural unemployment + cyclical unemployment
unemployment rates are lower for experienced than low-skilled workers.
in result, their wages are higher than low skilled
Inflation
real wage - the wage rate divided by the price level to adjust for the effects of inflation or deflation
real income - income divided by the price level to adjust for the effects of inflation or deflation
inflation rate - the percentage increase in the overall level of prices per year
inflation rate = price level in year 2 - price level in year 1/ price level in year 1 × 100
shoe-leather costs - the increased costs of transactions caused by inflation
allusion to wear and tear caused by extra running around that takes place when people try to avoid holding money
menu cost - the real costs of changing listed prices
unit-of-account costs - arise from the way inflation makes money a less reliable unit of measurement
not useful because of inflation - worth of a dollar changes over time
effect of inflation on borrowers/lenders are nominal and real interest rates
nominal interest rates - the interest rate actually paid for a loan
real interest rate - the nominal interest rate minus the rate of inflation
inflation discourages from long-term contracts
disinflation - the process of bringing the inflation rate down
difficult an costly
Module 15
aggregate price level - measure of the overall level of prices in the economy.
price index - measures the cost of purchasing a given market basket in a given year. The index value is normalized so that it is equal to 100 in the selected base year.
price index in given year = cost of market basket in a given year/ cost of market basket in base year x 100
inflation rate = price index in year 2 - price index in year 1/price index in year 1 × 100
consumer price index - measures the cost of the market basket of a typical urban american family.
surveys sent to ifferent industries; food, housing, clothing, education, etc.
producer price index - measures the prices of goods and services purchased by producers.
regarded as warning sign
gdp deflator - 100 times the ratio of nominal gdp to real gdp in that year
onflation rises nonimal but not real