Geography
Geography in the study of the world around us. Studying geography helps us understand how the Earth works. Than includes natural processes such as volcanoes floods and the weather.
BOLTSS:
Border
Orientation
Legend
Title
Sourc
Scale
Skills Development in Geography
16-Point Compass
- Greater precision in directions
- Cardinal and intercardinal directions include:
- North (N)
- North-East (NE)
- East (E)
- South-East (SE)
- South (S)
- South-West (SW)
- West (W)
- North-West (NW)
- North-North-East (NNE)
- North-West-North (NNW)
- East-North-East (ENE)
- East-South-East (ESE)
- South-South-West (SSW)
- South-East-South (SES)
- West-South-West (WSW)
- West-North-West (WNW)
Compass Bearings
Understanding Bearings
- A compass consists of 360 degrees
- Bearings are more accurate than standard compass directions
- Defined as:
- An angle measured clockwise from north.
- Key bearings include:
- North: 0° or 360°
- South: 180°
- East: 90°
- West: 270°
- Other bearings:
- 45°, 135°, 225°, 315°, 22.5°, 67.5°, 112.5°, 157.5°, 202.5°, 247.5°, 292.5°, 337.5°
Guided Practice for Bearings
Measuring Bearings from a Map
- Steps to Measure Bearings:
1. Mark the north line at Point A
2. Draw a line from Point A to Point B
3. Measure the angle clockwise from the north line to Point B using a protractor
4. If the bearing exceeds 180°, adjust by adding to 180°
Independent Practice
Worksheet Completion
- Complete answers on compass directions and compass bearings with ruler and protractor
- Seek clarification from the teacher for mapping skills if needed
Concept Development in Coordinates
Types of Coordinates
- Area References (AR)
- A four-digit number representing a whole square where a feature exists on a map. Example: AR3854
- Grid References (GR)
- A six-digit number indicating a specific location.
- It includes the same first four digits as AR, needing a 3rd and a 6th digit. Example: GR382545
Guided Practice on Eastings and Northings
Understanding Eastings
- Eastings show how far East you are on a map.
- Displayed as numbers at the bottom of the grid (e.g. 47, 46, 45, 44, 30, 31, 32, 33)
- Each Easting corresponds to the column on the right of its line.Understanding Northings
- Northings show how far North you are on a map.
- Displayed as numbers at the side of the grid.
- Each Northing corresponds to the row above its line.
Reading Coordinates
Coordinate Reading Methodology
- Eastings before Northings (remember: “along the corridor and up the stairs”)
- Eastings: Vertical lines moving east
- Northings: Horizontal lines moving north
- Travel along the map bottom to the desired easting, then move up to reach the corresponding northing
- This leads to the feature's bottom left corner square
Understanding Longitude and Latitude
Using Longitude and Latitude
- Shown on the map using black and white lines marking minutes of latitude and longitude
- Example: Longitude coordinate at the map top - 146°46’E, progressing to 146°47’E at the white section's end
Geography Course Information and Context
Institution: Venberg Senior High School
Department: Humanities and Social Sciences
Subject: Geography (Year 8)
Topic: Scale and Distance
Associated Reference Points: * 10 Gray Peak * Mt Marcy: * Data Points: , , * Region: TIO Range
Concept Development: Map Scale
Definition: Maps are physically small compared to the geographical areas they depict. Consequently, scale is the tool used to shrink the real world so it fits onto a piece of paper.
Variability: The specific scale of a map is determined by the size of the real-world area being shown and the physical dimensions of the map surface.
The Three Types of Scales: * Written Scale (Verbal Scale): This provides a text-based description of how a map distance translates to ground distance. * Example: "One centimetre represents thirty kilometres." * Linear Scale: This is a numbered line that functions as a ruler on the map. * Example: If on this line is labeled as , it indicates the ground distance. * Ratio Scale (Representative Fraction): This expresses the scale in pure numbers without specific units. * Example: . * Explanation: This signifies that on the map equals of the same units on the ground. For instance, on the map represents . Since , it matches the previous examples.
Skill Development: Measurement Conversions
The standard output for map distance responses is kilometres ().
Maps may provide scales in centimetres () or metres (), requiring conversion skills.
Conversion Metrics: * *
Conversion Process: * To go from to : Multiply by (), then multiply by (). * To go from to : Divide by (to reach ), then divide by (to reach ).
Differentiation: Large-Scale and Small-Scale Maps
General Rule: The larger the scale, the higher the level of detail provided.
Large-Scale Maps: Show small areas in great detail. * Example: A map of a school on A4 paper. * Values: Scale of (Ratio ).
Small-Scale Maps: Show large areas with very little detail. * Example: A map of Australia on A4 paper. * Values: Scale of (Ratio ).
The Ratio Rule: Remember that the larger the ratio number, the smaller the scale of the map.
Visual Examples of Scale Variation (Atlanta Case Study): * Small Scale: (Ratio ). Shows the whole Southeast US/North Mexico. * Mid-Small Scale: (Ratio ). Shows regional context. * Mid-Large Scale: (Ratio ). Shows state-level detail. * Large Scale: (Ratio ). Shows city-level detail including local neighborhoods like Smyrna, Chamblee, Tucker, Mableton, Stone Mountain, Panthersville, and Forest Park.
Skill Development: Calculating Curved-Line Distance
Definition: Necessary for measuring actual travel distance along roads or footpaths, which rarely follow a straight line.
Procedure: 1. Use a piece of string or the edge of a piece of paper. 2. Follow the curves and corners of the path, marking the paper and pivoting it incrementally as the path changes direction. 3. This effectively converts a complex curve into a series of very short, interconnected straight lines. 4. Once the entire path is marked, lay the string or paper against the map's linear scale to determine the total real-world distance.
Guided Practice (Bunbury Topographic Map): * Measure distance: Coalfields Road (). * Measure distance: Boyanup Road West from to . * Measure distance: Leschenault Peninsula starting from Point Douro ().
Geographical Concepts
Introduction
Geographers use seven concepts to help investigate and understand the world. As you learn to use each of the key ideas you will begin to think like a geographer. At times you will use several of these at once, while at other times you may focus on just one. The seven key concepts in geography are:
1. Place
5. Environment
2. Space
6. Change
3. Sustainability
7. Scale
4. Interconnection
Place
Places are parts of the Earth's surface that are identified and given meaning by people. A place can be as small as your bedroom or as large as the entire planet! The life of every person and animal on Earth is influenced by place. Places can be natural (shaped by the environment and largely unchanged by humans) or built (constructed by humans). Places determine our relationships with one another (for example, our closest relationships are likely to be with people in the same place). The environmental and social qualities of a place also influence the way we live. Climate, landscapes, types of plants and resources, transport networks, entertainment venues and workplaces all have a major impact on the way we live. For Aboriginal and Torres Strait Islander peoples, Place also has a deeper spiritual meaning. For Aboriginal peoples, Place means the special places within Country. These can include places of ceremony, initiation, birth and learning, as well as places for Sorry Business. They also include landmarks related to the ancestor spirits and creation. For Torres Strait Islander peoples, Place refers to spaces that individuals or groups occupy and regard as their own, and they may have spiritual significance. These spaces include lands, waters and the sky.
Sustainability
The concept of sustainability relates to the ongoing capacity of Earth to maintain all life. To live sustainably, we must manage the Earth's resources so that they can be used to meet our own needs without depleting these resources for future generations.
Sustainability is an important concept for geographers. 'They use it to investigate how natural and human systems work, and to understand how resources can be managed in such a way that they will be sustained into the future. Many of the world's resources (such as oil, coal and natural gas) are non-renewable. This means that if we continue to use them they will run out one day. Other resources (such as wind, forests, solar and water) are renewable. This means that they replace themselves naturally, or can be replaced to meet the needs of society. Sustainability encourages us to think more closely about these different types of resources - the ways in which they are formed and the speed at which they are being used. It also encourages us to look more closely at renewable options and take greater care of the Earth. Actions to improve sustainability can operate at any scale: local, national, international or global.
Interconnection
No place or thing on Earth exists in isolation. All environments and every living and non-living thing in them are connected. These connections can be on a local or global level. Geographers use the concept of interconnection to better understand the complex links between natural and human processes that shape our Earth. Places and people can be linked through many different ways. These can be categorised as:
• Natural processes, such as the water cycle and
food chain
• Human activities, such as the movement of people,
the production and trade of goods, and the flow
of investment and money linked within and
between different countries.
Think of the Earth as a single living organism, much like the human body. Your brain, heart, lungs, stomach, arms and legs all work together as a single system to keep you alive and healthy. In much the same way, the Earth's living systems (such as climate, plants, animals, oceans, soils, atmosphere and energy) all function together and are interconnected. Even a slight rise in the Earth's temperature, for example, will affect the oceans (by damaging coral reefs and affecting fish populations and other sea creatures), the land (through failure of crops and drought) and the polar ice caps (by increasing sea levels and forcing millions of people to relocate their homes).
Environment
Our world is made up of many different environments. Some environments are natural (or physical) such as deserts, grasslands, mountains, coral reefs, forests, oceans and ice caps. For an environment to be considered natural, its soils, rocks, climate, plants and animals must remain largely untouched by humans. Today, there are very few truly natural environments left on Earth. Other environments have been so altered by humans that very few natural features remain. These environments are known as built (or human) environments and include large cities, towns, suburbs and vast areas of farmland. Human environments not only affect the natural features, but they also affect the climate. For example, a large city such as New York will often be a few degrees hotter than the surrounding areas because concrete in the buildings traps the Sun's heat. Most environments on Earth are now a combination of natural and human features. The study of different environments helps geographers to better understand and appreciate natural processes, such as how weather works, how mountains are formed and how rainforests and coral reefs grow. The concept helps geographers to analyse the changes humans make to natural environments and better appreciate their impacts, so they can be managed more wisely.
Change
Changes are constantly happening on Earth. Some changes occur very rapidly and are obvious, while others take place over millions of years and are almost undetectable to us. The concept of change helps us to understand what is happening around us and how the Earth has been shaped and changed by natural forces, such as climate, earthquakes, volcanoes, running water and storms. In more recent times, humans have shaped and changed the Earth to suit their own needs, but events such as volcanic eruptions and tsunamis are a reminder that powerful natural forces continue to alter the face of the Earth, regardless of what humans do.
Changes take place on many different levels, from personal and local right through to national and global. Small local changes that happen quickly, such as a tree falling over on your street, are often easy to observe and explain. Larger regional or national changes, such as an earthquake, can happen quickly and their effects can be widespread and have devastating impacts on places and people. Changes that take place on a global scale can take much longer.
Global warming, for example, is a long-term change that happens over centuries or decades. Its widespread effects are becoming clearer each year.
Observing and understanding natural and human-made changes is an important part of any geographical inquiry.
Geographers need to look at different types of changes, why they have occurred, over what time period they have occurred and what further changes may take place as a result. Sometimes changes can be positive, such as the conservation of plants and animals in national parks, while other changes can have negative consequences, such as the deforestation of native rainforests. Geographers play an important role in ensuring that change is managed in a sustainable way.
Scale
The concept of scale is used to guide geographical inquiries. Geographers study things that take place on many different spatial levels - from small areas (such as a local park) to very large areas (such as the use of oil and coal all over the world). They use the concept of scale to look for explanations and outcomes at these different levels. A geographical inquiry into the ways that people use parks, for example, may be carried out at a range of scales (from smallest to largest):
• local - such as an inquiry into the number of daily visitors to a neighbourhood
skate park
• regional - such as an inquiry into the types of visitors staying at campsites in the
Gariwerd (Grampians) region of Victoria
• national - such as an inquiry into the yearly tourist numbers visiting national parks Australia-wide
• international - such as an inquiry into animal poaching in national parks and wild game reserves in different countries across Africa
• global - such as an inquiry into the use of all marine parks around the world and their effectiveness in protecting different species of marine animals.
Geographical Skills
Introduction
Geographers look at the world around them, try to explain what they see, and look for ways to improve it. They aim to shape the world so that it is a better place for people and for the natural environment. To achieve these aims, they may undertake a geographical inquiry to explore an event, issue or challenge. To solve problems through inquiry, geographers need a wide range of skills. In studying geography, you will gradually master each of these skills. You will find some of them easy to master, while others may take a little longer. As you develop each new skill, you will gain another important tool for explaining the natural processes and human activities that shape our amazing planet. The geographical skills are:
Questioning and researching
Analysing
Evaluating
Communicating and reflecting.
In this module, we have broken these skills down further to focus on particular aspects of each skill. The following table shows where you can find information on the skills.
Asking Questions
Introduction
The first stage in a geographical inquiry is simple but important. It is to look at an issue, a challenge or an event and to begin to ask questions about it. For example, imagine that you are watching the news on television and see a report of a cyclone in Bangladesh. As a geographer, you would be interested in finding out more about this event. Your enquiry might start with simple questions such as "What happened?" or "Where is it?" More complex questions such as "How did people respond to this event?" or "Are cyclones becoming more common?" would give you
the opportunity to explore this disaster in more depth. The seven geographical concepts (see Geographical Concepts) may be a good starting point for developing your questions. For example, when thinking about the facilities provided for young people in your local area, you could use the concept of space to ask if everyone in your area has equal access to these facilities. Or you could use the concept of change and ask why a nearby new housing estate has so few facilities for young people. Once you have observed your issue, challenge or event and developed your geographical questions, it is time to plan your geographical inquiry.
Collecting Information
Introduction
Geographers use a wide variety of tools to collect information. In any geographical inquiry, you will collect data that helps you answer your key question.
Primary and Secondary Data
Geographers find answers to their questions in many places. They may collect information themselves by interviewing people, taking photographs, making sketches out in the field or conducting surveys and questionnaires. This kind of information will generally only be relevant to a particular inquiry and is called primary data. Often a geographer collects information that supports their inquiry but has not been specifically collected or designed by the geographer for the inquiry. This type of information is known as secondary data.
Quantitative and Qualitative Data
Primary and secondary data provide either quantitative data or qualitative data. Quantitative data includes anything that can be measured and recorded as numbers (for example, Uluru is 3.6 kilometres long and 1.9 kilometres wide and has a circumference of 9.4 kilometres). Qualitative data, on the other hand, includes anything that can be recorded in words (for example, Uluru, one of Australia's best- known natural landmarks, is very large).
Good geographical inquiries will always be based on a combination of primary and secondary data that is both quantitative and qualitative. Even though qualitative data is an important part of any geographical inquiry, quantitative data is considered more valuable because it is less open to personal interpretation and can be more accurately represented in graphs and charts. Before you move to the next stage of your inquiry, it is important to check that you have recorded all your data without errors and that it is balanced and fair. Your data should not reflect your personal opinions, emotions, or attitudes; instead it should present facts in a clear and concise way.
Conducting Fieldwork
Fieldwork is any geographical study that takes place outside the classroom or, as geographers say, "in the field". It can be conducted at a number of scales - in your school grounds, within your local community, in another state or even in another country. Fieldwork is an essential part of geography because the world outside the classroom is the geographer's "laboratory". Fieldwork provides the opportunity for firsthand investigation of both natural and built environments, and to develop skills associated with observing, measuring and recording. Different forms of geographical data can be collected and analysed to find relationships between the natural and human environments. The results of a fieldwork investigation are presented and communicated in a fieldwork report. There is a worksheet available on Oxford Digital to learn the steps to writing a basic fieldwork report.
Fieldwork also involves identifying issues or problems and finding possible solutions. It is a way to engage with the real world and make a contribution to developing more sustainable and fair ways to manage the Earth's resources.
Different types of fieldwork
Most topics you learn about in class can also be studied during fieldwork. The types of fieldwork you conduct will differ according to your topic and the places you visit, but all these activities will help you to better understand your world.
Ethical fieldwork
Ethics refer to the correct ways of behaving and thinking. It is important to always act in an ethical way when conducting a geographical inquiry. This is particularly important while on a field trip. You must ensure, for example, that you have minimal impact on the environment. Consider carefully where you walk on fragile environments, such as sand dunes and steep slopes, and always dispose of your litter in the proper way. There are also ethical concerns to consider when dealing with other people.
• If you interview or survey members of the public you must
inform them of the purpose of your research and allow them to
consent or refuse to take part.
• Avoid asking sensitive questions such as a person's age, income
or home address.
• Never take photographs of other people without their consent.
• Take a neutral stance when interviewing people rather than
stating your own point of view.
Using Geographical Images
Another way to collect information is to take geographical images that depict and present a place or particular feature of the landscape, for the purpose of demonstrating an aspect that is being studied. Just like maps or graphs, geographers use and interpret types of photographs as sources of data. Whether you take a geographical image during a fieldwork study, or collect them from your research online, you need to be able to interpret them. andscapes can be photographed from different angles depending on the position of the camera. Each angle has its own special features. You will hear these terms as you study geography. Look at the images to familarise yourself with the different types of geographical images.
Ground level
The camera is held by someone at the same level as the landscape being photographed. This angle allows you to clearly see the height of any object and the detail in vertical surfaces.
Oblique aerial photograph
The camera is positioned above the landscape and angled towards the scene being photographed. This angle allows you to see both the foreground and the background of the scene. You can also see both the height of an object and its width or area.
Vertical aerial photograph
The camera is positioned directly above the landscape. This vertical (or plan) view allows you to see the extent of any feature. However, it is difficult to judge the height of the landscape (e.g. the trees) from this view.
Satellite images
This image is taken from space. It allows you to see large areas of the Earth's surface. These images are often used to investigate patterns. It is difficult, however, to see smaller features of the environment.
Geographic Information Systems (GIS)
Geographers also use a range of digital tools to collect, process and display information. Many of these are available on your mobile phone and include programs such as Google Earth and the Global Positioning System (GPS) that use satellites to determine the location of objects on the Earth.
Geographic Information Systems (GIS) are a way of creating, viewing, organising and analysing geographical information with the use of a software application. GIS allow geographers to access and share an incredible amount of data and look at the world in new ways. GIS are made up of three elements:
digital base maps
data that is layered over the base map (such as a chart, overlay or table)
a software application or platform that links these elements together and allows the
user to interact with all this information.
Geographic Information Systems combine satellite images, graphs and databases to allow you to identify patterns and trends so that you can gain a better understanding of the world around you. They allow you to turn different layers of data on and off in order to isolate exactly what you are looking for. You can even create and share your own maps, look at 3D models of areas and record video simulations, known as flyovers.
These systems are already a part of many people's everyday lives. Governments, companies and individuals all around the world use GIS. There are a number of GIS platforms available today, but one of the most commonly used and free GIS is Google Earth.
Representing Data
Introduction
In addition to maps, geographers use a range of other visual representations to communicate information they have collected.
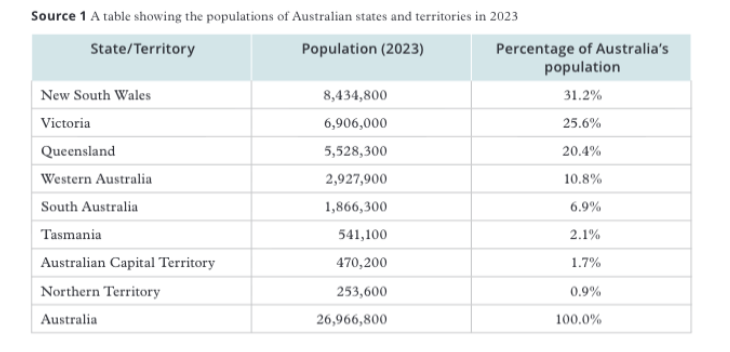
• Tables allow geographers to present and compare data by organising it under different headings (see Source 1).
• Graphs allow geographers to compare data and present it in an interesting and attractive way. There are a number of different types of graphs used by geographers for different purposes.
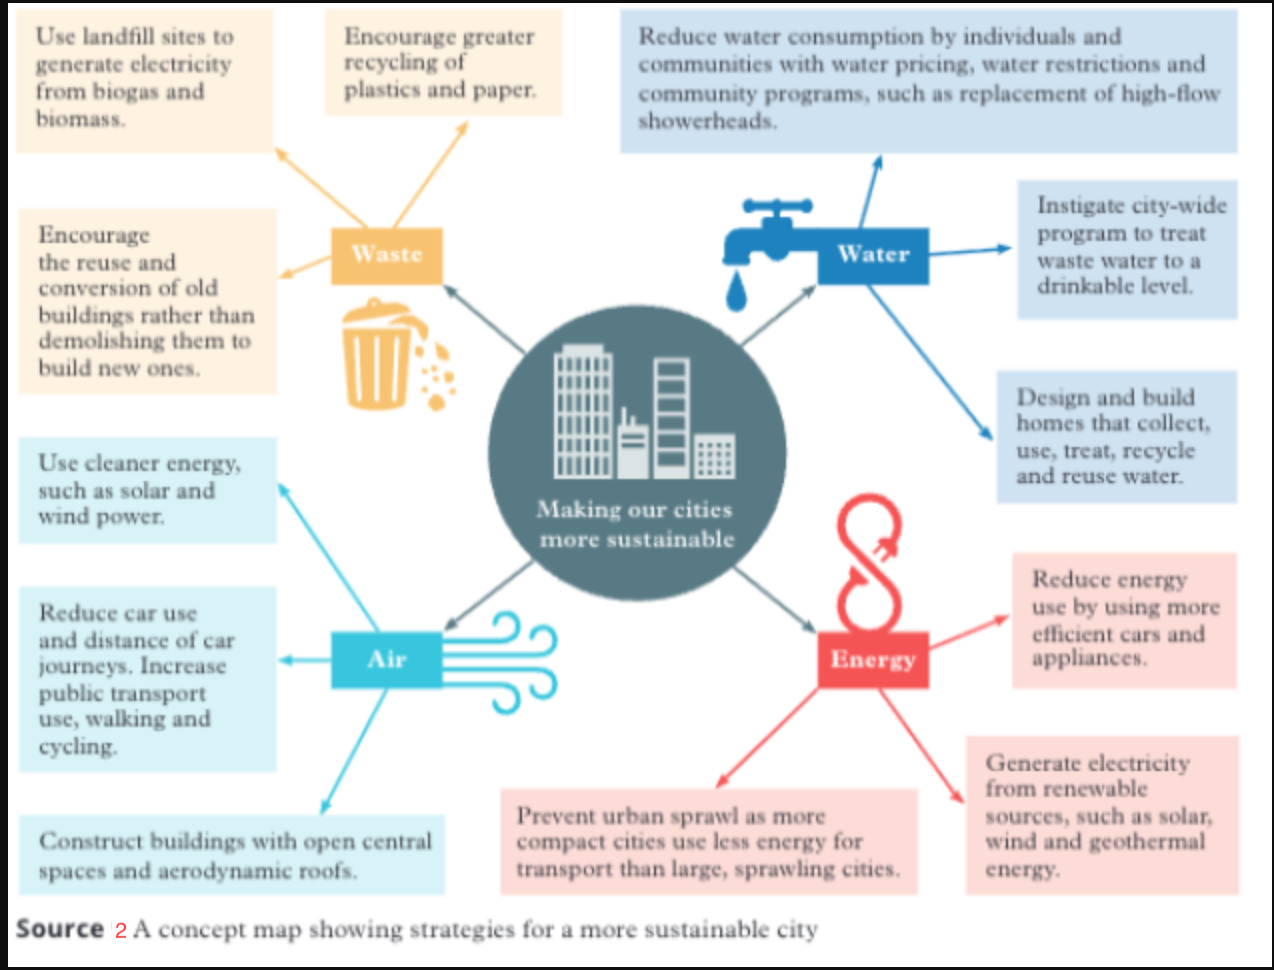
• Diagrams allow geographers to show the features or characteristics of some places or things more effectively than describing them in words. A concept map is a handy tool that you might use to show a complex idea, such as strategies for sustainability (see Source 2)
Simple Graphs
Graphs are among the most effective visual representations when it comes owing numerical (or quantitative) data. Some graphs are simple, while others are more complex. Some of these graphs are described below.
Line graphs
Line graphs show information as a series of points that are joined up to form a line. The line shows a trend or change over time. The horizontal axis (x) will usually show units of time and the vertical axis (y) will usually show amounts.
Bar graphs
Bar graphs show information as a series of bars that run in a horizontal direction and are stacked one on top of the other. They are usually use to compare quantities.
Column graphs
Column graphs are similar to bar graphs, but they show information as a series of vertical columns that are arranged side by side. They are also usually used to compare quantities.
Pie graphs
Pie graphs are shaped like a circle and are divided up so that the information being shown represents the slices of a pie. The circle of 360 degrees represents 100% and each of the slices is a percentage of that total. The slices of the pie are organised from largest to smallest in a clockwise direction starting from 12 o'clock.
More Complex Graphs
Over the course of the year you will also be working with the more complex graphs. You will not necessarily be creating these yourself, but you will be learning how to make sense of the information they provide. Some of these graphs are described below.
Climate graphs
Climate graphs show the average monthly temperature and rainfall for a place over a year. Climate graphs combine line and column graphs. Temperature is recorded as a line graph and rainfall is recorded as a column graph.
Compound column graphs
Compound column graphs are a more complex type of column graph in which each column is split into sections so results can be more easily compared.
Population pyramids
Population pyramids are bar graphs that show the percentage of males and females in different age groups in a population. They help geographers identify trends in population growth in a country. Population pyramids are organised so that younger age groups are at the bottom and older age groups are at the top. Percentages of males are placed on the left-hand side and percentages of females are placed on the right-hand side.
Diagrams and Other Graphic Representations
Geographers create diagrams and other graphic representations to help them look for
patterns in the data they have gathered. These tools also help people who were not
involved in the inquiry (such as the general public, the government or people in the
media) understand the work that has been done.
Analysing Maps
Introduction
An important skill in geography is the ability to identify and explain patterns in the world around you. Often these patterns appear on a map. In fact, you will also create your own maps to display data you have found during fieldwork or through research. Before doing so, it is important to develop an understanding of the essential features that appear on maps and how to read them.
Essential features of maps
Maps are drawn in the plan view (directly from above) because this ensures the scale will be the same across the entire area. If maps were drawn from an angle, some parts of the mapped area would look distorted and it would not be an accurate representation of the area. When properly used, maps can reveal a great deal about our planet and the ways in which we use it.
BOLTSS
Regardless of the type of maps you are creating or analysing, all will share some common features. There are six features that ensure every map is drawn in a clear, concise and accurate way. To help you remember these features, you can use a mnemonic (memory aid) that consists of the first letter of each of the features: border, orientation, legend, title, scale and source. Together, these six letters make up the word BOLTSS.
Direction
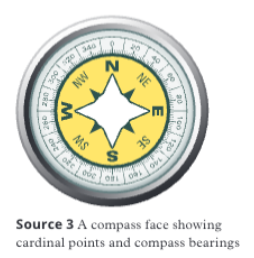
Direction must always be shown on maps because it enables the user to work out the location of features shown. Direction is shown on maps using compass points. A compass is an instrument with a magnetised needle that will always point to the Earth's magnetic field near the North Pole (known as magnetic north). The face of a compass shows a circle made up of 360 degrees (see Source 3).
The four main directions on a compass are north, south, east and west. These are known as cardinal points. Most maps are oriented to north. Once north has been established, you can find the other points of the compass. Using compass points is an accurate way of giving directions because the compass always points to magnetic north, no matter which direction you are facing.
Compass bearings provide an even more precise way to give directions. A bearing is an angle that is measured clockwise from magnetic north. The bearing of magnetic north can be either 0 degrees or 360 degrees, the bearing of south is 180 degrees, the bearing of east is 90 degrees and the bearing of west is 270 degrees. These bearings are also shown in Source 3.
Scale
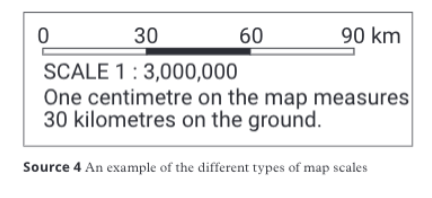
Maps are scaled representations of real areas. These representations have been designed to fit on a piece of paper or on a computer screen. Maps look the same as the real areas they are representing, just reduced to a size you can work with. Scale on maps allows you to work out the distances in the real world. Look at Source 4. It shows the three types of scale that can be used on maps and how they work.
• Written scale - a written scale tells you how much a distance on the map represents on the ground. The written scale on Source 4 is "One centimetre on the map measures 30 kilometres on the ground". Using this information we can easily work out that 5 centimetres on the map would be equal to 150 kilometres on the ground, and so on.
• Line scale - a line scale is a numbered line that acts like a ruler. You can use it to measure distances on the map. The Source 4 line scale shows that 1 centimetre is equal to 30 kilometres.
• Ratio scale - a ratio scale shows scale in numbers. The ratio scale for Source 4 is 1:3 000 000, so 1 unit (that is, 1 centimetre) on the map represents 3,000,000 centimetres on the ground. Of course, 3,000,000 centimetres is equal to 3 kilometres.
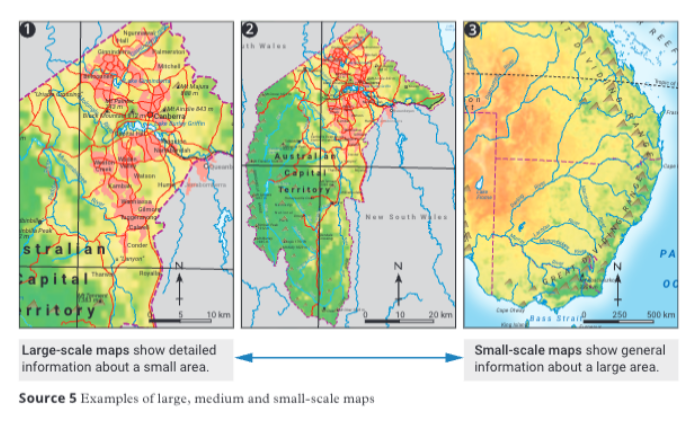
Comparing map scales
Maps are often shown at different scales depending on the amount of detail they need to show. Source 5 shows three maps at different scales.
• Map 1 is a large-scale map. It shows a large amount of detail but only a small area. You can see the city area (in pink) and Lake Burley Griffin.
• Map 2 is a medium-scale map. It shows a medium amount of detail and a medium area. You can see the whole of the Australian Capital Territory (ACT).
• Map 3 is a small-scale map. It shows a small amount of detail but a large area. You can only just see the border of the ACT.
Locating Places on Maps
Maps are used for many different purposes, but the most commonly used maps help us to find things we are looking for. These maps are often overlaid with a set of lines that form a grid. These gridlines divide the map into smaller areas and help us find places more casily. There are several ways in which you can locate things on maps and methods you can use to help other people find these places. Some of these methods will give you a general idea of where something is, while others can help you pinpoint the exact location of something.
Grid and area referencing
ALPHANUMERIC GRID REFERENCING
In maps that use alphanumeric grid referencing, the spaces between gridlines are labelled with letters and numbers. The letters appear along the bottom (or top and bottom) of the map, while the numbers appear down the left-hand side (or both sides) of the map.
AREA REFERENCING (AR)
The area referencing (AR) method is used on topographic maps that have gridlines. Each line is given a two-digit number. The lines that run up and down the map are known as eastings (because the numbers increase as you move east). The lines that run across the map are known as northings (because the numbers increase as you move north). A four-figure area reference will pinpoint the bottom left-hand corner of the grid square in which you will find the feature. The eastings are given first, then the northings.
SIX FIGURE GRID REFERNCING
Six-figure grid references (GR) help locate exact points on a topographic map. The area between each easting is divided into 10 further parts (tenths), as is the area between each northing. This is just like adding a finer set of gridlines over the existing gridlines, allowing you to be very specific about where things are within each grid square. As with area referencing, the castings are given first then the northings. The difference is that one more figure is added to the easting and one more figure is added to the northing. This makes six figures in total.
Latitude and Longitude
Maps that show large areas of the Earth's surface (such as world maps) use a set of imaginary lines that form a grid. These gridlines, known as latitude and longitude, help us to locate places accurately.
Lines that run from cast to west are known as lines (or parallels) of latitude. Lines that run from north to south are known as lines (or meridians) of longitude. Each of the lines is separated by degrees rather than distance because the world is round, not flat.
The line of latitude midway between the North Pole (90 degrees north) and South Pole (90 degrees south) is known as the Equator (see Source 8), which is located at 0 degrees latitude. It divides the Earth into the northern hemisphere and southern hemisphere.
Lines of latitude are measured in degrees north and south of the Equator. Lines of longitude are measured east and west of the Greenwich meridian (also known as the Prime Meridian), which is located at 0 degrees longitude
Simple Maps
Geographers use different types of maps to show a whole range of different natural
and built features, and to analyse the connections between them.
Physical maps
Physical maps show the locations and names of natural features of the Earth. These may include deserts, mountains, rivers, plains, oceans, reefs, volcanoes and lakes
Political maps
Political maps show the locations and names of built features of the Earth. These may include country borders, state and territory borders, cities and towns.
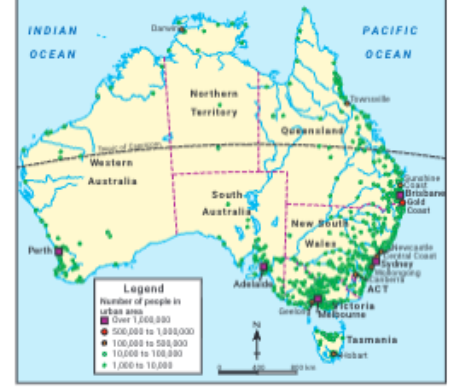
Dot distribution maps
Dot distribution maps use dots (or shapes) to represent (and sometimes compare) a range of different features. The dots show the location of the chosen feature. The size and colour of the dots on the map can show different characteristics of that feature. For example, in Source 6, small towns are shown as small green dots and big cities are shown as big purple squares. Other dot distribution maps show the location of a single feature, such as litter. Dot distribution maps help to show patterns and links between features - geographers refer to this as spatial distribution.
Flow maps
Flow maps show movement from one place to another. Arrows of different thicknesses or colours are used to show where different things (such as people or goods) are moving to and from, and compare the numbers involved in the movement.
Choropleth maps
Choropleth maps use different shades of the same colour to give a quick impression of the pattern formed by the data being shown. Darker shades show the highest values or the greatest amounts, while lighter shades show the lowest values or the least amounts.
Overlay maps
Overlay maps show how features on the Earth's surface may be related to each other. To create an overlay map, you first need to produce a base map showing one feature (such as the location of Australian rainforests) and then place a piece of tracing paper or plastic sheet over this base map showing the other feature you are investigating (such as areas with a moist tropical climate).
More Complex Maps
Geographers also use a number of more complex maps to represent information.
Topographic maps
Topographic maps show the shape of the land (such as the shapes formed by valleys, hills and ridges) by using contour lines. Numbers on some of the contour lines show the height of the land above sea level. The closer together the contour lines are, the steeper the land. Symbols and colours are also used on topographic maps to show other natural features (such as forests, rivers and lakes) and built features (such as towns, roads and mines).
Weather maps
Weather maps show conditions in the atmosphere, such as air pressure, wind speed and wind direction. They also show the size and location of warm and cold fronts. Weather maps are also known as synoptic charts. They are most commonly seen on the nightly news.
Digital Maps
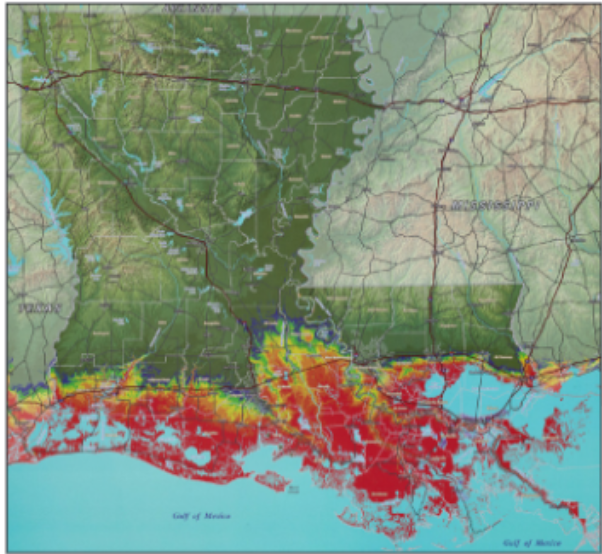
Most geographical data is collected and stored digitally. Geographers then access this data to create their own maps. This allows them to select particular features of the natural or human landscapes to focus on. In Source 7, for example, the data for height above sea level has been added to a base map showing towns and roads. This allows the geographer to explore the possible effects of a flood or a rise in sea level.