Water and Carbon Cycle
The Earth has four sub-systems:
The atmosphere: a mixture of nitrogen, oxygen and other gases which surround the planet
The lithosphere: the crust and uppermost part of the mantle
The hydrosphere: a discontinuous layer of water at or near the Earth’s surface
The biosphere: the sum of all living matter
Natural Systems
A system is a type of model used to simplify aspects of Earth to understand the relationship between different components. It is an assemblage of interrelated parts that work together by way of a driving process.
Open: Where energy and matter can be transferred from the system across the boundary into the surrounding environment.
Closed: Where matter cannot be transferred beyond the system boundary.
Isolated: Where there are no interactions with anything outside the system boundary. There is no input or output of energy or matter. This is rarely found in nature, instead are found in laboratory experiments.
When there is a balance between the inputs and outputs then the system is in equilibrium. Dynamic equilibrium happens when inputs and outputs vary yet on average remain close to balanced. An upset equilibrium occurs when inputs and outputs are out of balance for a long time triggering long term changes. To maintain equilibrium, positive and negative feedback loops are established to cause a change in the system.
Positive: The effects of an action are amplified by subsequent effects.
Global temperatures rise — Increased oceanic temperatures — Dissolved CO2 released by warmer oceans — More CO2 in the atmosphere — Global temperatures rise (repeat)
Negative: The effects of an action are nullified by subsequent knock-on effects.
Increase use of fossil fuels — Increase in atmospheric CO2 — More plant growth — Reduces atmospheric CO2
Water Cycle 💧
Global Distribution
The Hydrosphere is all the water on or close to the Earth’s surface as a discontinuous layer. 97% of the Earth’s water is found in the ocean and only 3% is freshwater. Freshwater can be found in many different places.
Cryosphere: water that is frozen including permafrost and glaciers. (69%)
Terrestrial: water found in lakes, wetlands, rivers, groundwater, and soil moisture. (30.3%)
Atmospheric: water found in the atmosphere including ice crystals but mainly vapour. (0.04%)
Biological: water in animals, plants, and in humans.
The amount of water in these stores is in a state of dynamic equilibrium. These changes can be daily or even geologically.
Oceanic Water
Oceans cover approximately 72% of the planet’s surface, despite this, oceanographers have stated that only 5% of oceans have been explored.
The salt dissolved in the oceans increases the pH from neutral to about 8.14. However, this has further increased to 8.25 due to rise in atmospheric carbon.
Cryospheric Water
There are five main locations of cryospheric water:
Sea Ice
Forms when water in the oceans is cooled to temperatures below freezing. Ice shelves are platforms of ice that form where ice sheets and glaciers move out into the oceans. Icebergs are chunks of ice that break off glaciers and ice shelves.
Ice Sheets
A mass of glacial land ice extending more than 50,000 km². Two major ice sheets are found in Greenland and Antarctica. Together they contain more than 99% of the freshwater ice on Earth. The Antarctic Ice Sheet extends almost 14 million km² and contains 30 million km³ of ice. The Greenland Ice Sheet extends about 1.7 million km².
Ice Sheets form where the snow that falls in winter does not melt completely over summer, so layers of snow pile up and compresses under its own weight. They are constantly in motion, slowly flowing downhill under their own weight.
Ice Caps
Thick layers of ice on land that are smaller than 50,000 km². They flow outwards and become the major source for many glaciers. The Furtwangler Glacier on Kilimanjaro, at 60,000 m², is Africa’s only remaining ice cap.
Alpine Glaciers
Thick masses of ice found in deep valleys or in upland hollows. Most valley glaciers are fed by ice from ice caps or smaller corrie glaciers. These glaciers are particularly important in the Himalayas where about 15000 glaciers support rivers such as the Ganges and, in turn, are the lifeline of millions of people in South Asian countries.
Permafrost
Ground that remains at or below 0 degrees Celsius for at least two consecutive years. The thickness of these varies from less than one metre to more than 1500 m. Permafrost is found beneath the ice-free regions of the Antarctic continent and also occurs beneath areas in which the ice sheet is frozen to its bed.
The permafrost has begun to melt as climate warms, releasing large amounts of carbon dioxide and methane.
Terrestrial Water
Falling into four broad classes:
Surface Water
The free-flowing water of rivers, ponds, and lakes.
Rivers act as a source and a transfer of water: they are streams of water within a defined channel, transferring water from the ground from soils and from the atmosphere to a store. Rivers make up 0.0002% of all water. The Amazon is the largest river by discharge of water in the world.
Lakes are collections of freshwater found in hollows on the land surface. The majority of lakes are freshwater, the largest is the Caspian Sea.
Wetlands are areas of marsh, fen, peatland, or water, with water that is static or flowing where there is dominance of vegetation.
Groundwater
Water that collects underground in the pore spaces of rock.
Soil water
Held together with air in unsaturated upper weathered layers of the Earth. it affects weather and climate, run-off potential and flood control, soil erosion, reservoir management and more. Soil moisture plays an important role in the development of weather patterns and the production of precipitation.
Biological Water
The water stored in all the biomass.
Atmospheric Water
Exists in three states but the most common is as a gas.
Gas - Vapour
Vapour is important as it absorbs, reflects, and scatters incoming solar radiation, keeping the atmosphere at a temperature that can maintain life.
Factors Driving Changes
The size of the stores is dictated by:
Flows and transfers
Evaporation
Global factors
Climate Change
Precipitation
Cryospheric Changes
Flows and Transfers
Flows and transfers are the movement of parts within the system. These impact the size of the water store.
Evaporation
Increases the amount of water stored in the atmosphere. The magnitude of the evaporation flow varies by location and season.
If there is lots of solar radiation, a large supply of water and warm, dry air, the amount of evaporation will be high.
If there is not much solar radiation, little available liquid water ad cool air that is already saturated, evaporation will be low.
Condensation
Transfer of water from a gas to a liquid.
Water droplets can stay in the atmosphere or flow to other subsystems. This decreases the amount of water stored in the atmosphere.
The magnitude of the condensation flow depends on the amount of water vapour in the atmosphere and the temperature.
If there is lots of water vapour in the air and there is a large or rapid drop in temperature, condensation will be high.
Precipitation
Transfer of water from the atmosphere to the Earth’s surface in the form of rain, hail, snow, and dew.
Interception
Precipitation that is caught and stored on its way to the surface by leaves, plants, grasses, and trees.
Surface Flow
This is when water flows over the land’s surface.
Infiltration
When the water enters small openings and pores in the ground from the surface.
Throughflow
Throughflow is the lateral (sideways) movement of water through the upper soil.
Percolation
Where water flows down through the soil layers and underlying rock.
Groundwater flow
Water that has infiltrated and percolated into the bedrock and below the water table.
Evapotranspiration
Combination of evaporation and plant transpiration
The process where plants release water vapour into the atmosphere through their leaves.
Sublimation
This is when water changes from a solid without becoming a liquid.
Stem Flow
The flow of water down the stems of plants or trunks of trees.
Zone of Saturation
The height of the water table will vary according to the season.
Where there is permanent saturation, this is called the phreatic zone.
Global Factors
During the last Ice Age, roughly a third of Earths’s surface was covered in ice sheets, and glaciers. This increased the magnitude of the cryosphere’s store. But, it lowered the hydrosphere’s store and sea levels were over 100m lower than present day.
Clouds and Precipitation
The global atmospheric circulation drives the formation of clouds and types of precipitation.
Cloud formation and precipitation are essential parts of the water cycle
Precipitation is the main flow of water from the atmosphere to the ground.
Clouds form when warm air cools down, causing water vapour to condense into water droplets. This gathers as clouds. When the droplets are big enough, they fall as precipitation.
Factors leading warm air to cool:
Other Air Masses - when the less dense warm air meets cool air, the warm air is forced up above. It cools as it rises. This results in frontal precipitation.
Topography - when warm air meets mountains, it is forced to rise, causing it to cool. This is orographic precipitation.
Convection - when the sun heats up the ground, moisture on the ground evaporates and rises up in a column of warm air. As it gets higher, it cools. This is convective precipitation.
For clouds to form, water droplets need a cloud condensation nuclei for the water to condense on.
The Equator receives more solar radiation, resulting in higher temperatures which cause high rates of evaporation. As the warm, moist air rises, it cools, condenses and forms banks of towering clouds with heavy rainfall. This area is a low-pressure zone known as the Intertropical Convergence Zone (ITCZ). The ITCZ tracks with the seasonal movement of the sun, north and south of the equator bringing intense low-pressure rain conditions with the movement.
Crypospheric Processes
The second largest store of water is ice, 95% is locked as the ice sheets of Antarctica and Greenland.
Processes such as accumulation (input of snow and ice) and ablation (output of water) changes the magnitude of the cryosphere.
The balance of accumulation and ablation varies with temperature.
During glacial periods, inputs are greater than outputs. Water is transferred to it as snow, less is transferred out as water.
During interglacial (warm) periods, the magnitude of the store reduces as losses due to melting are larger than inputs of snow.
The Earth is emerging from a glacial period that reached its maximum 21000 years ago. There are still extensive stores of ice in land, as well as numerous alpine glaciers.
Variations in cryospheric processes happen over different timescales.
Changes in global temperature occurs over thousands of years,
Annual temperature fluctuations mean that more snow falls in the winter than in the summer.
Local Processes
A variety of processes affect the change in the magnitude of stores on a local scale.
Farming practices impact stores
Ditches drain the land and increases water flow away from the land.
The interception by vegetation can prevent as much as 40% of precipitation from reaching the surface.
Over-abstraction of groundwater for irrigation removes stores of water.
Deforestation reduces interception and infiltration
The interception by leaves stems and branches reduces the amount that reaches the ground and slows the passage of water to the surface, allowing infiltration into the subsurface to occur.
Deforestation affects surface stores as natural depression stores are removed.
Roots help to break up the soil, increasing the rate of infiltration and groundwater recharge.
Urbanisation
Development of the slope creates impermeable surfaces which effectively removes natural depression stores.
Impermeable surfaces reduce infiltration impacting groundwater stores.
Surface runoff is increased and river channel stores are increased.
Industrialisation
Burning of fossil fuels generates CO2 in the atmosphere enhancing the greenhouse effect and global warming.
This in turn affects precipitation rates and intensities of fall, affecting magnitude of stores.
Industrial output can produce acid rain, which destroys vegetation and interception rates, affecting water stores.
Drainage Basins
A drainage basin is an area of land drained by a river and its tributaries. A drainage basin can also be called a catchment.
It is the area that supplies a river with its water.
Drainage basins can be viewed as open, local hydrological cycles:
A river’s drainage basin is the area surrounding where precipitation will fall on land and flow into the river.
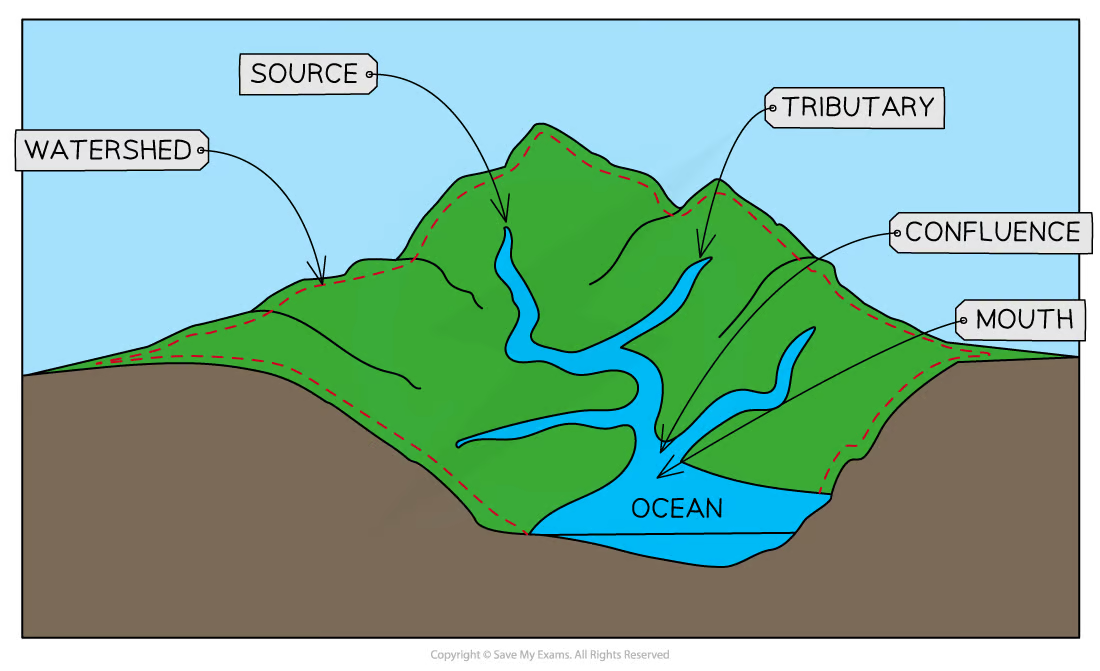
The boundary of it is the watershed.
Any precipitation falling beyond the watershed enters a different drainage basin.
Water comes into the system as precipitation, and leaves via evapotranspiration and river discharge.
Source: The point furthest from the river mouth, where the river starts.
Confluence: The place where two or more streams meet.
Tributary: A stream that flows into a larger stream/river.
Mouth: Where the river enters a larger body of water (seas, oceans, or lakes).
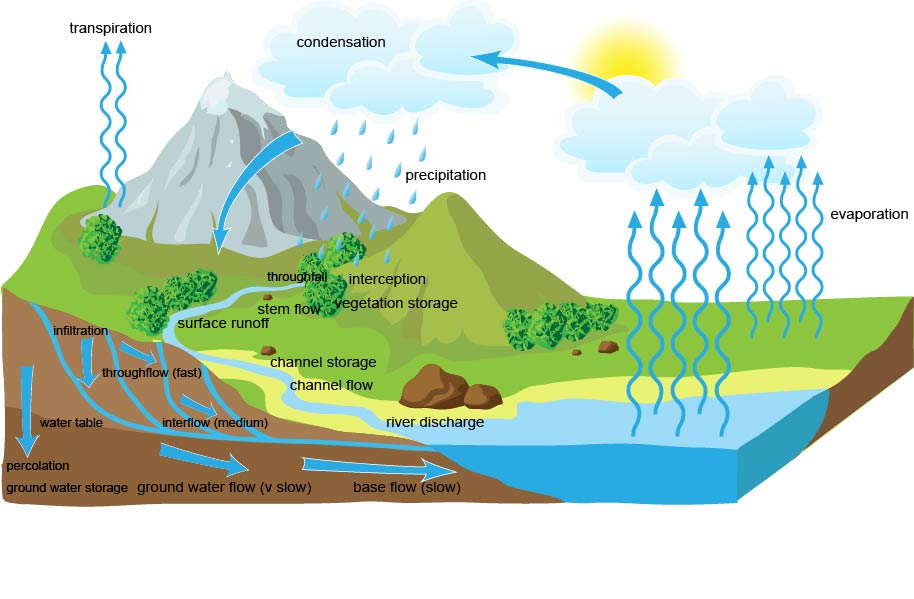
Inputs - Precipitation
Storage - Interception, Vegetation, Surface storage (including depression storage), Soil storage, Groundwater, Channel (the water held in a river channel).
Flows - Infiltration, surface runoff, throughfall (dripping from one leaf to another), stemflow, throughflow (moving downhill through soil), percolation, groundwater flow, baseflow, interflow (through permeable rock above the water table), channel flow (the water flowing in the river, also called river’s discharge).
Outputs - evapotranspiration, river discharge.
Channel Network
Every drainage basin is covered by a network of tributaries which connect to the main river channel.
The number of tributaries in a drainage basin is referred to as the drainage density:
Lots of tributaries = high drainage density
Few tributaries = low drainage density
This affects the magnitude of stores.
Water Balance
The balance between inputs and outputs is known as the water balance. The water balance affects how much water is stored in the basin.
P = O + E ± S
Precipitation = total runoff + evapotranspiration ± changes in storage.
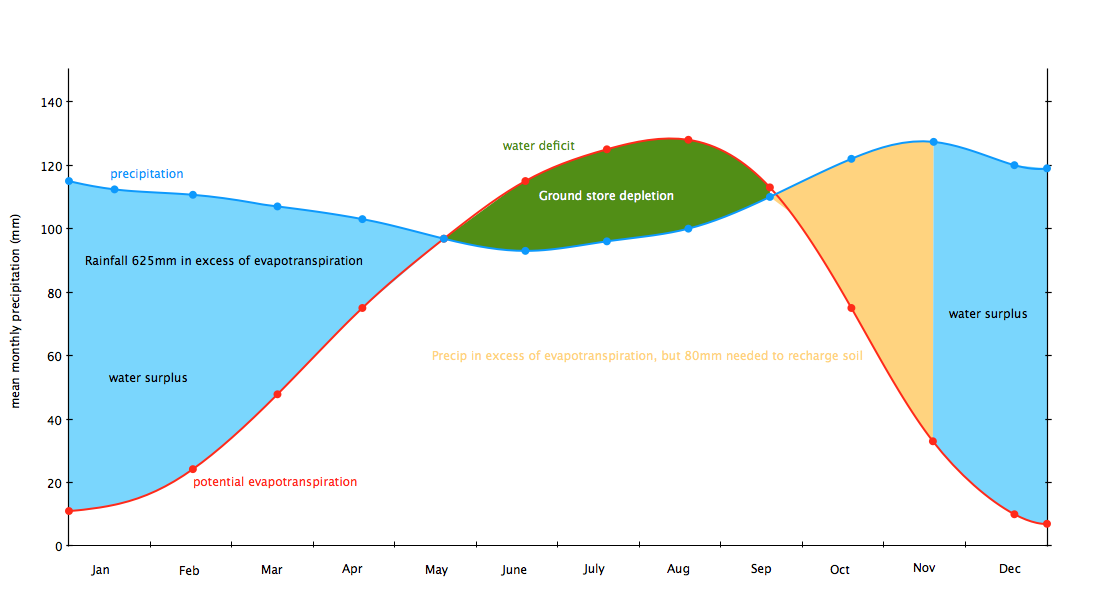
The general water balance in the UK shows seasonal patterns.
In wet seasons, precipitation (blue line) is greater than evapotranspiration (red line) which creates a water surplus (blue).
Ground stores fill with water so there is more surface runoff and higher discharge, so river levels rise.
This means there is a positive water balance.
In dry seasons, precipitation is lower than evapotranspiration.
Ground stores are depleted (green) as some water is used.
Some flows into the river channel, but is not replaced by precipitation.
This means there is a negative water balance.
At the end of a dry season, there is a deficit of water in the ground.
The ground stores are recharged in the next wet season (yellow).
Hydrographs
River discharge is the volume of water (cubic meters, m³) that flows in a river per second. Measured in cubic meters per second, m³/s, known as cumecs.
The level of discharge is influenced by:
Rate of precipitation.
The speed at which water transfers to the river across the drainage basin.
Hydrographs are used to measure discharge over time. They show how the volume of water flowing over a certain point in a river changes over time.
Flood Hydrographs show river discharge around the time of a storm event. They only occur in a relatively short period of time.
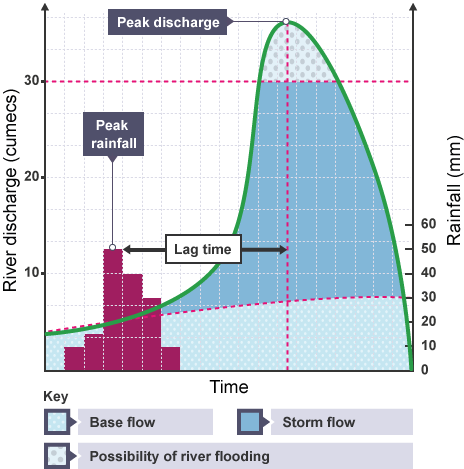
Peak Discharge
This is the highest point on the graph, when the river discharge is at its greatest.
Lag Time
This is the delay between peak rainfall and peak discharge. This delay happens because it takes time for the rainwater to flow into the river.
A shorter lag time can increase peak discharge.
Rising Limb
This is the part of the graph up to peak discharge. The river discharge increases as rainfall flows into the river.
Falling Limb
This is the part of the graph after peak discharge. Discharge is decreasing because less water is flowing into the river.
A shallow falling limb shows water is flowing in from stores after it’s stopped raining.
A basin with rapid runoff and not much storage capacity gives a hydrography with a short lag time and high peak discharge. This is called a flashy hydrograph.
Hydrograph shape depends on various factors:
Size of drainage basin
Larger drainage basins catch more precipitation → there is higher peak discharge.
Smaller drainage basins generally have shorter lag times → precipitation has less distance to travel → reaches river channel faster.
Shape of basin
Circular basins are more likely to have flashy hyrdographs than long, narrow basins.
All points on the watershed are roughly the same distance from the point of discharge measurement.
Ground Steepness
Water flows more quickly downhill in steep-sided drainage basins, shortening lag time.
Water also has less time to infiltrate into the soil → runoff is higher.
Rock and soil type
Impermeable rocks and soils do not store water or let water infiltrate → increases surface runoff → peak discharge increases as more water reaches the channel.
Precipitation and Climate
Heavy rainfall will produce a flashy hydrograph
Delayed snowmelt → short lag time.
Slow light rain will produce a subdued hydrograph
High temperatures will increase evapotranspiration → reduce discharge.
Cold temperatures may freeze the ground → restricts infiltration → increases runoff and increases discharge.
Antecedent Conditions
The conditions before the plotted hyrdograph.
Flashy Hydrograph
Dry compacted ground won’t allow infiltration and lag time decreases.
Saturated soil will give short lag time
Frozen ground decreases lag time.
Subdued hydrograph
Dry soil will absorb more moisture → increases lag time.
Vegetation
Varies with season
In the summer there are more leaves (on deciduous trees) → interception is higher → peak discharge is lower.
Land Use/Urbanisation
Water runs more quickly over impermeable surfaces such as concrete or compacted agricultural land.
Dams increase lag time → water is held back → lower base discharge.
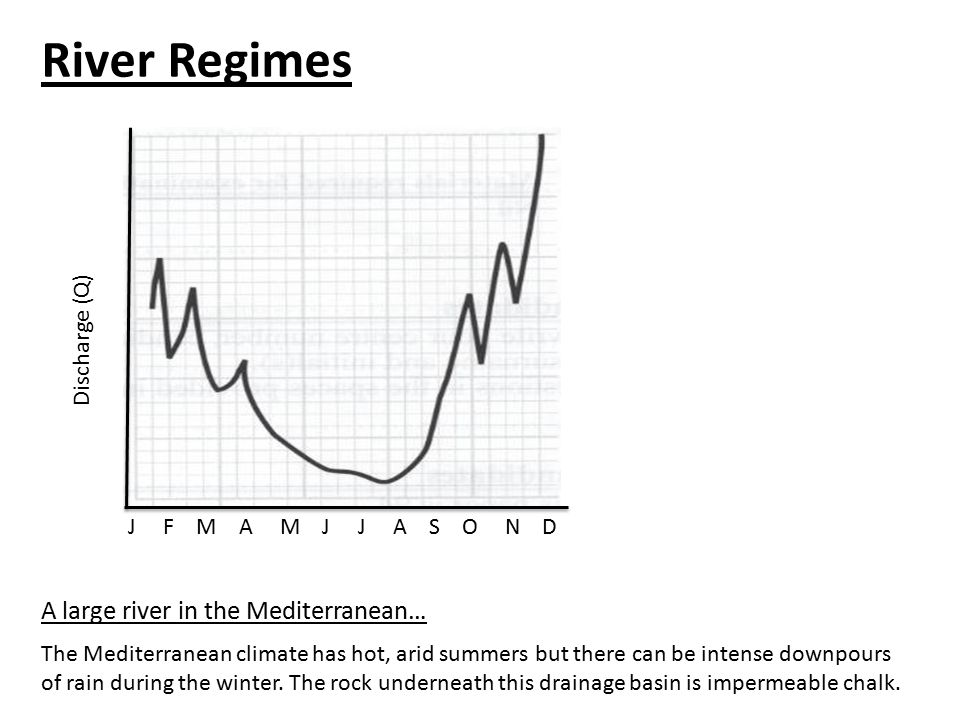
River Regime
A river regime is the variability in a river’s discharge throughout the course of a year, in response to precipitation, temperature, evapotranspiration, and drainage basin characteristics.
Changes over time
Inputs, outputs, stores, and flows of the water cycle change over time.
Natural Processes
Process | Impact |
Storms Events | Intense storms generate more precipitation and greater peak discharges. Large amounts of precipitation saturate the ground to its field capacity quicker → No more water can infiltrate → increases the surface runoff. Storm events are less effective at recharging water stores than prolonged rainfall. |
Seasonal Changes | The size of inputs, flows, and stores varies with the seasons. Spring: More vegetation growth → more interception Summer: Less rain. Ground may be harder → more impermeable → encourages surface runoff. Autumn: Less vegetation growth → Less interception → Seasonally more rainfall. Winter: Frozen ground is impermeable → increase runoff. Snow discourages runoff → slowing down the processes that occur within the water cycle. |
Droughts | Causes major stores to be depleted → activity of flows within the cycle decrease. May cause long-term change as it becomes more common with climate change. |
El Niño | El Niño effect: Occurs every 2-7 years → causes warm temperatures in a predictable way. Normal: Trade winds push warm water to west (direction of travel) → cold water replaces it (upwelling) → creates temperature difference. Above warmer water, air rises → rising air creates unsettled weather → sets up atmospheric circulation → cooler, dryer air descends in east. El Niño: Weaken or reverse trade winds → less warm on west and less upwelling on east → lowers temperature difference → warmest water moves → unsettled air moves → changes rainfall. |
La Niña | La Niña effect: Occurs every 2-7 years → causes cooler temperatures in a predictable way. Part on El Niño-Southern Oscillation (ENSO): alternates between warm El Niño, Neutral, and cold La Niña phases. Occurs when trade winds become stronger than usual → cools surface water temperatures → disrupts global weather patterns by altering atmospheric pressure systems. → influences rainfall, precipitation, and storm events. Can bring torrential rains, trigger droughts. Australia and SE Asia → increased rainfall → increased flooding. N America → cooler winters in northwest → drier conditions in the Southern US. S America → droughts Africa → eastern wetter → southern drier, more droughts. India → strengthens monsoon |
Human Factors
Factor | Impact |
Farming (Agriculture) | Farming practices can affect infiltration: Ploughing breaks the surface → more water can infiltrate → reduces runoff. Crops increase infiltration and interception → reduces runoff. Evapotranspiration increases. Livestock trample and compact the ground → decreases infiltration → increases runoff. Irrigation can increase runoff → groundwater levels can fall if water is extracted for irrigation. Hillside terracing → increases surface storage → decreases runoff. |
Land use change | Deforestation reduces interception by vegetation → increases surface runoff. Dead plant material on the forest floor helps to hold water → increases infiltration. When material is removed → infiltration decreases. Urbanisation creates impermeable surfaces → decreases infiltration → increase surface runoff → reduces lag time → increasing flood risk. Green roofs, sustainable urban drainage systems, and green infrastructure use grass, soils, and vegetation to reduce impermeable surfaces → increase interception → reduce problem of flooding in urban areas. |
Abstraction | More water is abstracted to meet demand → reduces the amount of water in stores. During dry seasons even more is abstracted → for consumption and irrigation → stores are depleted further. |
Climate Change | Increasing global temperatures → reduces cryospheric stores and availability of freshwater. |
Carbon Cycle 💭
Global Distribution
Carbon is an essential building block of all life forms, rocks, minerals, and fossil fuels on Earth. It forms more compounds than any other element.
The carbon cycle is the route around the Earth that carbon takes, the processes it goes through from organic forms to inorganic and back.
Carbon can be found in all global spheres:
Lithosphere
The largest carbon store with over 99.9% of the all carbon on Earth stored in sedimentary rocks (limestone)
110 million gigatonnes of Carbon (GtC)
Organic Stores
Litter
organic matter
humic subtances found in soils.
Inorganic Stores
fossil fuels - coal, oil, natural gas, oil shale
carbonate-based sedimentary deposits - limestone.
Marine sediments contain up to 100 million GtC
Fossil fuels contain ~ 4100 GtC
Soil organic matter contains between 1500 and 1600 GtC.
Hydrosphere
Carbon is dissolved in rivers, lakes, and oceans as CO2.
Oceans cover 71% of Earth’s surface, this makes it the second-largest store of carbon. (0.04% of the Earth’s carbon)
Carbon is contained in both organic and inorganic forms.
Oceanic stores can be divided into 3:
Surface Layer (Euphotic zone) - sunlight penetrates → photosynthesis takes place contains ~900 GtC.
Intermediate (Twilight zone) and deep layer → contain ~37100 GtC
Living Organic Matter and dissolved organic matter → contains ~ 30 GtC and 700 GtC.
Total: between 37000 and 40000 GtC
Cryosphere
The cryosphere stores carbon within and just above the permafrost layer.
Contains less than 0.01%
Atmosphere
CO2 makes up 0.04% of the Earth’s atmosphere.
The atmosphere contains 0.001% of the total carbon.
Methane (CH4) is produced by biological processes.
The present concentration of CO2 in the Earth’s atmosphere is higher than it has been for at least 800,000 years.
Mauna Loa Observatory: increased from Industrial Revolution to 2015 → 280 parts per million (ppm) to 400.3 ppm.
Largely attributed to anthropogenic sources.
Biosphere
The living fabric that comprises of plants and animals.
Carbon is stored in the tissues of living organisms.
Approximately 0.004% of total carbon.
The main stores are:
Living Vegetation: 19% of the biosphere → Amazon Basin contains 20% of the world’s forest carbon
Plant Litter: fresh, undecomposed, and easily recognisable plant debris.
Soil Humus: Thick brown/black substance that remains after most of the organic litter has decomposed.
Peat: accumulation of partially decayed vegetation or organic matter. Permanent water saturation obstructs oxygen → anaerobic conditions slow decomposition. Cover 3% of the land → contain ~250 GtC.
Animals: very important in the generation of movement of carbon.
Factors Driving Changes
Flows of Carbon
Photosynthesis → transfers carbon between the atmosphere and biomass.
Plants and phytoplankton use energy to from the sun to change carbon dioxide and water into glucose and oxygen.
Enables plants to grow.
Carbon is passed through the food chain → released through respiration and decomposition.
Respiration → transfers carbon from living organisms to the atmosphere.
Plants and animals break down glucose for energy → releasing carbon dioxide and methane.
Decomposition → transfers carbon from dead biomass to the atmosphere and the soil.
After death, decomposers (bacteria and fungi) breakdown the carbohydrates.
Releases carbon dioxide and methane back into the atmosphere.
Some of the carbon is transferred to the atmosphere.
Some is transferred to the soil in the form of humus.
Dark organic matter formed by decomposition.
Combustion →
Burial and Compaction →
Sequestration →
Ocean uptake and loss →
Weathering →