Nutritional Assessment
Lecture Objectives
Highlight different nutritional screening and assessment tools
Calculate ideal body weight (IBW), adjusted body weight (AdjBW), body mass index (BMI), body surface area (BSA), and daily caloric needs using the Harris Benedict equation
Analyze laboratory data in the context of nutritional status
Understand drug-nutrient interactions and their clinical significance
Nutrition Screening
To identify risk factors of malnutrition
Encompasses undernutrition and overnutrition (obesity)
Undernutrition
Unintended weight loss
Chronic disease (COPD, RA)
Medications (roflumilast)
Malabsorptive states
Socioeconomic barriers
Overnutrition
PMH (PCOS, Cushings)
Family history of obesity
Medications (corticosteroids)
Poor dietary habits
Sedentary lifestyle
Tools to Assess Nutrition
WHO Growth Chart
Pediatric patients 0-24 months
Describes how children should grow given optimal living conditions
CDC Growth Chart
Patients 2-20 years
Describes typical growth pattern of US children from 1963-1994
Nutrition Focused Physical Exam (NFPE)
Assess physical findings of malnutrition
Muscle wasting, obesity, pallor, alopecia, ascites, jaundice
Anthropometric Measures
Weight, height, stature, head circumference, waist circumference
Anthropometrics
Total Body Weight (TBW)
Weight on the scale
Affected by fluid status
Used for most drug dosing
Ideal Body Weight (IBW)
Males: 50 kg + 2.3 (height over 60 inches)
Females: 45.5 kg + 2.3 (height over 60 inches)
Adjusted Body Weight (AdjBW) = IBW + 0.4(TBW - IBW)
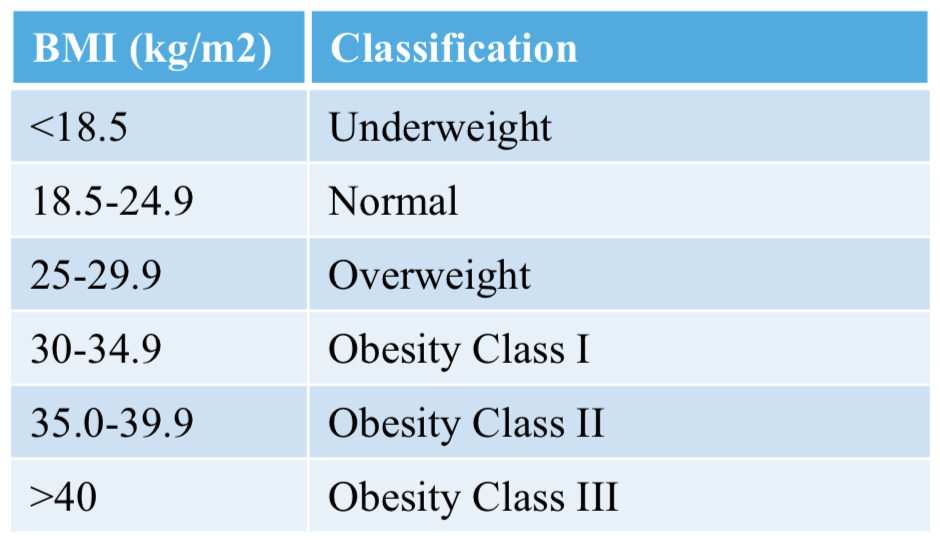
Body Mass Index (BMI)
Weight (kg) / height (m²)
Body Surface Area (BSA)
BSA =
Often used for chemo dosing or specialized pediatric drug calculations
Laboratory Parameters
Albumin
3.5-5.0 g/dL
Maintains plasma oncotic pressure
Less sensitive to acute changes
Insensitive marker of protein malnutrition (can indicate chronic malnutrition)
Low albumin → Correct levels of highly protein bound drugs (phenytoin) and Ca2+
Transthyretin (Prealbumin)
15-36 mg/dL
Binds to thyroxine (T3 + T4)
More sensitive marker for acute changes
C-Reactive Protein (CRP)
< 1.0 mg/dL
Marker of inflammation, infection, trauma
Blood Urea Nitrogen (BUN)
7-20 mg/dL
Reflects protein intake and kidney function
Elevated levels → Dehydration (20:1 ratio), renal impairment, or excessive protein intake
Low levels → Overhydration or liver disease
1 g Nitrogen per 6.25 g protein
Transferrin
200-400 mg/dL
Levels decrease in presence of inflammation or critical illness
Transport protein for iron
Indicator or protein status or iron deficiency
Serum Creatinine
0.6-1.2 mg/dL
Reflects kidney function and muscle mass
Elevated levels → Renal impairment
Low levels → Reduced muscle mass or severe malnutrition
Nutrition Requirements
Indirect calorimetry is most accurate bedside method to determine energy requirements
Harris-Benedict Equation
Used to estimate energy requirements in adults
Incorporates age, height, weight sex
Estimates basal energy expenditure (BEE) in kcal/day
Males: BEE = 66 + (13.75 x weight (kg) + 5 x height (cm)) - 6.8 x age
Females: BEE = 655 + (9.6 x weight (kg) + 1.8 x height (cm)) - 4.7 x age
Drug-Nutrient Interactions
Zinc deficiency
ACEi/ARBs, thiazides, valproic acid
Hair loss, impaired immune function, delayed wound healing, taste changes
Vitamin D deficiency
Phenytoin, phenobarbital, corticosteroids, cholestyramine, colestipol, efavirenz
Osteoporosis, increased risk of fractures, rickets (children), bone pain
Vitamin B12 deficiency
PPIs, metformin, H2RAs
Cognitive disturbances, fatigue, memory loss, neuropathy, weakness, anemia