W4: Electroencephalography (EEG)
Topic 1: Principles of electroencephalography
There is no single imaging technique that measures all (or most) of the events in the brain
Imaging techniques vary in terms of which aspects of the brain's function they measure. This means they vary in respect to:
Direct/Indirect (approach)
Invasiveness
Precision
⭐️ EGG is a non-invasive brain imaging technique that can measure neuronal activity from large populations of neurons
Hans Berger — Birth of EEG
Investigation into brains’ potential to communicate wirelessly led to the discovery that placing electrodes on the scalp can measure changes in the electrical activity of the brain.
Recording:
Electrodes (~ 32 to 256) embedded in an elastic cap
EEG = voltage difference between that electrode and the reference electrode in microvolts
Recorded signal is then amplified and filtered, and digitized (by a digitization computer)
Digitization = process of converting an analogue signal to a discrete set of samples that can be stored on a computer.
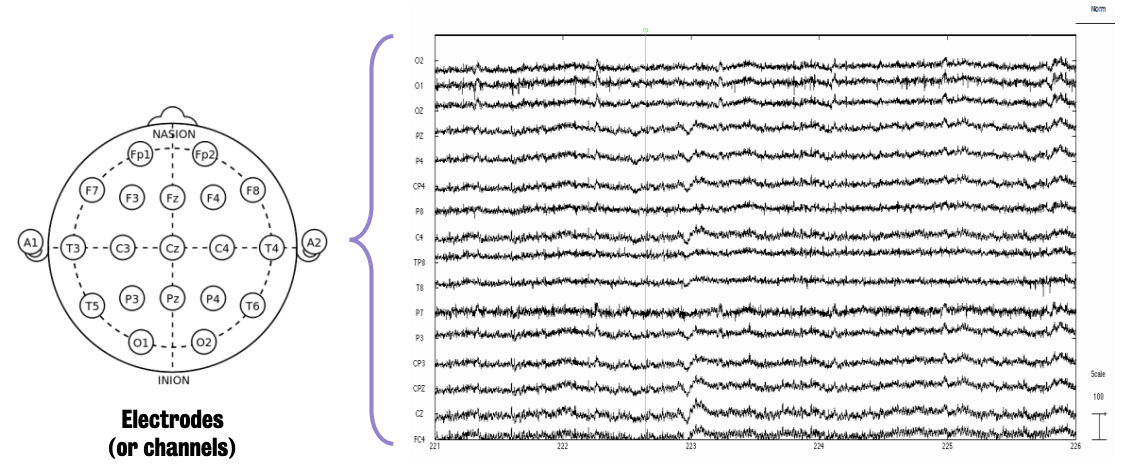
Note: Each row shows the recorded signal from a specific electrode or channel
It plots voltage differences between each electrode and the reference electrode over time
Recorded EEG is characterized by a mixture of rhythmic brain waves, oscillating at various frequencies, representing a mixture of activity from many neural sources that are active at the same time.
The electrodes are placed on the EEG cap according to an international standard, the 10-20 system.
This system prescribes the location of each electrode in terms of distance from specific landmarks on the head.
Each electrode is named using one or two letters to indicate the underlying brain region & the number to indicate the hemisphere
Odd # for the left hemisphere; even # for the right
The greater the number, the greater the distance from the midline
Z (for 0) indicates electrodes on the midline
Oscillations detected by EEG reflect neuronal oscillations, i.e. changes in the excitability of populations of cortical pyramidal neurons that are synchronously active over time.
3 different scales of neuronal organisation:
Microscopic scale reflects brain dynamics at the level of single neurons or columns of pyramidal neurons (e.g. synaptic events)
Small and weak electrical fields generated by individual neurons cannot be detected by scalp EEG recording
Mesoscopic scale reflects brain dynamics at the level of populations of cortical neurons occupying several mm3 or cm3 (i.e., cortical patches)
May be visible in the EEG using special analysis techniques.
Macroscopic scale reflects brain dynamics at the level of populations of neurons occupying large regions of the cortex.
Macroscopic brain dynamics are readily visible in the EEG
When active, neurons act like small electrical generators.
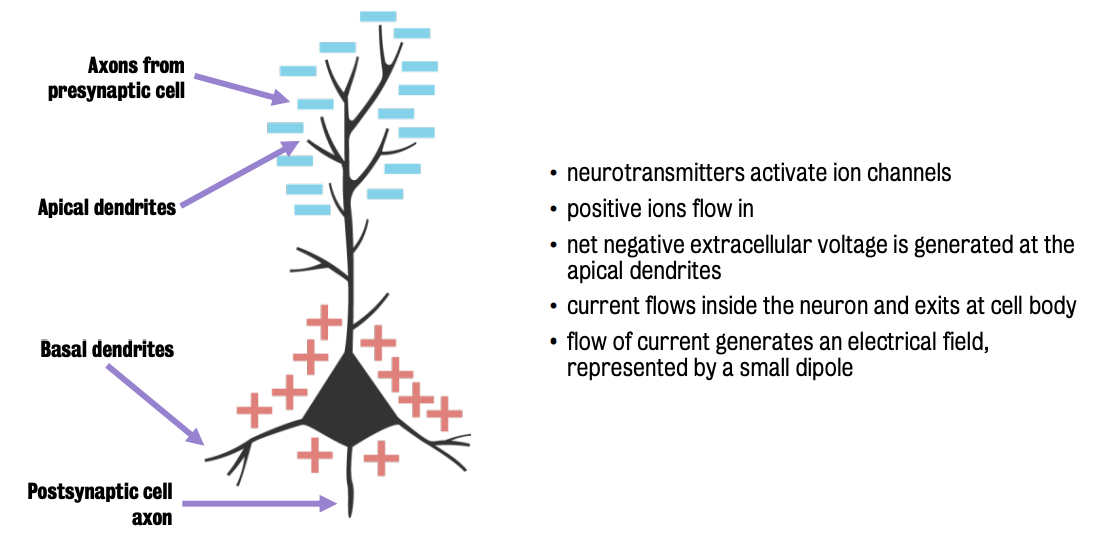
Note: Ions are positively charged, and :. will generate a net negative extracellular voltage as they flow into the cell. As current flows inside the neuron and out of the cell body, it generates a net positive extracellular voltage.
When recoding with scalp electrodes, we are unable to distinguish between excited or inhibitory input.
Excitatory input at the level of the apical dendrites & inhibitory input at the level of the cell body or basal dendrites generate electrical fields with the same polarity, and :. cause the same pattern of deflections EEG recording at the scalp
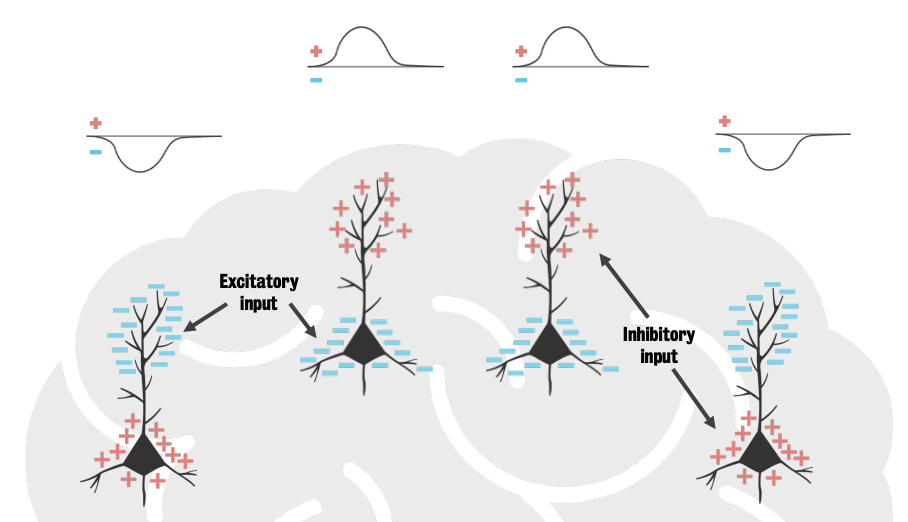
Electrical fields can summate and become large enough to be propagated and be picked up by electrodes outside the head (i.e., at the scalp)
Electrode conductive gel is used to build bridges between EGG electrodes and the scalp, as the electrical conductivity of air is 0.
It is nearly impossible to record activity from subcortical structures nested deep within the brain (e.g. basal ganglia). Why?
Strength of the field decreases exponentially as a function of distance from the sensor.
This means that strong fields will be substantially attenuated by the time they reach the electrodes on the scalp.
Neurons in subcortical structures are arranged in random orientations, meaning no clear pattern can emerge
Conversely, cortical pyramidal neurons are arranged in parallel geometric orientation, allowing for a clear measurable signal
Recorded EEG is characterized by a mixture of rhythmic brain waves, oscillating at various frequencies, representing a mixture of activity from many neural sources.
Signal processing techniques (e.g., Fourier transform) can separate the brain’s different frequencies
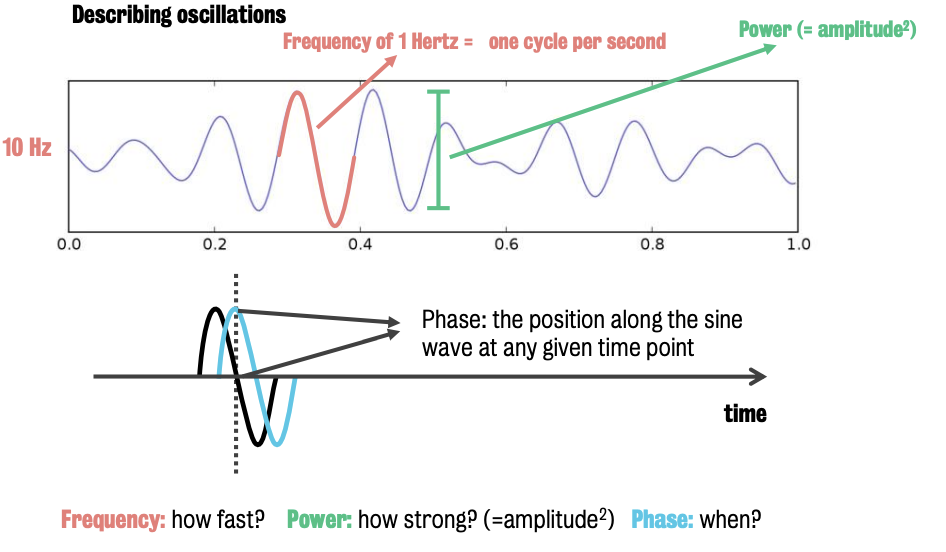
Describing oscillations:
Frequency refers to the speed of oscillation (i.e., number of cycles/second) — how fast?
Measured in hertz (Hz)
1 hertz = 1 cycle per second
Power refers to the amount of energy in a frequency band — how strong?
Squared amplitude of the oscillation
Phase refers to the position along the sine wave at a given time point
⚠ Power and phase are independent, measuring distinct neural dynamics
We can separate oscillations in the recorded EEG signal into frequency bands by applying signal processing techniques.
Boundaries defining the bands are neither precise or arbitrary, but the result of brain oscillations’ neurobiological mechanisms.
Changes in rhythmic activity have been linked with various perceptual, cognitive, motor and emotional processes.
Advantages of using EEG in clinical and cognitive neuroscience:
Offers the best temporal resolution among neuroimaging modalities
Voltage fluctuations are direct reflections of biophysical phenomena at the level of populations of neurons
Provides a multidimensional signal, which contains time, space, frequency, power, and phase information
Bridge between research on humans and non-humans via across species applications
Disadvantages and limitations:
Low functional localization (🚫 identify brain regions generating the brain dynamics)
However, EEG can provide crude brain localization info
Not suited for investigating activity from deep brain structures
Not suited for the study of slower cognitive processes and mental dynamics (e.g., emotions)
Cannot measure:
Molecular or synaptic events
Events produced by a specific neurotransmitter
Action potentials
Synchronous activity from small populations of neurons
Local field potentials generated by neurons that are not in parallel geometric orientation
Event-Related Potentials
ERPs (event related potentials) have been used extensively in cognitive and clinical neuroscience to study the neural activity linked to specific sensory, cognitive, and motor events.
Refer to changes in EEG that are due to specific events.
Experiments can be designed where an event of interest is repeated many times while the EEG is being recorded.
ERPs are derived from electroencephalography (EEG) recordings by averaging EEG segments time-locked to the occurrence of an event. This process isolates the neural activity related to the event of interest by cancelling out background and non-phase-locked brain activity.
How to obtain and describe ERPS:
To identify the consistent pattern of changes in cortical electrical activity that is caused by the stimulation of fibres, we can repeat the event (i.e., laser pulse) many times,
Experiments involve repeating an event of interest (e.g., sensory stimulus, motor response) multiple times while recording EEG
Event marker = labelled time stamp
Creating epochs
Continuous EEG recording is segmented into small chunks surrounding the onset of each event of interest (e.g., laser pulse), based on the event markers.
Epochs = time-locked segments of experimental events of interest.
End result is a waveform that reflects changes in voltage specifically associated with the delivery of a stimulus/event (i.e., noxious laser pulse)
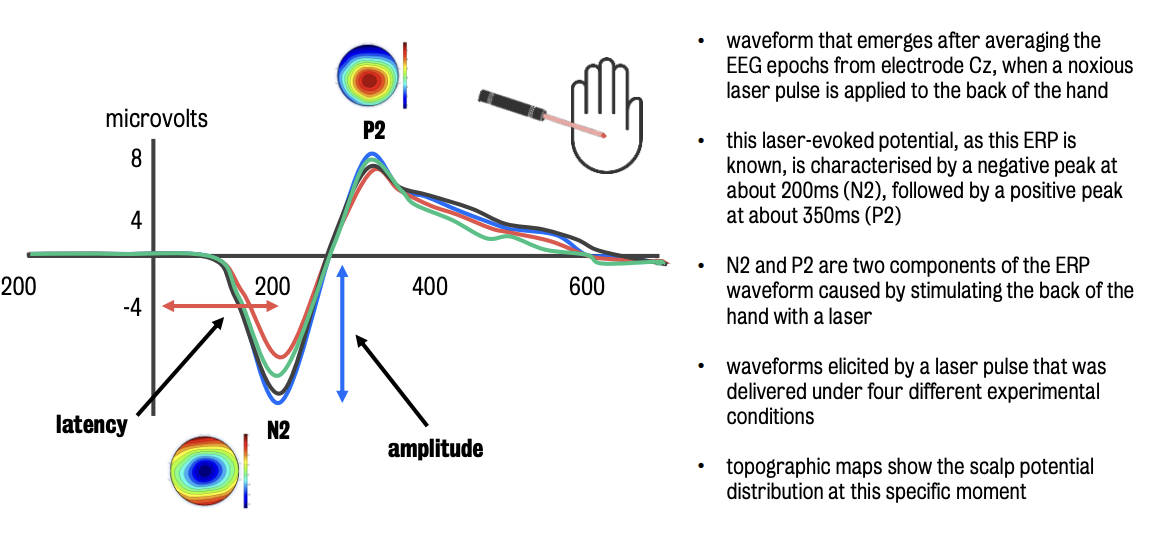
Polarity refers to orientation of the deflection as negative (N) or positive (P).
Latency refers to the time it takes for the component to appear after the event
Amplitude refers to the magnitude of the voltage change
Latency and amplitude are measured using the peak of the of the component as reference (see image).
Components of an ERP waveform are typically described by a letter and a number.
The letter indicates polarity (N for negative; P for positive)
The number indicates the relative order of appearance following stimulus onset
The number can also represent the approximate latency (in milliseconds) — e.g., P300 would stand for a component of positive polarity that appears at about 300 milliseconds from time 0
ERP reflects brain dynamics resulting from background activity and activity evoked by the processing of a stimulus/cognitive event
Task-related activity can be phased-locked (i.e., the phase of the evoked waves is similar in every trial and align with time 0) or non-phase-locked (oscillations are time-locked but phase differs from trial to trial)
Phase locked (evoked):
Phase aligned with time = 0 event;
Phase is similar or same on every trial;
Will be observed in time-domain averaging and time-frequency domain averaging
Non-phase-locked (induced):
Time-locked to time = 0 event, but phase is different on every trial
Will be observed in time-frequency domain averaging – no representation in ERPs
ERPs only captures activity that is phased and time-locked.
Non-phase-locked activity will not be represented in the ERPs but it may be measured with signal-processing techniques (e.g., time frequency analysis).
⚠ Background activity of the brain and non-phase-locked activity will cancel out as a result of averaging, because such activity at any given time point may have either positive or negative polarity across epochs.
ERPs are maximal over specific electrodes on the scalp
Topographical localization = Identification of the electrode showing maximal effects
⚠ This is not to be confused with brain localization, the identification of the brain regions generating the electrical activity recorded at the scalp.
The activity recorded at a specific electrode is a "weighted mixture of electrical activity generated by brain sources across the cortex."
Advantages of using ERPs
Well-suited to investigate differences in brain processing between two or more conditions
Offer high temporal precision and accuracy
Relatively easy to compute
Extensive literature on ERPs and associated cognitive processes, facilitating the interpretation of results
Disadvantages and limitations of using ERPs
Difficulty isolating contribution of specific brain regions
Averaged ERP waveforms are weighted mixtures of time- & phase-locked event-related activities from many cortical sources
:. activity recorded at this electrode does not necessarily reflect activity at a cortical patch under that particular electrode, but the weighted mixture of electrical activity generated by brain sources across the cortex
Limited representation of brain dynamics — ERPs only represent specific aspects of brain dynamics (e.g. they do not reflect non-phase-locked but task-related brain activity).
Topic 2: EEG pre-processing & spectral analysis
Key Concepts:
Pre-processing: The initial steps taken to clean and prepare raw EEG data for analysis by removing artifacts and noise.
Artifacts = Noise signal: Electrical signals recorded by the EEG that do not originate from brain activity, often stemming from external sources or physiological processes.
Noise: Unwanted electrical activity that obscures the underlying brain signals in EEG recordings.
Spectral Analysis: Techniques used to decompose the EEG signal into its constituent frequencies, revealing the power and distribution of neural oscillations.
Neural Oscillations: Rhythmic or repetitive patterns of neural activity in the brain, often categorized into frequency bands (e.g., delta, theta, alpha, beta, gamma).
Fourier Transform: A mathematical algorithm that decomposes a time-domain signal (like EEG data) into its frequency components.
Wavelet Transform: Another mathematical technique that can decompose a signal into different frequency components, but unlike the Fourier transform, it provides good time and frequency localization.
Synchrony: The coordinated activity of neuronal populations, often reflected in the phase or frequency coupling of EEG signals recorded at different locations.
Coherence: A measure of the consistency of the relationship between the frequency components of two or more EEG signals, indicating the degree of their functional connectivity.
Power-line Noise: Artifactual electrical activity originating from mains electricity (50 Hz in some regions, 60 Hz in others).
Eye Movement Artifacts: Noise in the EEG signal caused by the electrical activity of the eyes (e.g., blinks, saccades).
Muscle Artifacts: High-frequency noise in the EEG resulting from the electrical activity of scalp, neck, and facial muscles.
Sweat Artifacts: Low-frequency fluctuations in the EEG signal caused by changes in skin impedance due to sweat.
Digital Filter: A mathematical process applied to the EEG signal to attenuate or eliminate specific frequency ranges.
Regression and Subtraction: Artifact removal techniques that involve recording the artifact signal separately (e.g., with a VEOG channel) and using it to estimate and subtract the artifact from the EEG data.
Independent Component Analysis (ICA): A statistical technique that separates a multivariate signal (like EEG) into additive subcomponents that are maximally statistically independent. Artifactual components can then be identified and removed.
Re-referencing: The process of changing the reference electrode used to calculate the voltage differences in the EEG signal after the initial recording. Different referencing schemes can highlight different aspects of the brain activity.
Average Reference: A re-referencing technique where each electrode's signal is referenced to the average of the signals from all electrodes.
Laplacian Reference: A re-referencing technique where the signal at a central electrode is referenced to the average of the signals from its surrounding electrodes, providing a more localized measure of activity.
VEOG (Vertical Electro-oculogram): A technique used to record vertical eye movements, often used to capture blink artifacts.
HEOG (Horizontal Electro-oculogram): A technique used to record horizontal eye movements, often used to capture lateral eye movement artifacts.
Impedance: The opposition to the flow of electrical current. Low impedance between the scalp and electrodes is crucial for reducing power-line noise.
Active Electrodes: EEG electrodes with a built-in amplifier to help reduce noise at the source.
Pre-processing
This step focuses on techniques to remove noise and prepare the signal for spectral analysis.
Raw EEG signal often contains electrical signals that do not originate from the brain, meaning that pre-processing is crucial to clean the EEG signal up before further analysis can be conducted.
Two (2) sources of electrical noise:
Electrical equipment
Why? Power sources used by electrical equipment oscillates at 50 Hz (or 60 cycles/s in North America)
Participant’s eye and muscle activity
⚠ Unless the EEG is conducted in a perfectly electrically shielded environment, it will contain power-line noise.
Minimizing the contamination at acquisition is the first line of defence to …dealing with noise in EEG
There needs to be a good connection between the scalp and the electrodes, as low impedance reduces power-line noise.
Some systems use active electrodes in which there is an amplifier at each electrode to help reduce this noise.
Filtering can also be used to reduce power-line noise
While useful if noise of interest includes low frequency signals and event-related potentials, this approach not suited for investigating high EEG frequencies.
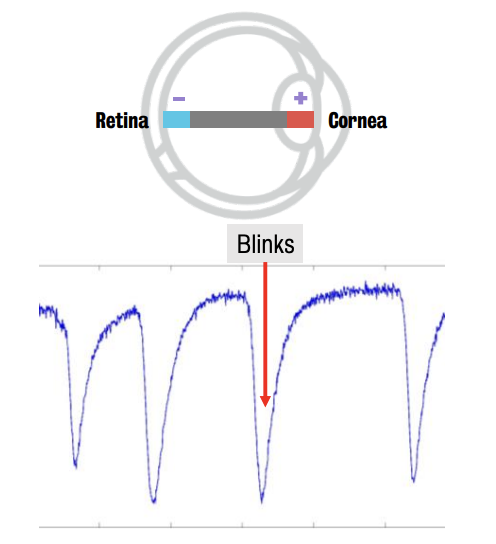
The eyes produce two (2) types of noise:
Low frequency
Caused by the dipole between the retina and the cornea
Blinking → sharp deflection
Moving eyes side to side → squarer artefact
High frequency
Caused by contraction of extraocular muscles — i.e., sharp contraction of the muscles behind the eyes
This artefact only contaminates frequencies above 30 hertz and is not important for ERPs or low frequency analysis
Contamination by scalp and neck tension muscle activity:
Physical artifacts also include muscle activity such as frowning, teeth clenching and neck muscle tension
Sweat droplets cause sudden drops and changes in impedance, resulting in large, low-frequency swings in the EEG, particularly potentially exacerbated with active electrodes at higher impedances.
This is why it is crucial to keep participants cool during EEG recordings
There are at least four (4) methods which can be used to clean EEG signal:
Digital filtering: mathematical process blocks specific frequencies (e.g., 50 Hz)
Cautioned against for spectral analysis as it is also a filter
Can distort nearby frequencies
Not suitable for analyzing high-frequency EEG activity.
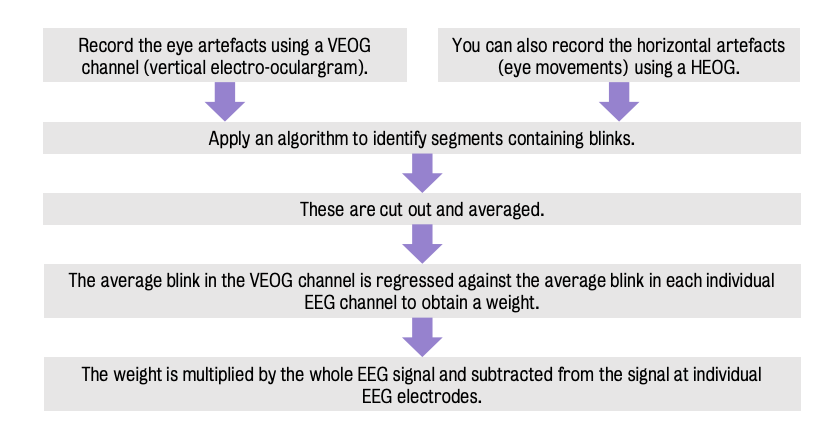
Regression: Involves recording noise signal alongside EEG using Vertical Electro-Oculogram (VEOG) to capture blinks by placing an electrode above and an electrode below the eye. Recorded noise is then used to calculate weights and subtract the noise component from the EEG channels.
Independent component analysis (ICA): complex mathematical technique that aims to demix the EEG signal into components which are as independent from each other as possible"
Labour-intensive and highly subjective
Requires careful identification of components
Caution when interpreting gamma range results corrected with ICA using fewer than 128 channels due to the numerous independent noise sources at high frequencies
Mathematical modelling: novel method developed to address scalp muscle artifacts, mentioned as an optional reading.
Regression and subtraction (using artifact channels)
Commonly used for slow-frequency eye artifacts and increasingly for power-line noise.
Horizontal Electro-Oculogram (HEOG) captures horizontal eye movements.
Regression uses VEOG (blinks) and HEOG to remove eye artifacts
ICA can also be used to identify and remove eye artifact components based on their "frontal distribution and also from the shapes within the EEG signal.
Electrical potentials can only be measured as potential differences and not absolute values :. any EEG signals has to be measured relative to a reference (electrode).
At acquisition, references can include a mastoid, the ear lobe, the nose or a mid-line reference such as FCZ.
At recording, reference can be changed and various references can be used
Various referencing schemes can be applied, including average referencing, bipolar referencing (referencing to a nearby electrode), and Laplacian referencing (subtracting the average of surrounding electrodes).
The choice of reference can impact the interpretation of the EEG signal.
Neural Oscillations
Main Themes and Important Ideas/Facts:
Modelling EEG Signals as Waves:
EEG signals, while not strictly sinusoidal, are often modelled as sine waves due to their specific mathematical properties.
Other types of waves include:
Square
Saw-tooth
Triangular
Arch-shaped
Regardless, sine waves serve as a fundamental model for understanding EEG.
Quantifying Neural Oscillations:
Features of interest include:
Amplitude: Magnitude or height of the wave.
Can be measured as peak-to-peak (difference between positive and negative peaks) or peak amplitude (deflection from zero).
Power: For a sine wave, the power is the square of the amplitude
Frequency: number of cycles per second (measured in Hz)
Indicates how fast the oscillation occurs.
Phase: Relative timing of a wave.
Waves can have the same amplitude and frequency but differ in their phase.
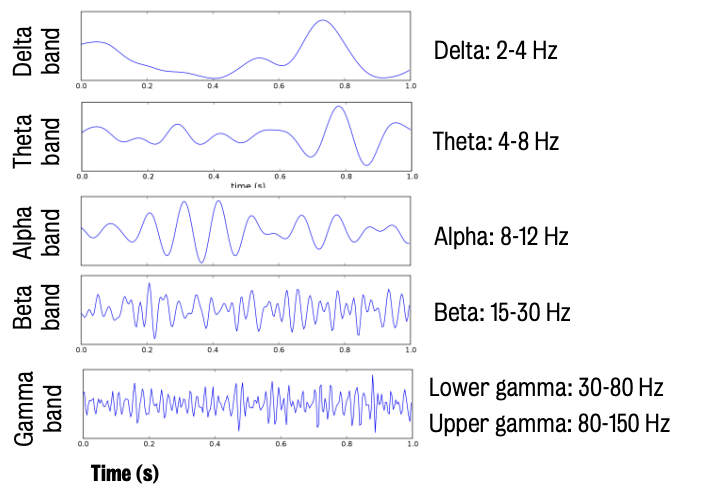
Main EEG Frequency Bands and Their Significance:
The EEG signal comprises different frequency bands, each associated with different brain states and cognitive processes.
Alpha (10 Hz): The largest oscillation in the waking EEG, most prominent when the eyes are closed and the person is relaxed. Thought to represent "pulsed inhibition" of irrelevant stimuli.
Theta (4-8 Hz) and Delta (<4 Hz): Slower rhythms typically observed when a person is drowsy or asleep, but also involved in cognitive processes.
Theta: located in the hippocampus, involved in memory, , sensorimotor coordination, but also in drowsiness when alpha slows.
Delta: characteristic of sleep or drowsiness, but are also involved in cognitive processing.
Beta (12-30 Hz) and Gamma (>30 Hz): Faster frequencies that are also involved in cognitive processes.
Gamma: involved in brain activation and attention
Beta: involved in motor and cognitive processes
Event-Related Synchronization (ERS) and Desynchronization (ERD):
Brain activity in response to a stimulus can lead to changes in the synchronization of different frequency bands.
Alpha Event-Related Desynchronization (ERD): When a visual stimulus is presented, the prominent alpha waves in the occipital EEG disappear, becoming desynchronized. This reflects a release from inhibition, allowing for processing of the stimulus.
Beta-Gamma Event-Related Synchronization (ERS): Concurrent with alpha desynchronization, faster beta and gamma rhythms may become synchronized in response to a stimulus, indicating increased neural processing.
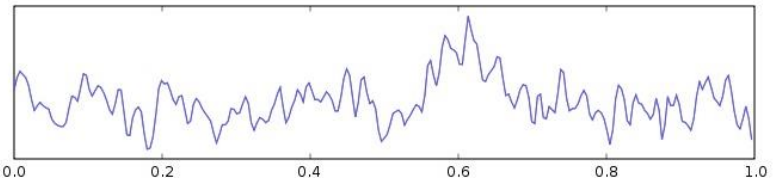
Simulated EEG for Component Separation:
Simulated EEG signals can be used to isolate and analyze different frequency components.
The presented simulation demonstrated:
An event-related synchronization of a slow wave (around 4 Hz).
The presence and desynchronization of an alpha wave (around 10 Hz, amplitude of 1).
A smaller amplitude beta component (around 25 Hz, amplitude of 0.4).
Very small amplitude, fast frequency gamma signals (approximately 45-50 Hz, amplitude of 0.15).
Key Takeaways:
Understanding the fundamental properties of waves (amplitude, power, frequency, phase) is crucial for analyzing EEG signals.
Different frequency bands in the EEG reflect distinct brain states and are implicated in various cognitive functions.
The brain's response to events can be observed through changes in the synchronization of these frequency bands (ERD and ERS).
Simulated EEG allows for a clearer understanding of the individual components that contribute to the complex overall EEG signal.
Spectral analysis
.Main Themes and Important Ideas/Facts:
Quantification of Brain Waves through Spectral Analysis:
Spectral analysis is the primary method for quantifying brain waves in EEG. It involves breaking down the EEG signal into a series of sine waves of different frequencies.
Two (2) main methods:
Fast Fourier Transforms (FFTs)
Wavelet transforms.
2. Resting State EEG (QEEG) vs. Event-Related Spectral Analysis:
Spectral analysis can be applied to:
Resting state EEG (QEEG): Analysis of brain wave frequencies when the subject is at rest.
Event-related spectral analysis (Time-frequency analysis): Analysis of frequency changes in response to a specific event (stimulus or response).
Event-related oscillations can be induced (not time-locked to the stimulus) or evoked (time-locked to the stimulus).
Evoked oscillations are closely related to event-related potentials (ERPs).
Fast Fourier Transforms (FFTs):
FFTs break down any signal, including EEG, into sine and cosine waves.
Their primary advantage is computational efficiency, making them a significant advancement in EEG analysis when computing power was limited.
Limitations of FFTs: Fixed frequency bands must be the same across all frequencies.
The frequency band is determined by the length of the EEG segment used for the transform.
The number of data points in the EEG segment must be a power of two (e.g., 64, 128, 256).
EEG segments need to be multiplied by a "window" (e.g., cosine, Hanning, Welch) to reduce frequency leakage.
4. Wavelet Analysis:
A more recent development involving the convolution (point-by-point multiplication and summation) of the EEG signal with wavelets of different scales to measure similarity.
Wavelet analysis involves convolution between the EEG signal and wavelets of different scales. It produces a measure of the similarity between the wavelet and the EEG.
A Morlet wavelet (sine wave modulated by a Gaussian) is commonly used.
Two types of wavelet transforms:
Discrete Wavelet Transform: Uses scales based on powers of two, resulting in fixed frequency bands similar to FFTs.
Continuous Wavelet Transform: Allows for the specification of any scale, providing flexibility in frequency resolution at different frequencies. This allows for finer resolution in lower frequencies and broader resolution in higher frequencies if desired.
With the continuous wavelet transform, you can choose the scales to be whatever you wish them to be. They don't have to be powers of two, so this is an example of wavelets you might use for a continuous wavelet transform. In this case, you can have a different frequency resolution at different frequencies.
5. Spectra and Time-Frequency Plots:
Spectra: Visual representation of the power (amplitude) of different frequencies present in an EEG signal, typically used for resting state analysis. Peaks in the spectra indicate dominant frequencies.
In the spectra, there is a peak corresponding to each of the frequencies that we put into that simulated EEG. You can also tell from the spectra what the relative amplitudes of the signals are. However, this is not very useful for event-related oscillations.
Time-Frequency Plots: Extend the concept of spectra to show how the power of different frequencies changes over time, making them useful for event-related oscillations. Each column represents a spectrum for a short segment of the EEG. Changes in amplitude are often represented by colour (e.g., red for high, blue for low).
Each spectra corresponds only to a segment of the EEG.
6. Synchrony and Coherence:
These concepts explore whether different brain regions are "cooperating," often inferred by the relationship between oscillations recorded from different electrodes.
Phase-locking: Occurs when the phase of oscillations in different brain areas is consistently related over time (e.g., one wave consistently peaks slightly after another).
Coherence: A broader measure of the consistent relationship between two signals, influenced by both fluctuations in magnitude (amplitude) and phase-locking. Signals can have coherence even without perfect phase-locking if their amplitudes increase and decrease together.
Coherence is related to the Pearson's correlation coefficient.
7. Phase-Locking Factor (or Value):
Quantifies the consistency of phase oscillations across different electrodes (presumably reflecting different brain areas).
8. Inter-Trial Coherence:
Measures the consistency of phase locking of the signal at the same electrode across successive trials (e.g., repeated presentations of a stimulus).
Related to event-related potentials (ERPs).
An increase in inter-trial coherence could result from an increase in phase-locked oscillations or a reduction in non-phase-locked oscillations.
However, if there's both phase-locked and non-phase-locked oscillations, an increase in inter-trial coherence could be due to a reduction in the non-phase-locked oscillations, and not necessarily an increase in the phase-locked ones.
9. Spatial vs. Temporal Resolution of EEG:
While EEG has excellent temporal resolution (ability to detect rapid changes in brain activity over time), its spatial resolution (ability to pinpoint the precise location of brain activity) is limited, even with advanced source localization methods, and will not reach the level of fMRI.
⚠ Spatial resolution of EEG, even with the best source localization methods, will never approach that of fMRI. However, the temporal resolution of EEG is unmatched, which is one of the reasons why it is such a useful research tool.