week 5; regression
Regression
One of the most common analyses in research
general point is to predict one variable based on one or more other variables
Correlations
gives us an estimate of the extent to which two variables fluctuate together - co-vary
they can both be continuous or categorical, but we are only focusing on continuous
Limitations of correlations
correlation does not equal causation
what should we predict happen if someone improves their variable on one of the axis by 1 point?
simple linear regression
This is a mathematical equation (of a line) that uses a value of X to predict the value of Y
A regression equation allows us to predict specific y values from given x values
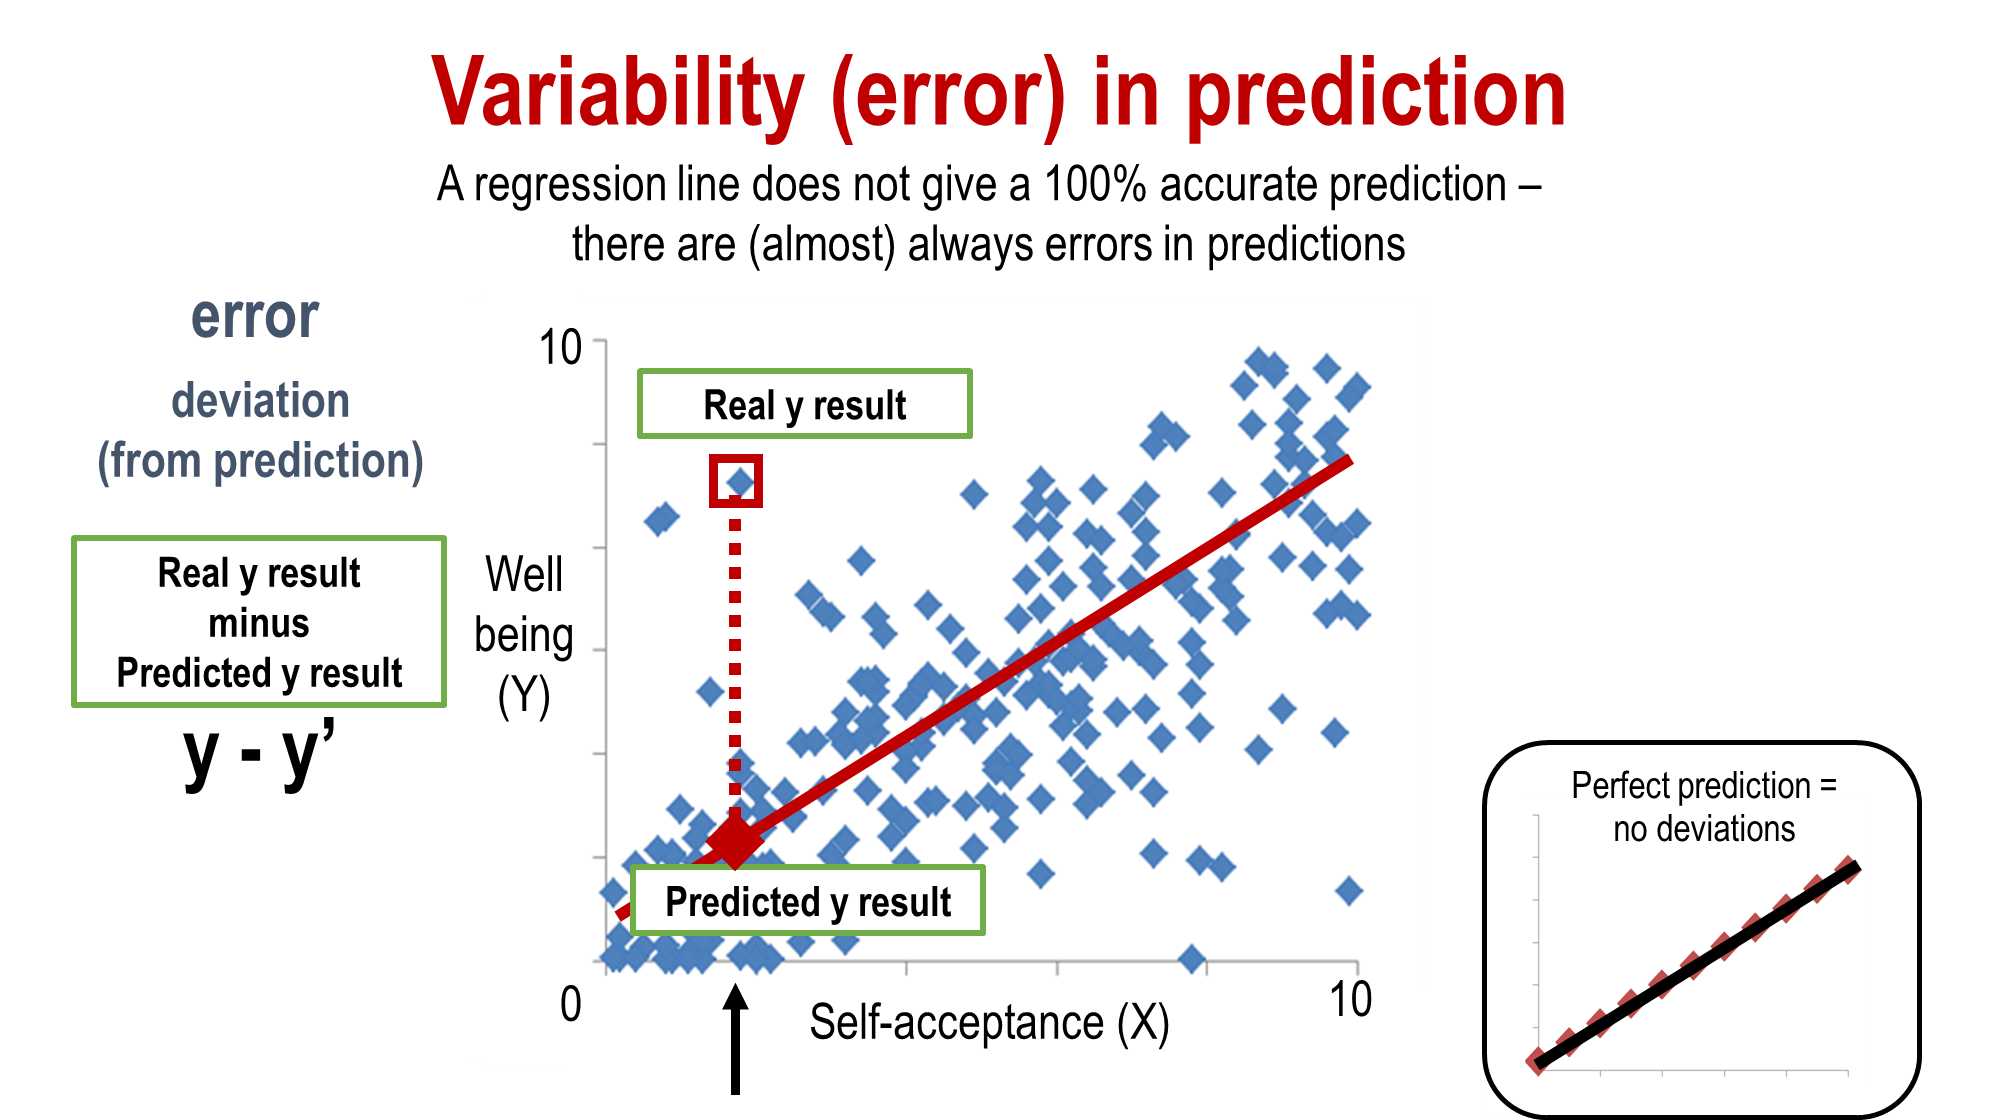
is this prediction entirely accurate?
no but it gives us the best estimate given our dataset. it is meant to minimise errors
A regression equation
output = predicted variable values (y’), SPSS labels this the dependent variable
input = predictor variable values (x’), SPSS labels this the independent variable
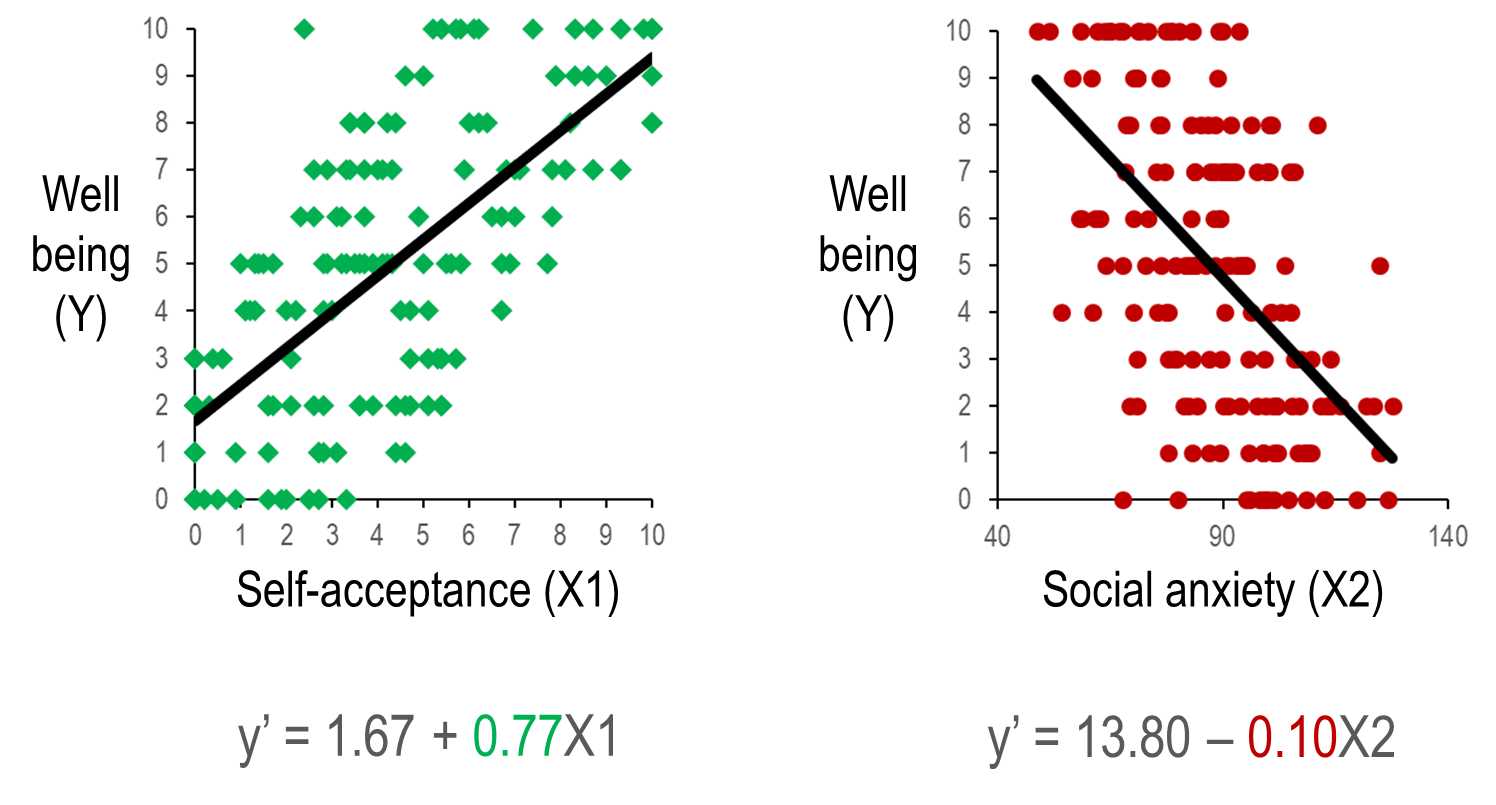
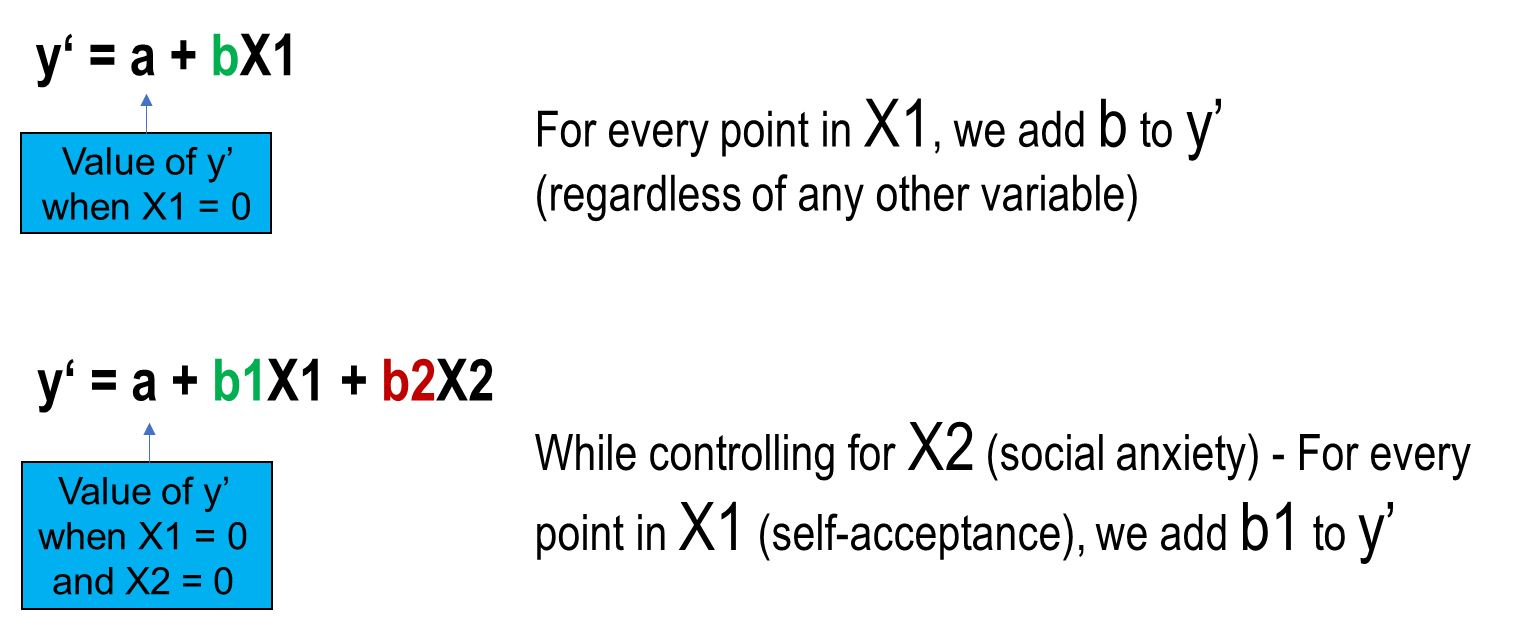
y’= a + b X
a= intercept
b= slope
a= (the mean of y) - (b x the mean of x), a tells us that for X=0, we predict Y= ___, a in SPSS is the constant value
b = r x sy/ sx, b tells us that for ever 1 point increase in the x axis, we predict an increase of ___ of the y axis, in SPSS b is the x axis variable
r= relational value
s= the standard deviation of (x or y), which we can get from SPSS
Regression Part II: Variability and hypothesis testing
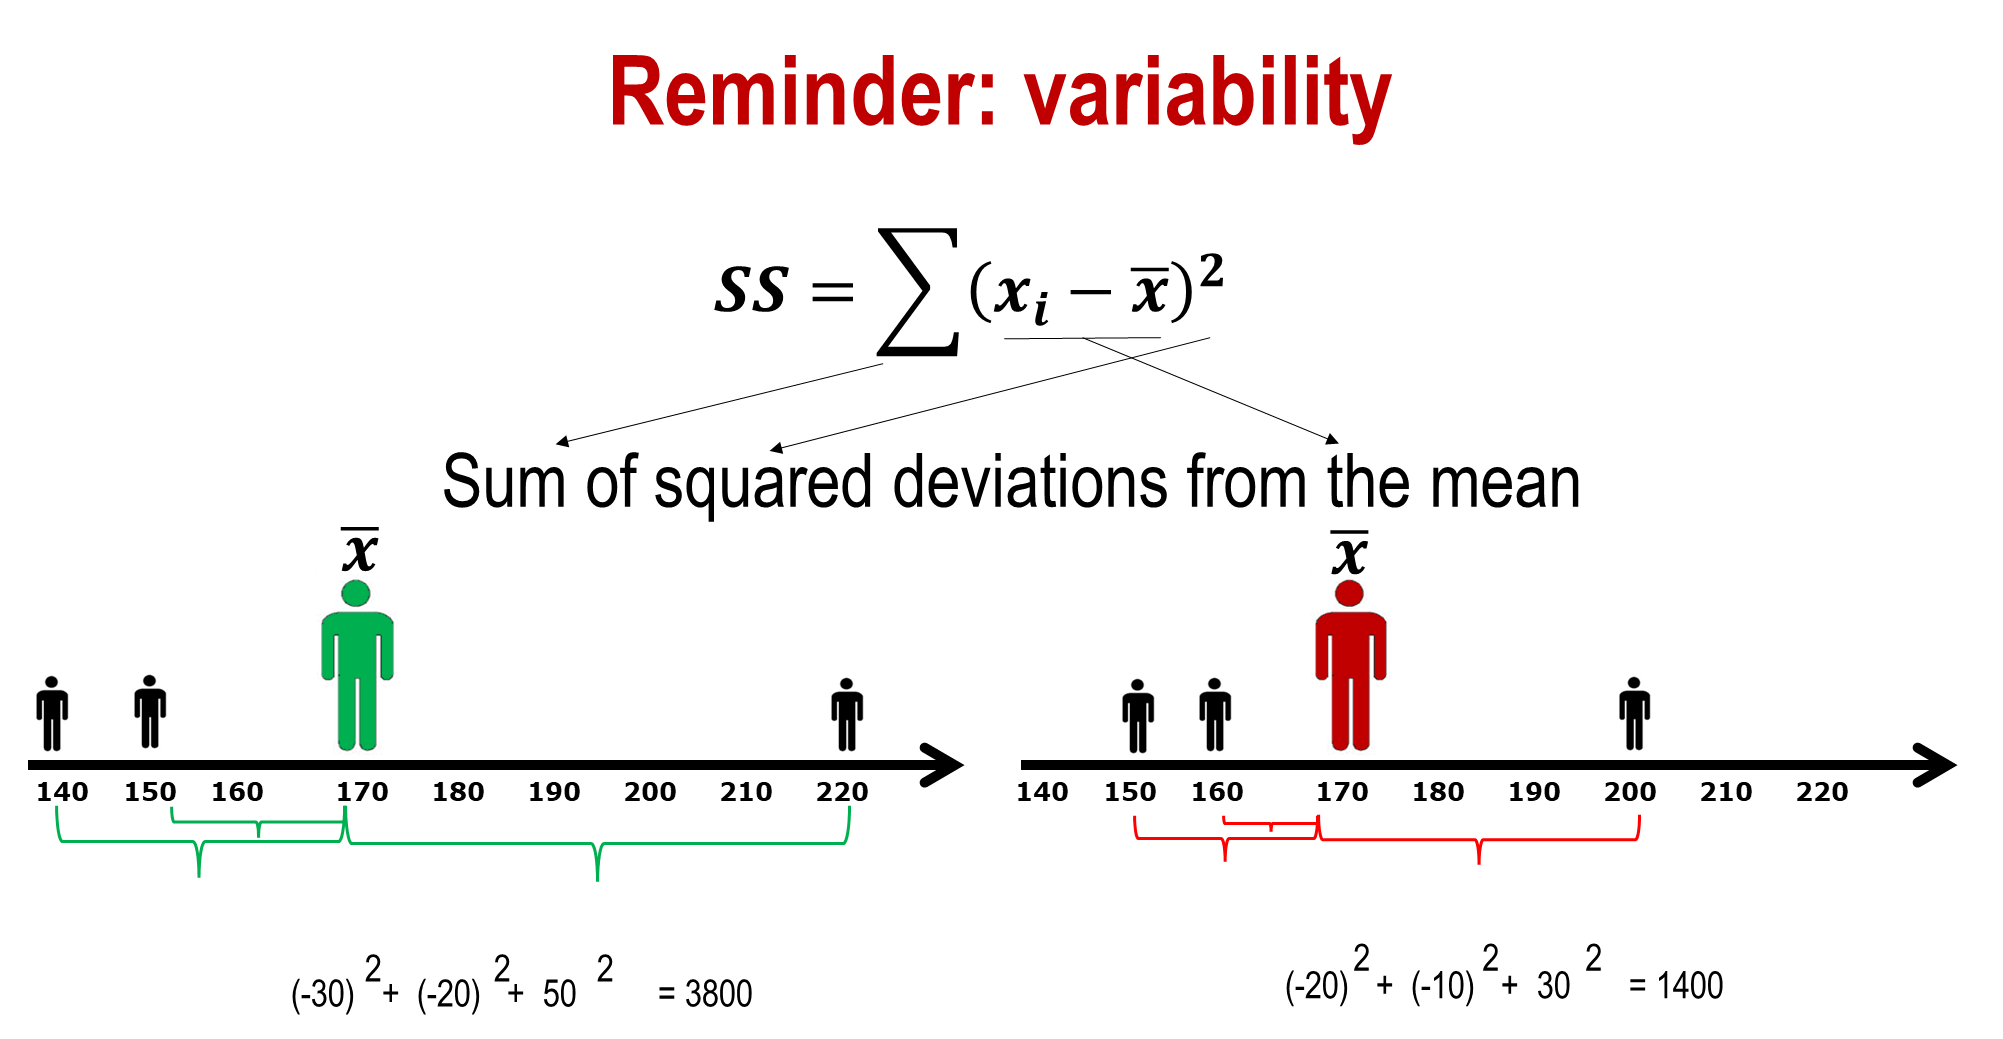
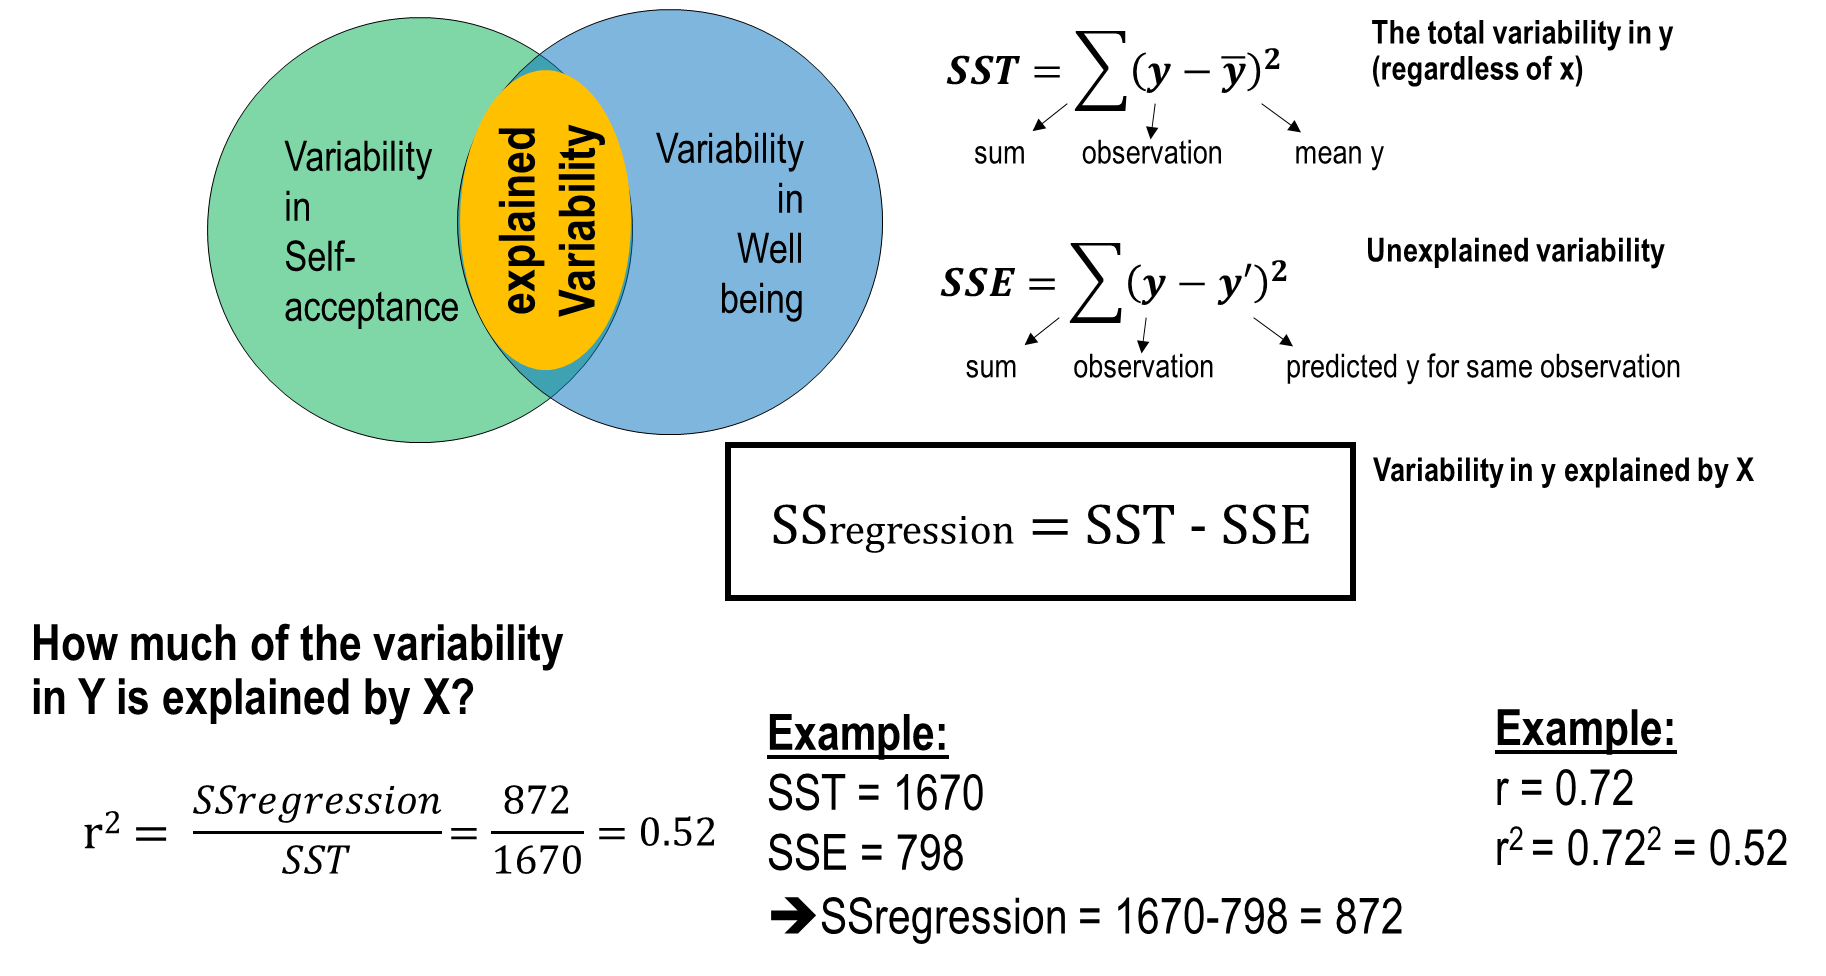
variability
Sum of squared deviations from the mean
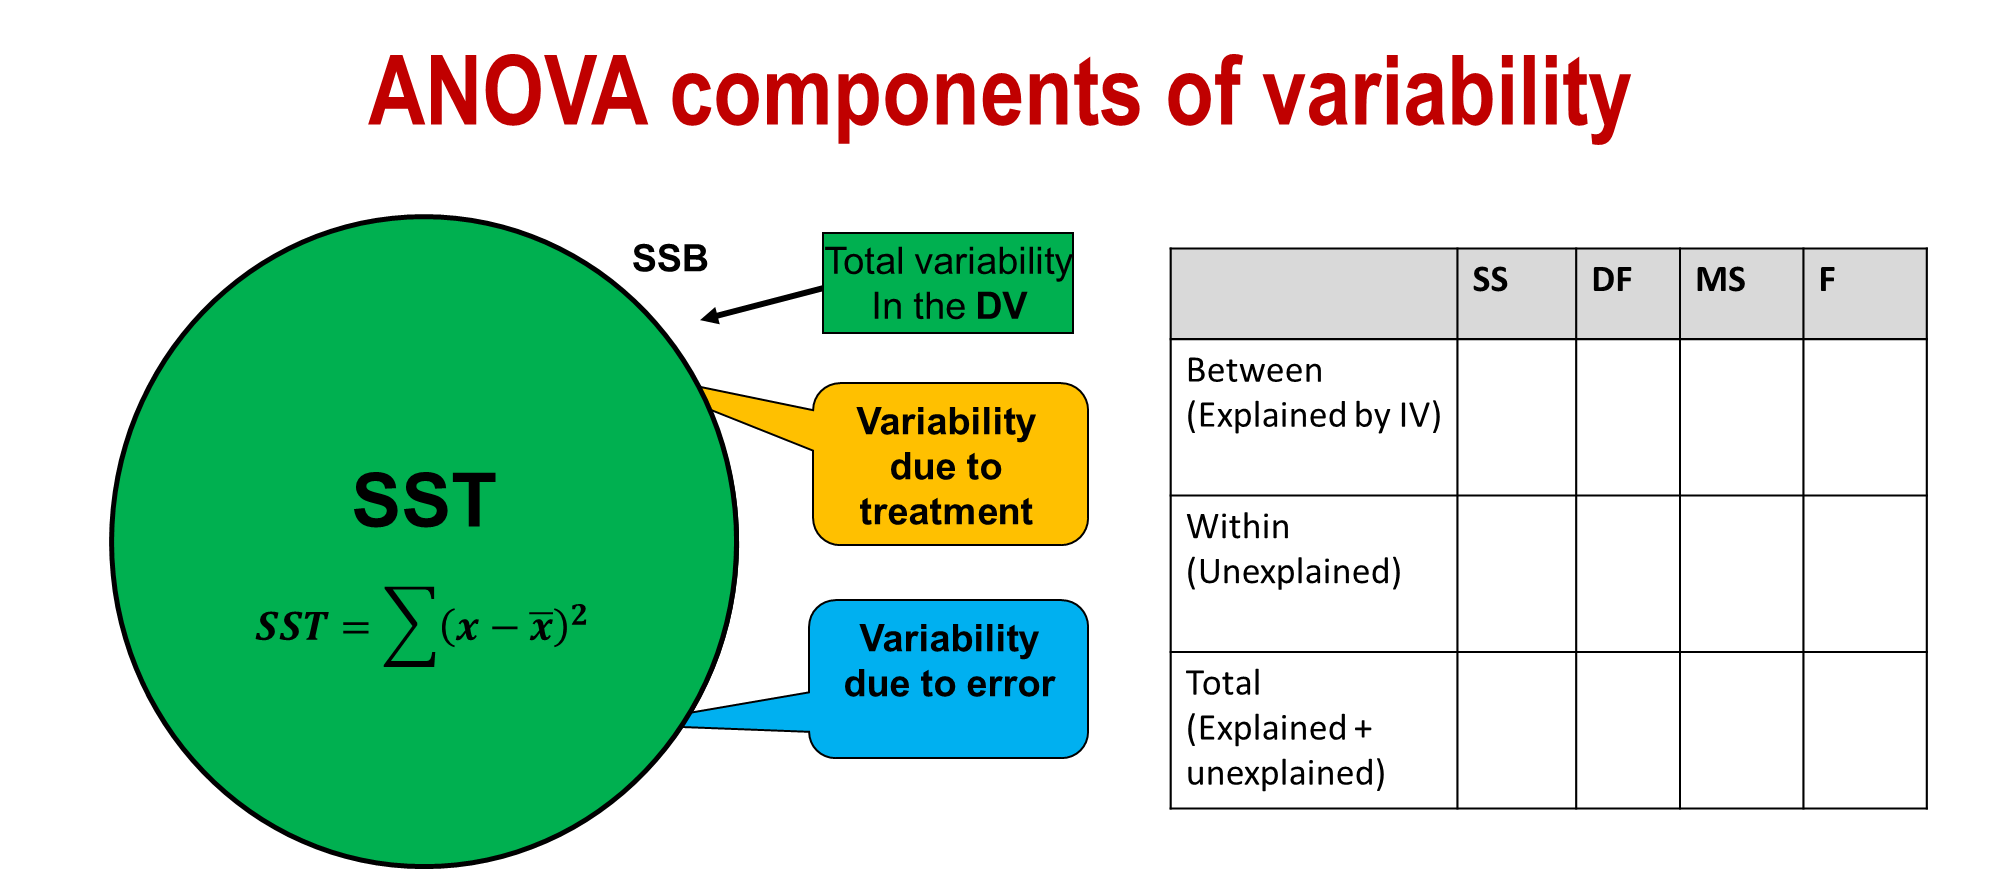
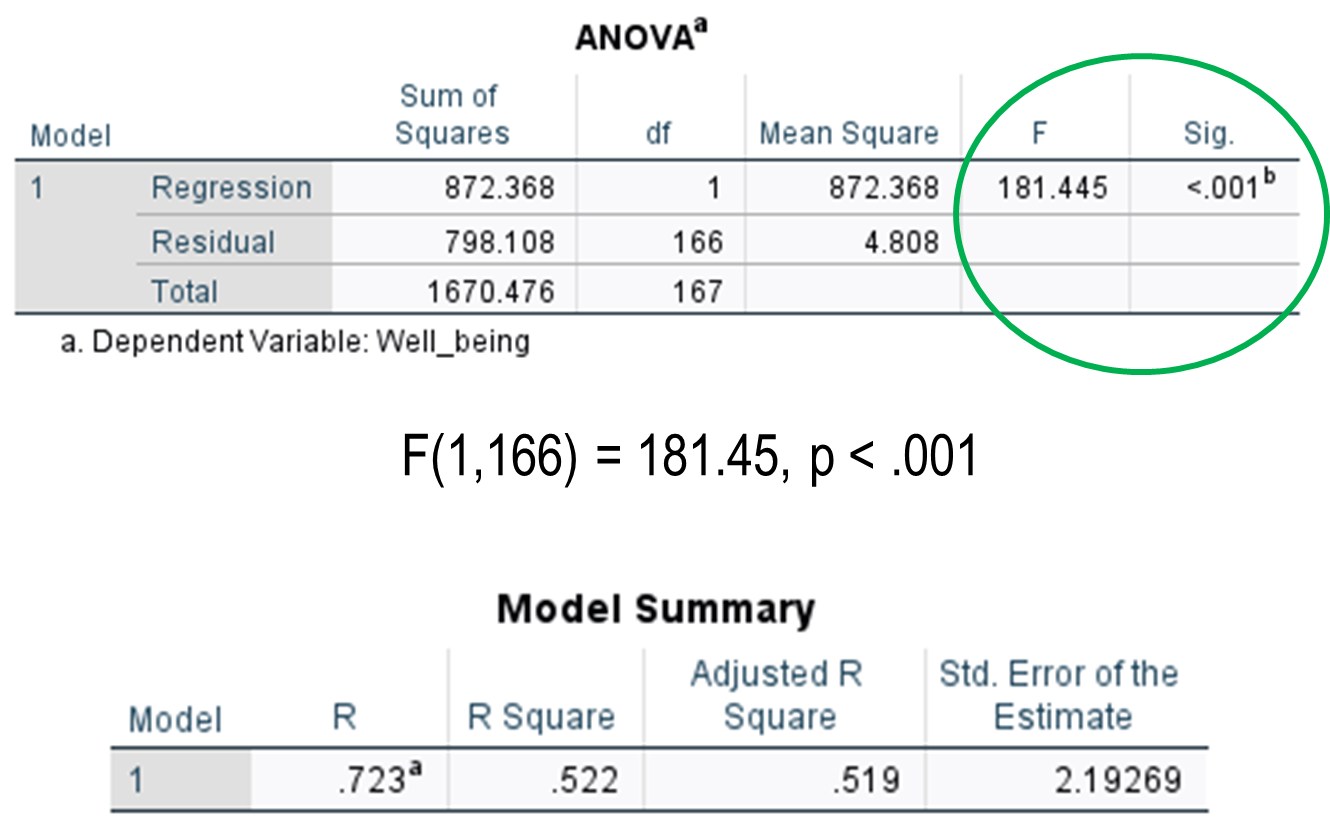
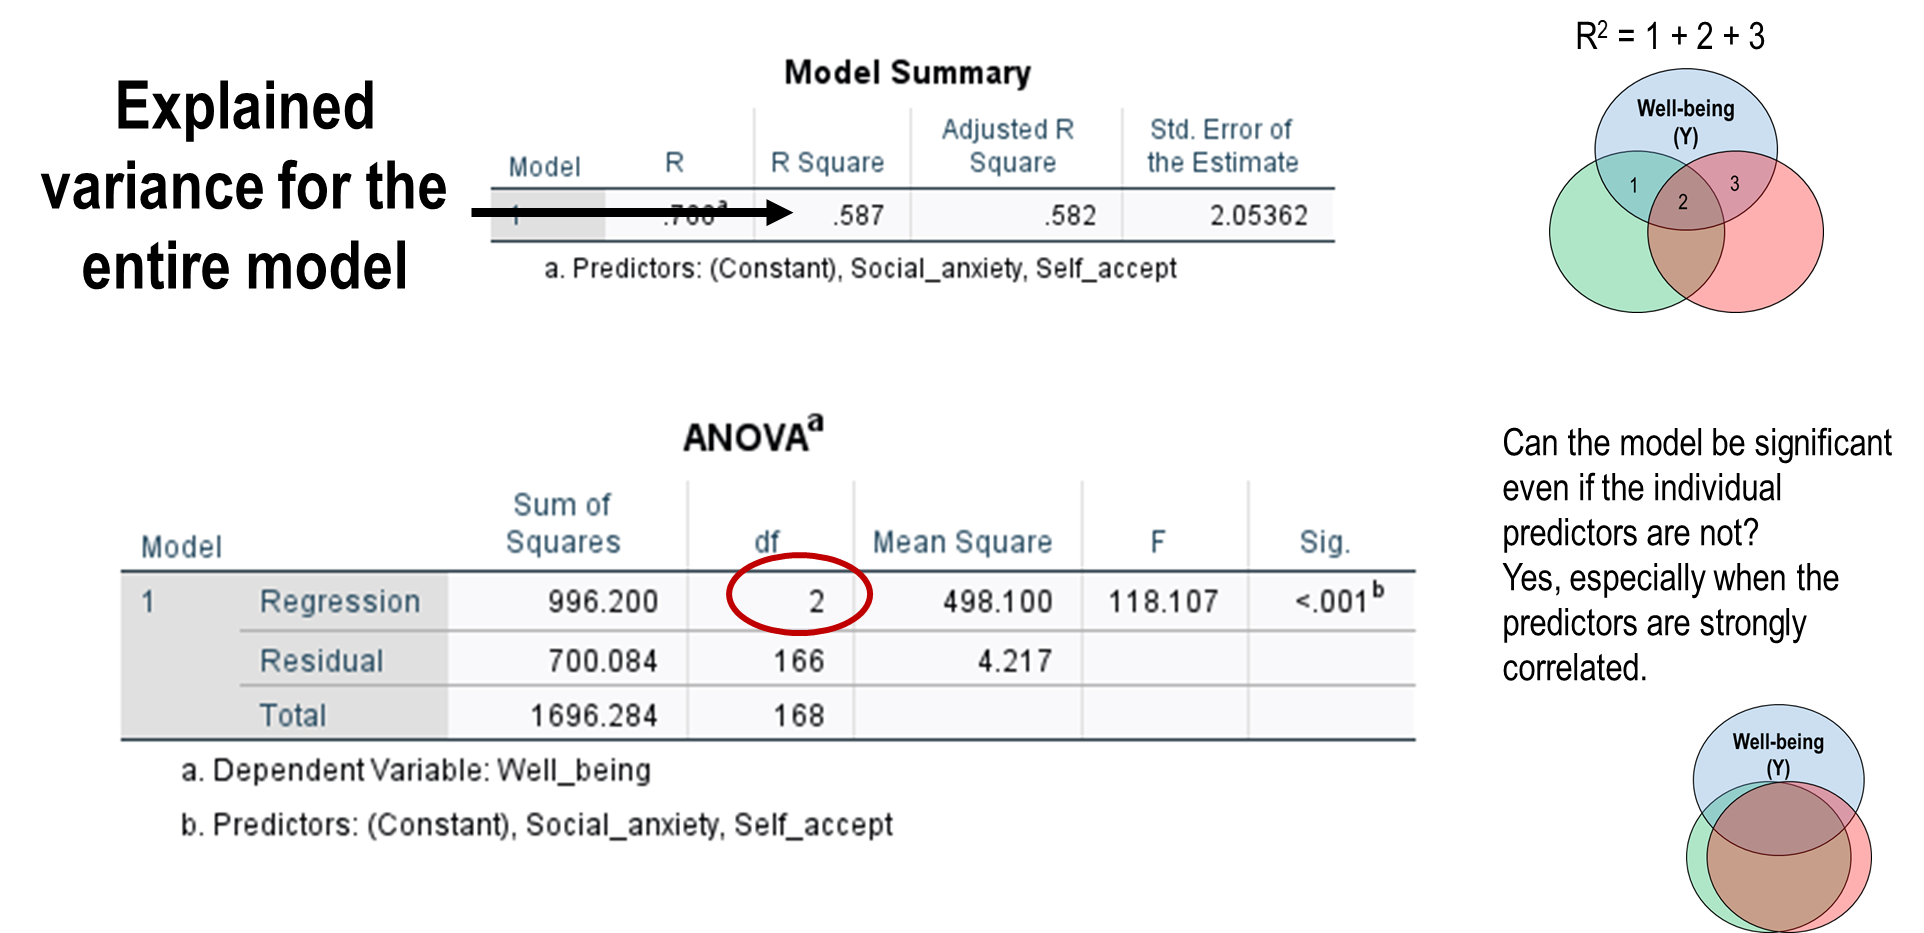
ANOVA components of variability
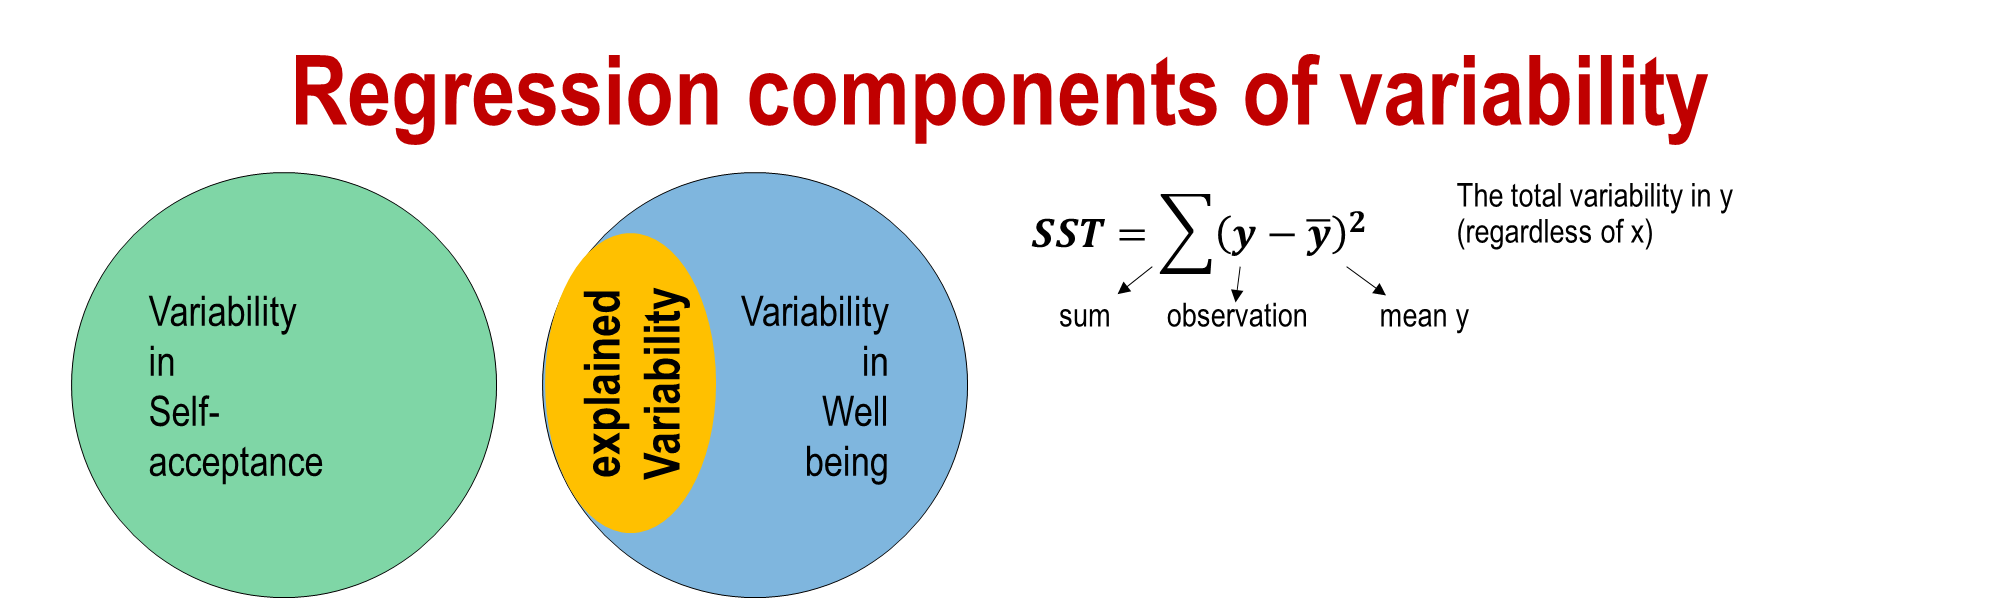
Regression component of variability
Variability (error) in prediction
Regression components of variability
Hypothesis testing
so far the results we get describe our sample, but what can we conclude about the population?
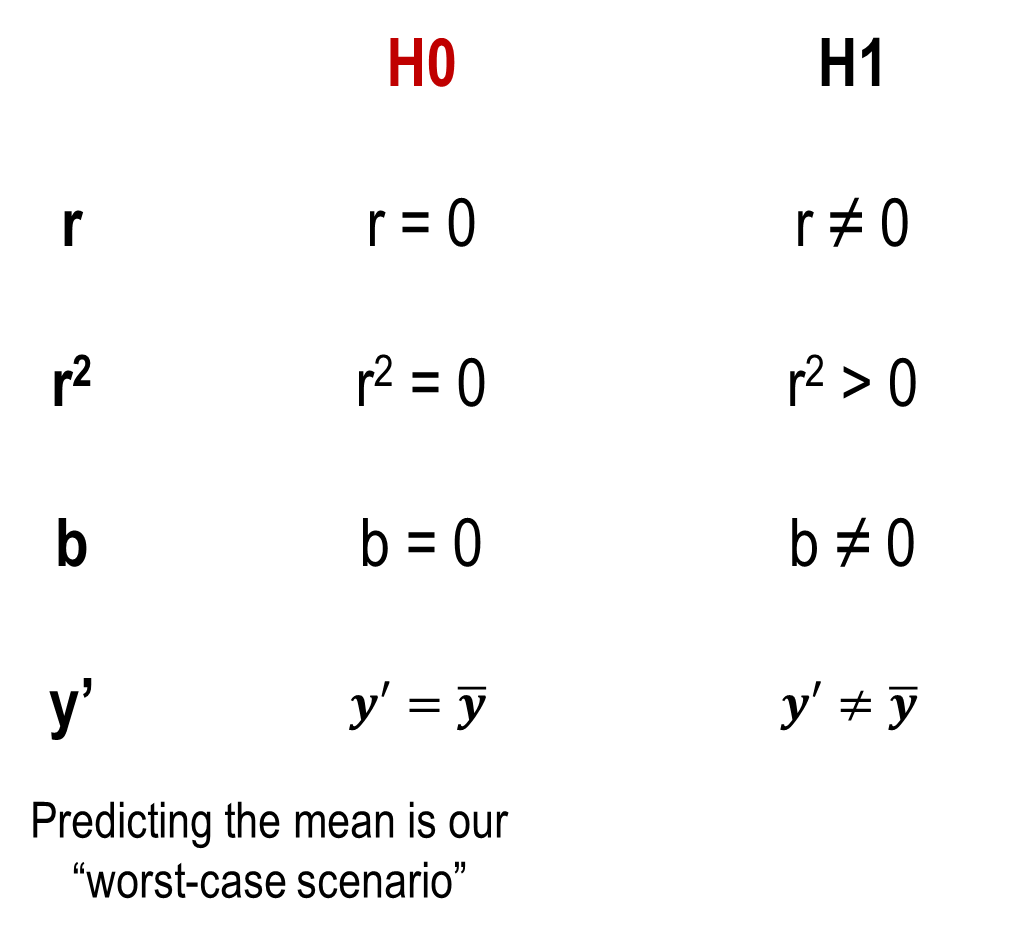

Rejecting the null hypothesis means that:
there is a correlation between the two variables
the regression model accounts for variability in y in the population
the regression slope is different from 0
our regression model improved our prediction ability (beyond the mean of Y)

Regression part III- assumptions
assumption 1 - Y is measured on a continuous scale
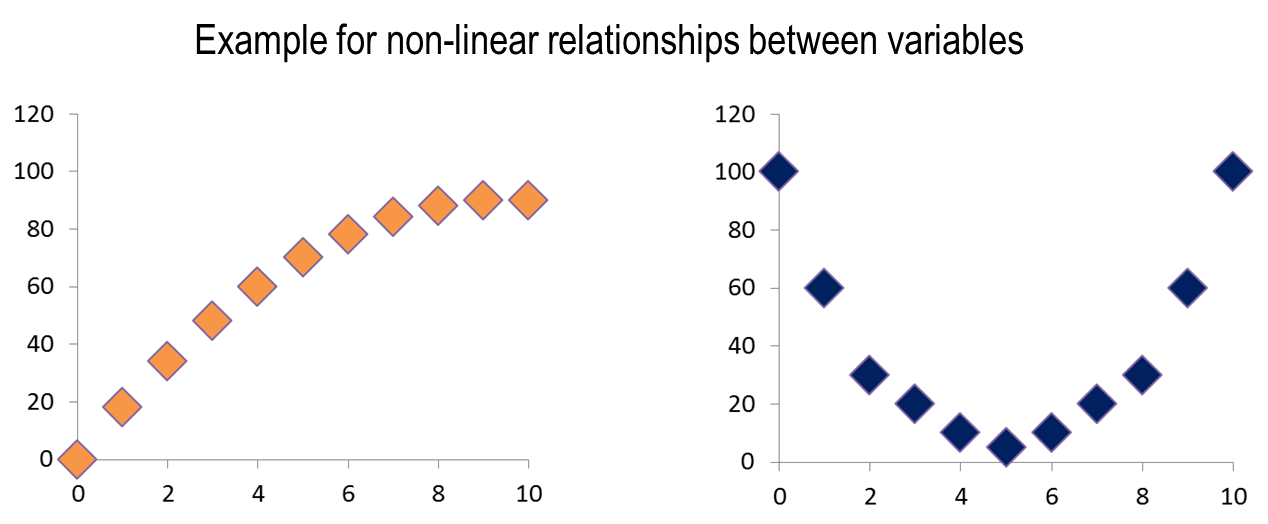
assumption 2 - the relationship we are trying to describe is linear
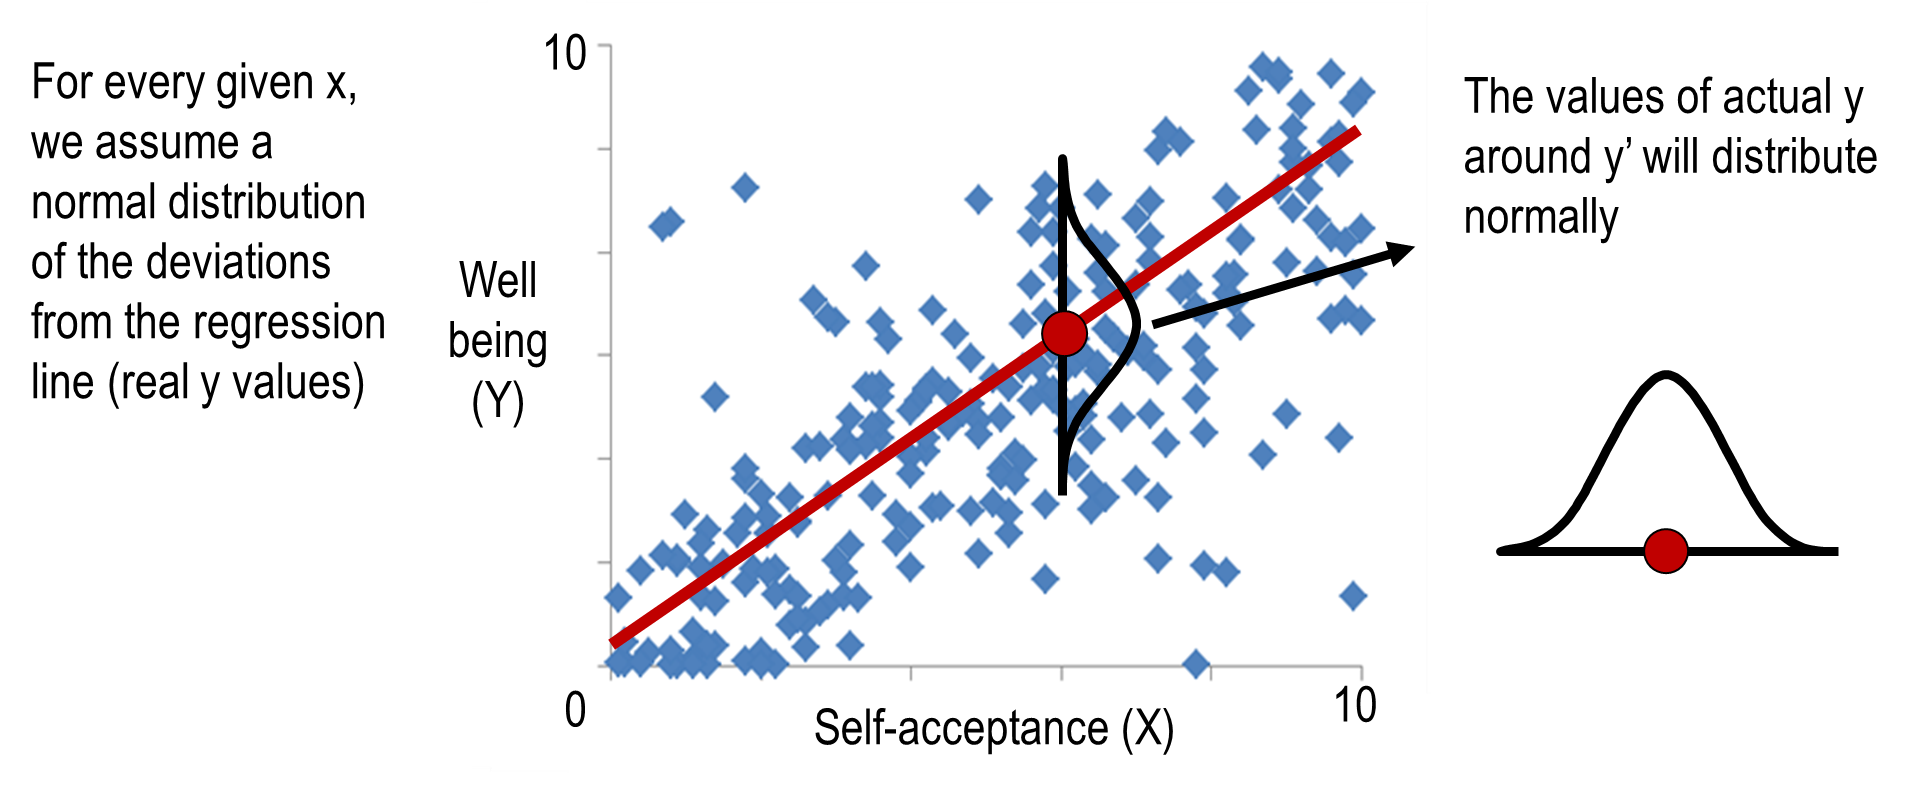
Assumption 3- normal distribution of deviations (errors)
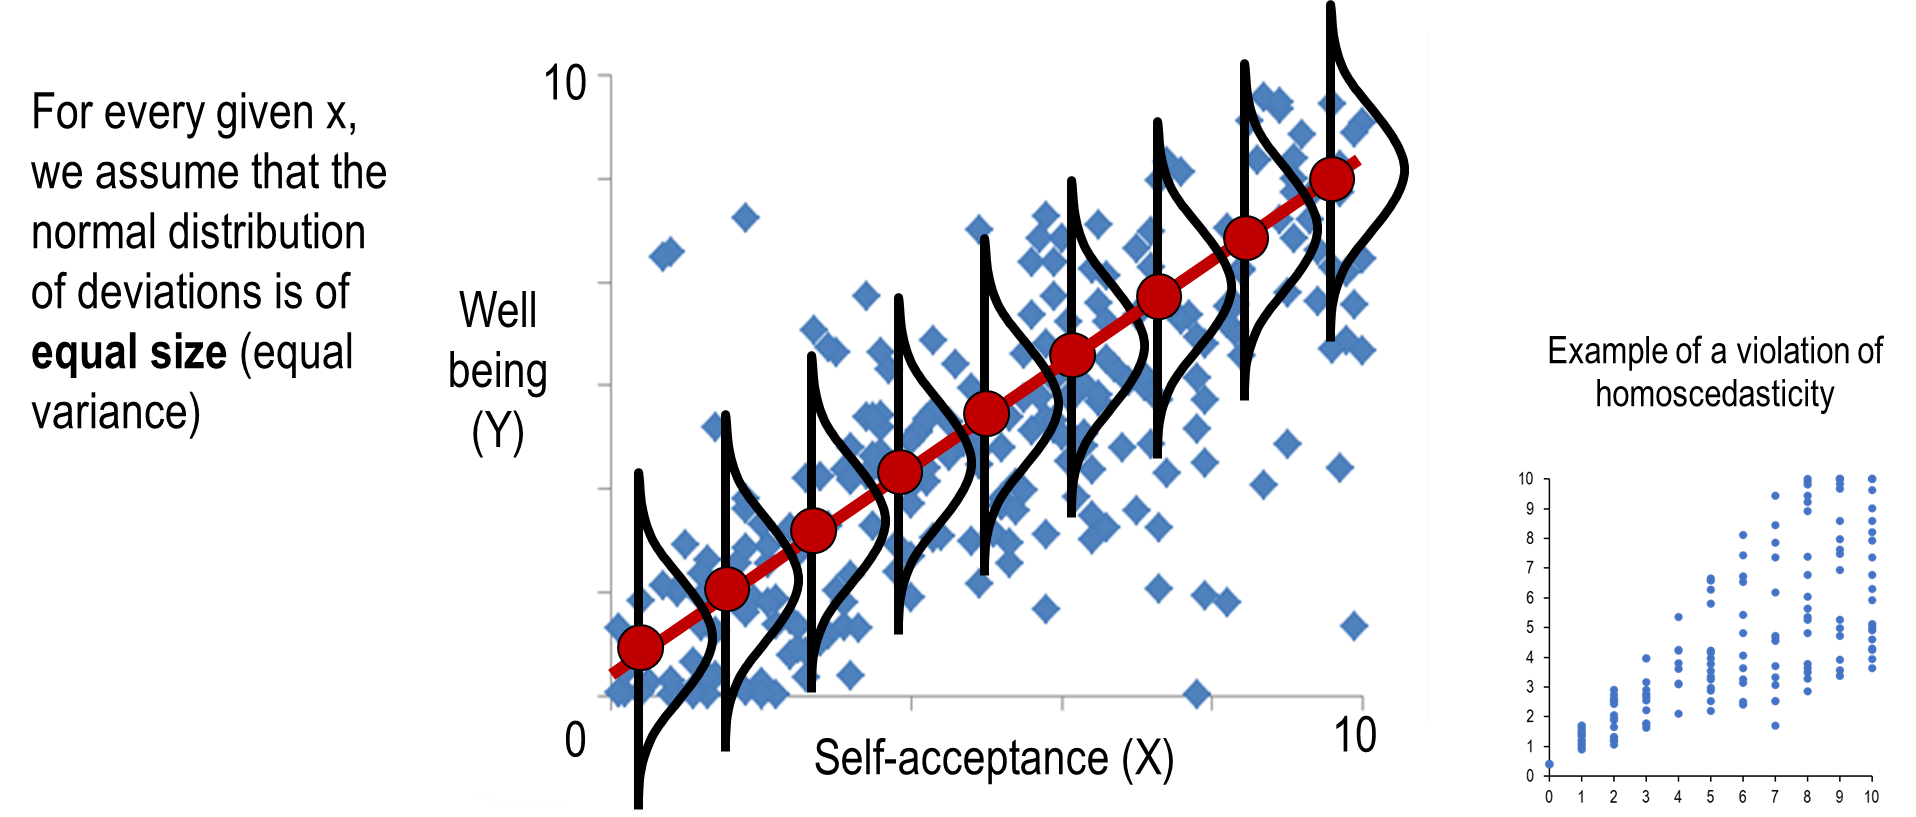
Assumption 4- equal variance of deviations (homoscedasticity)
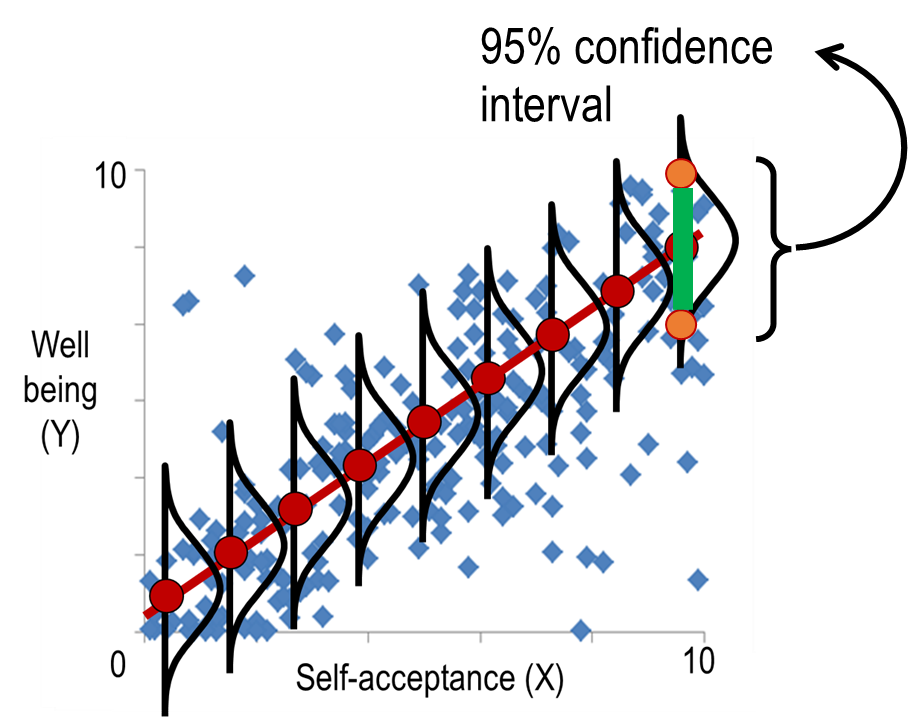
confidence interval (not for the test)
Sometimes we want to predict a range of values to reflect our confidence in the prediction.
When the assumptions of normal distribution and homoscedasticity are met, we can predict a range of values with a certain degree of confidence, rather than a specific value.
For example, for the highest level of self-acceptance, we predict with 95% confidence that y will be between 6-10.
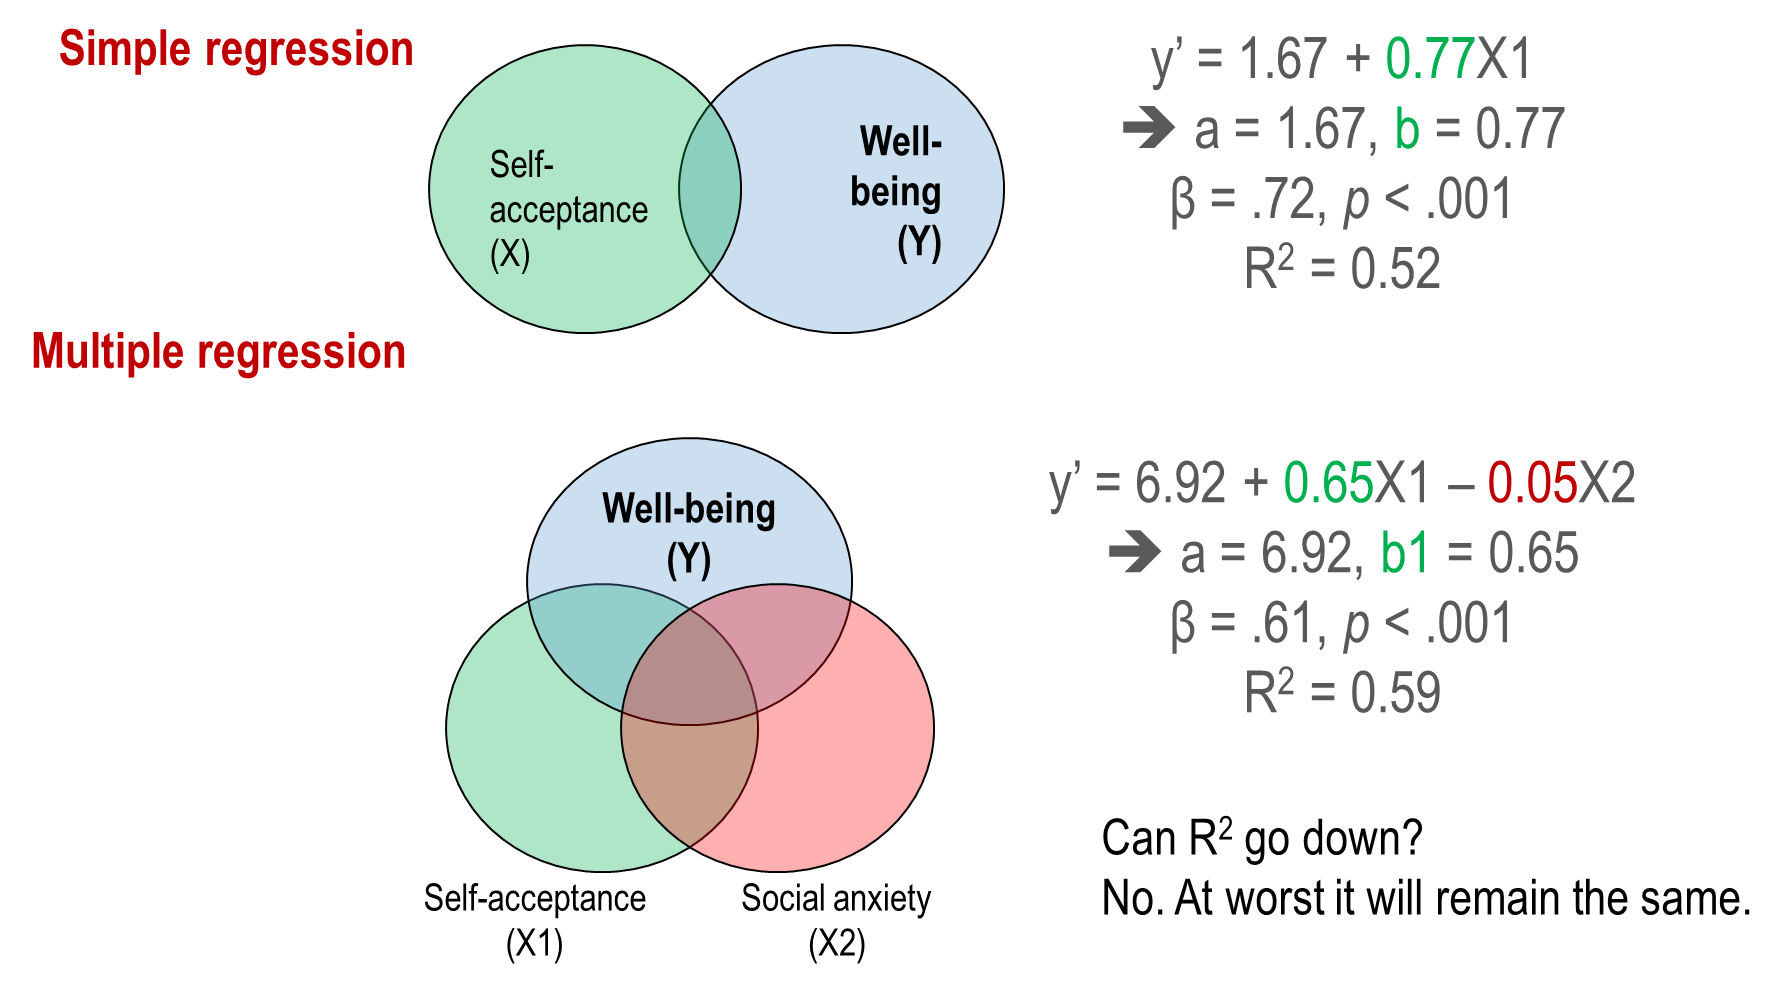
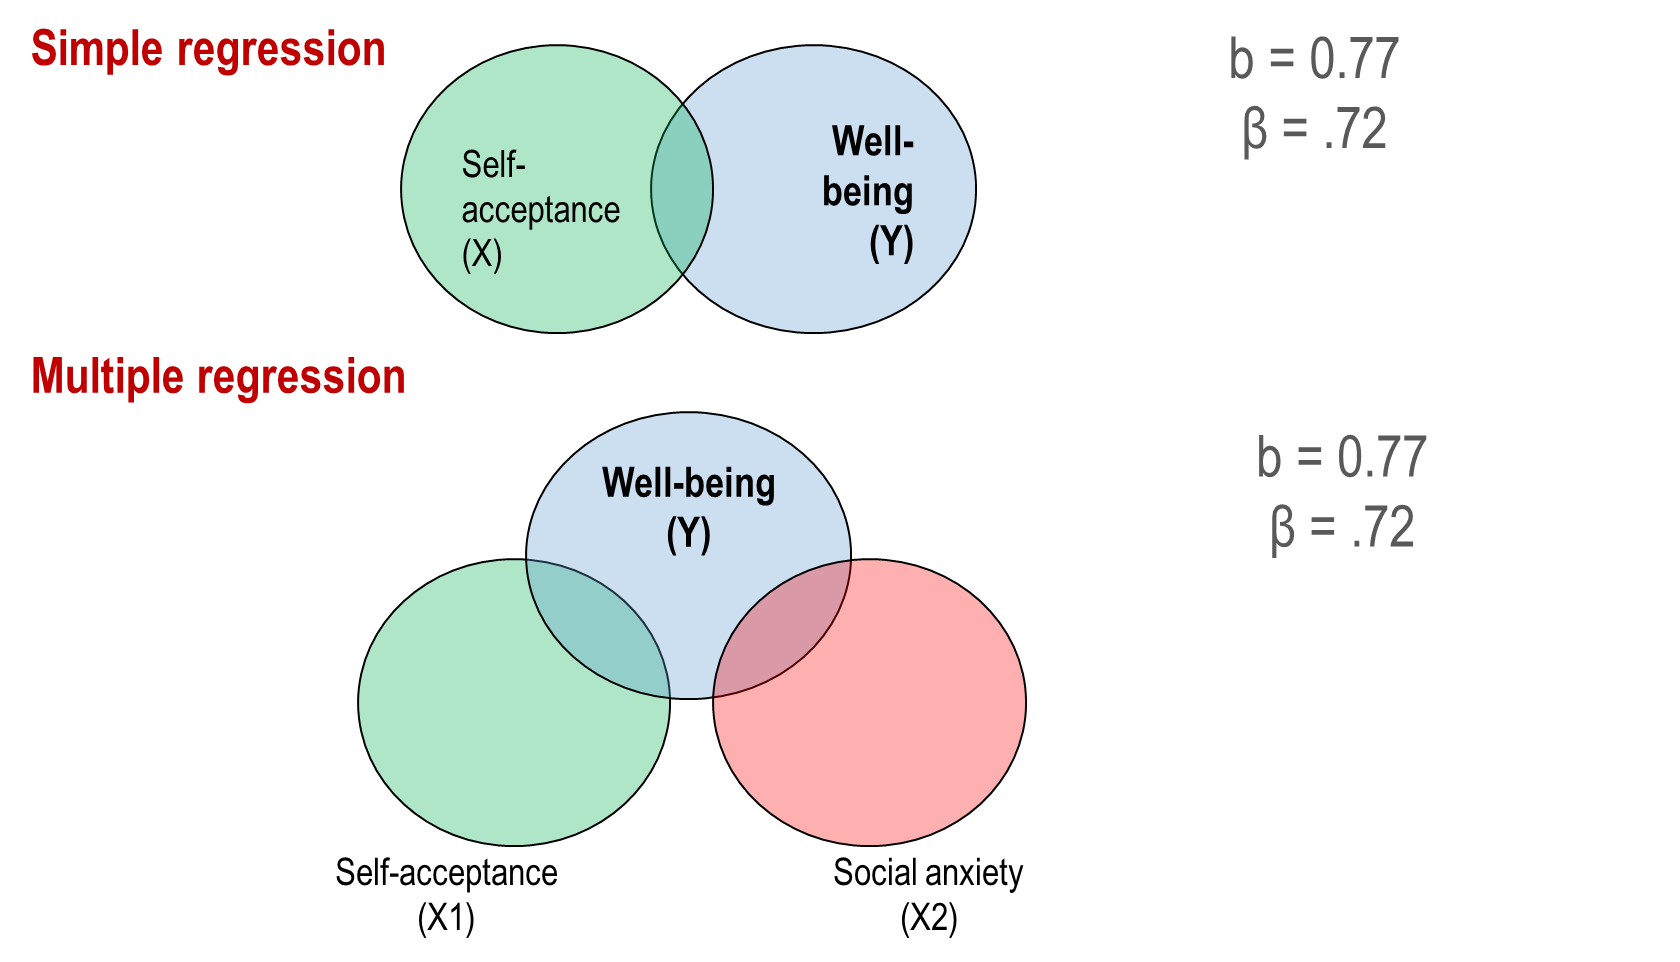
Regression part IV: multiple regression
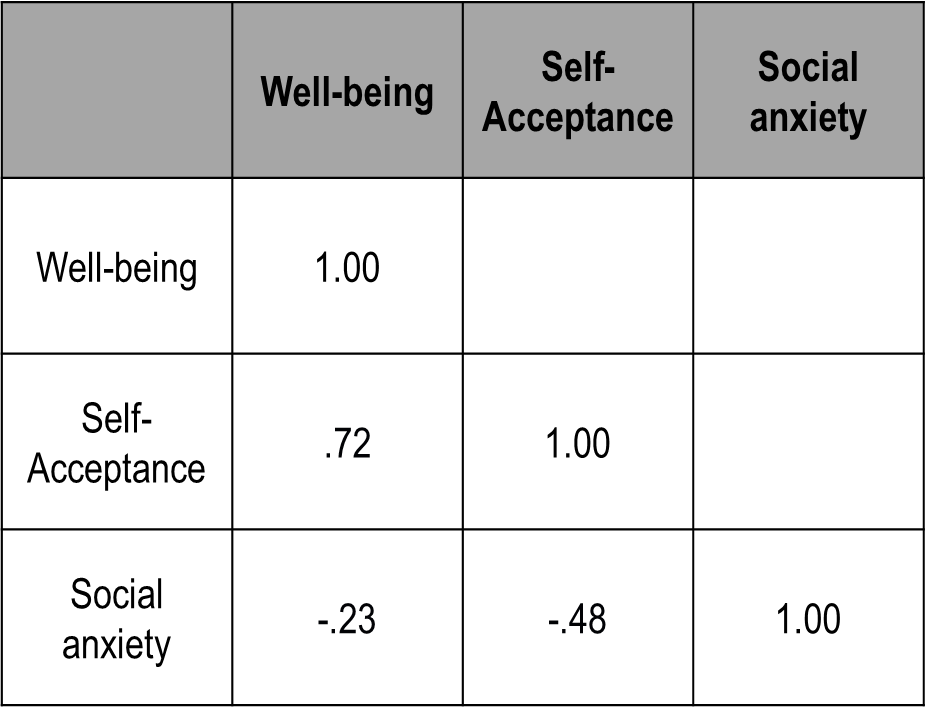
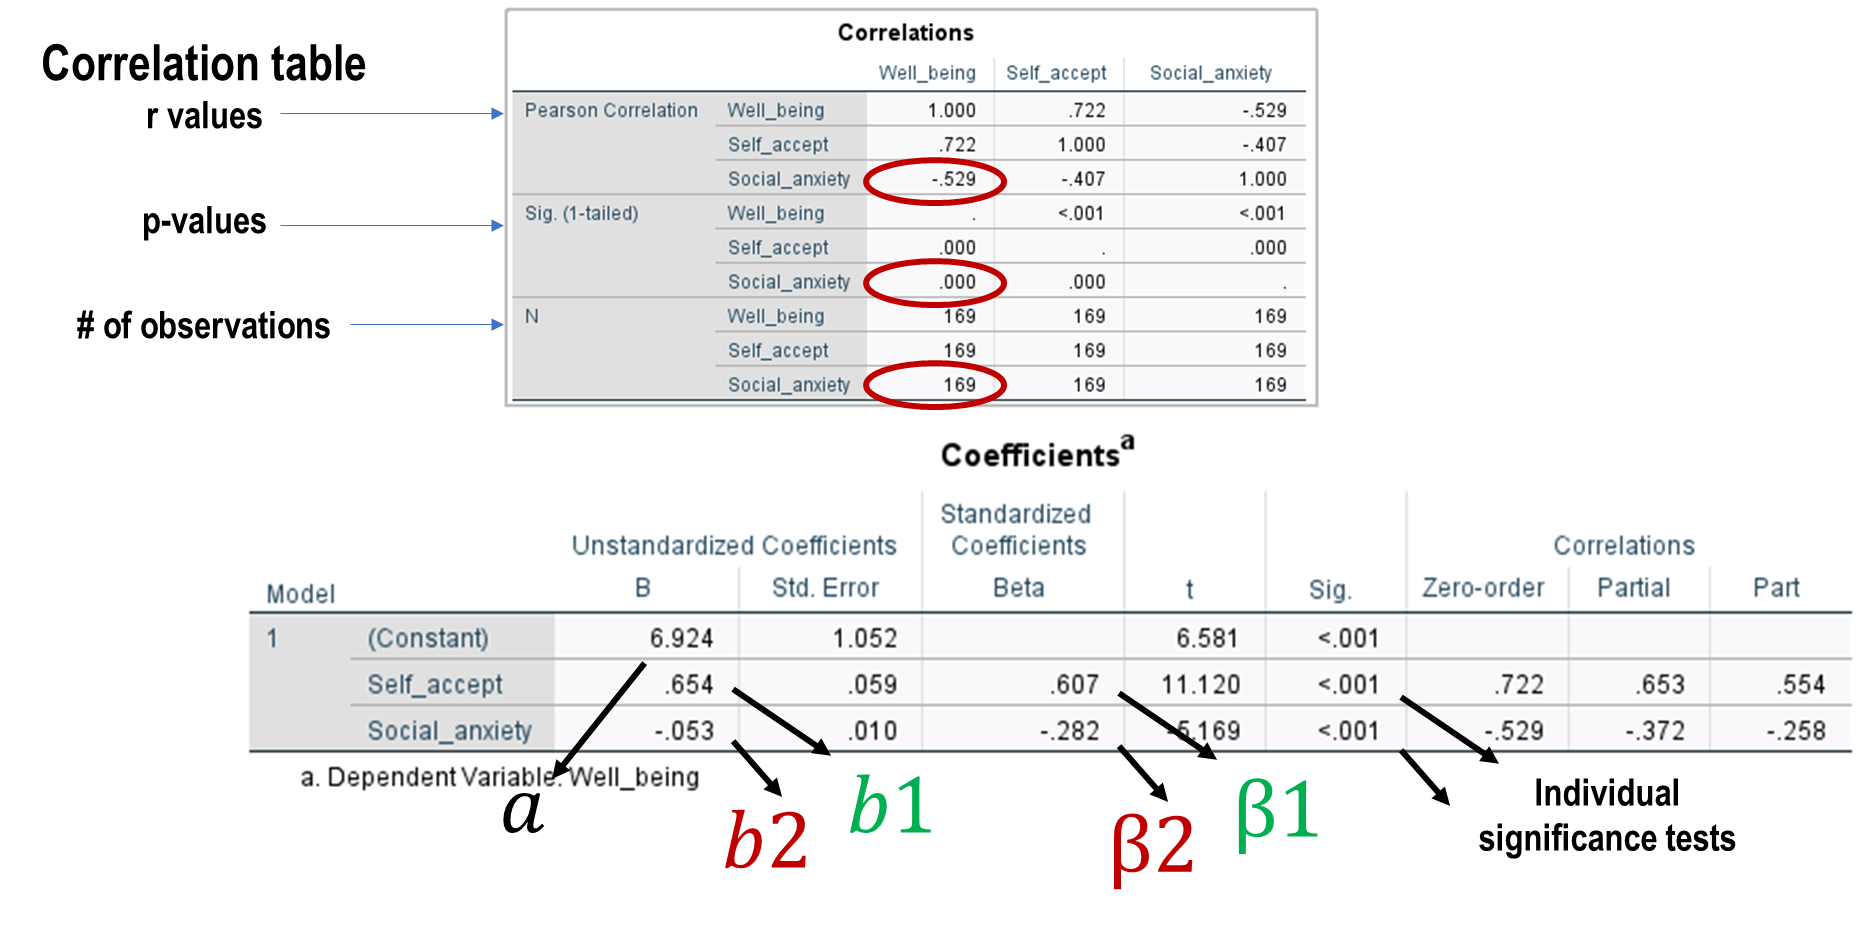
correlation matrix
standardised regression
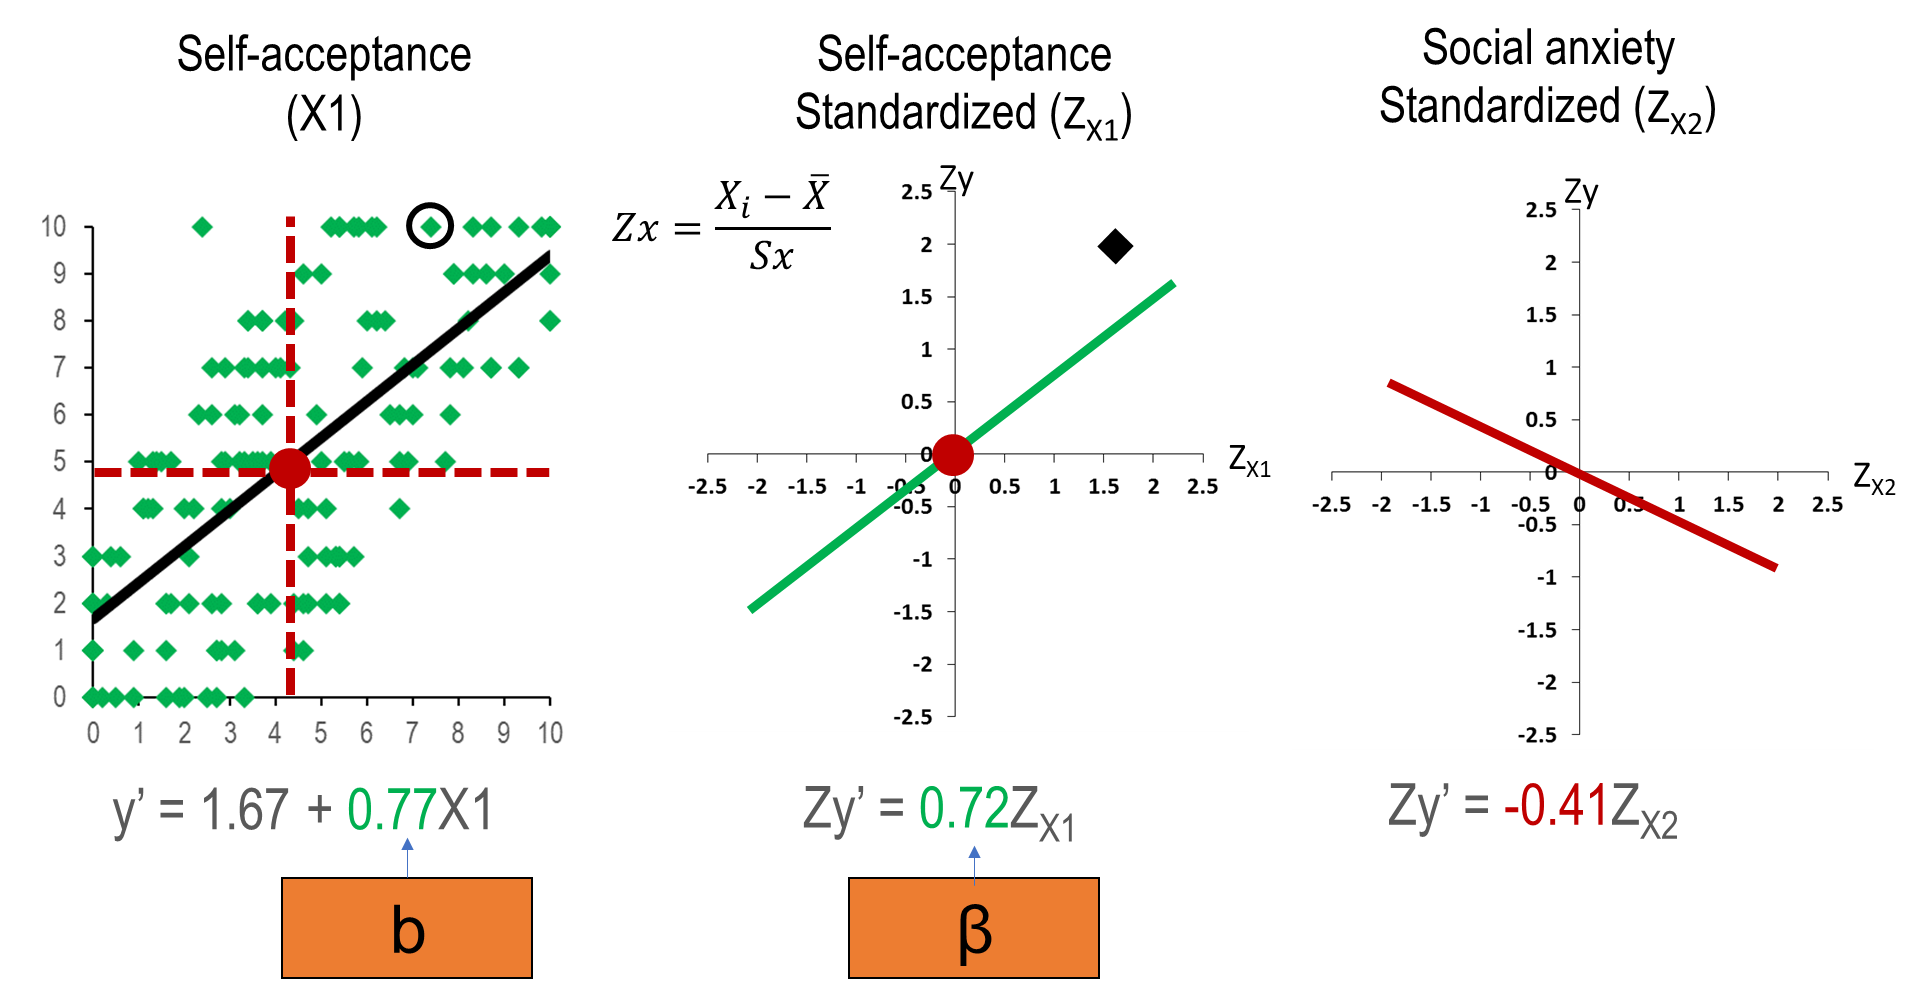
Relationship between variables
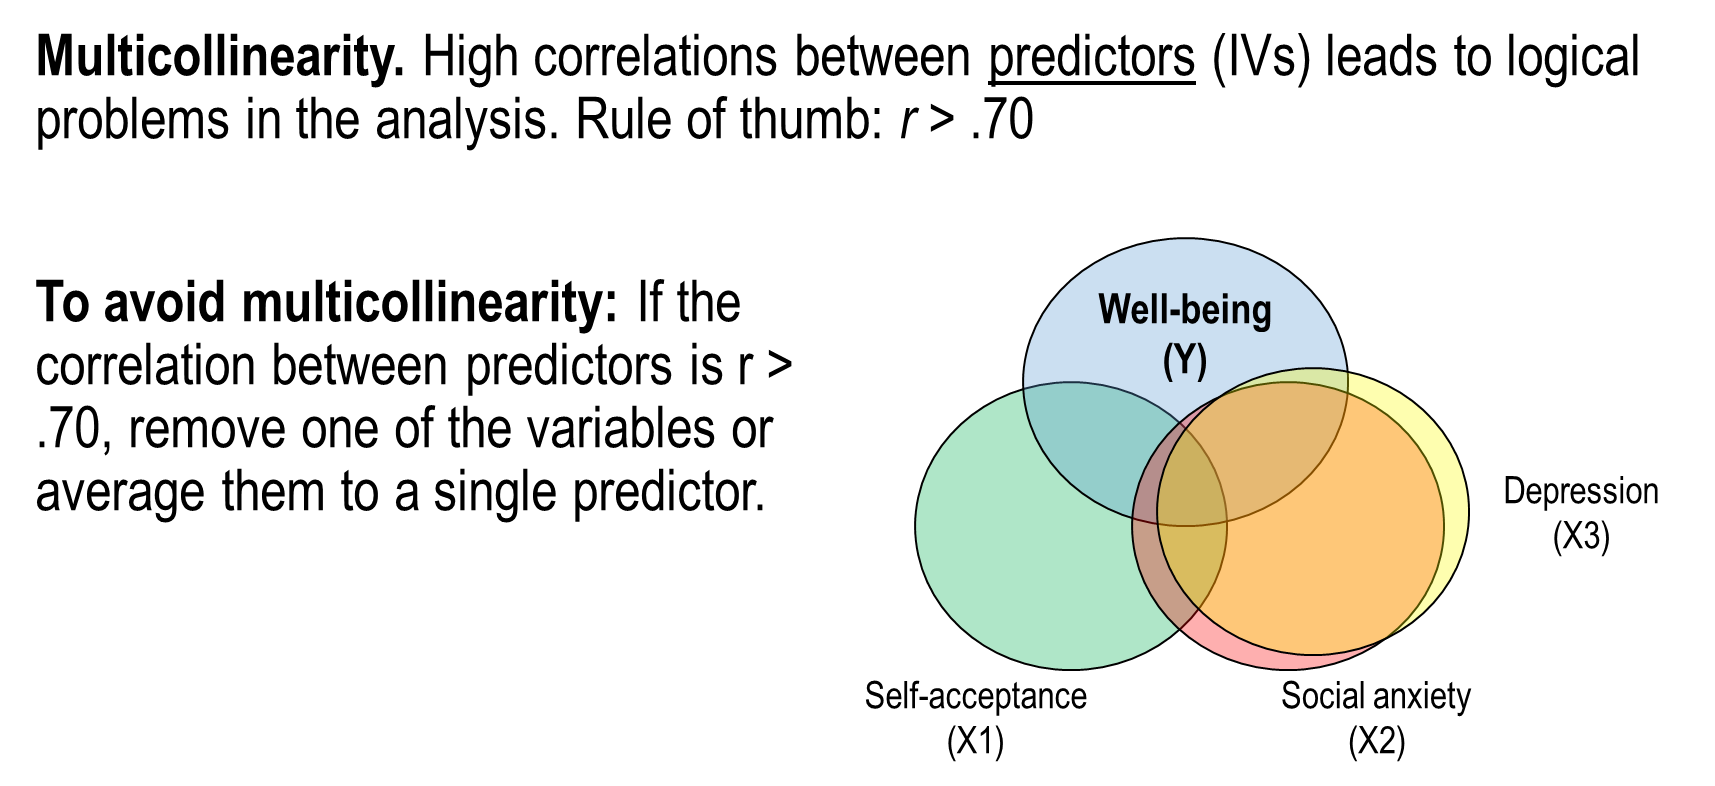
Assumption 5: lack of multicollinearity
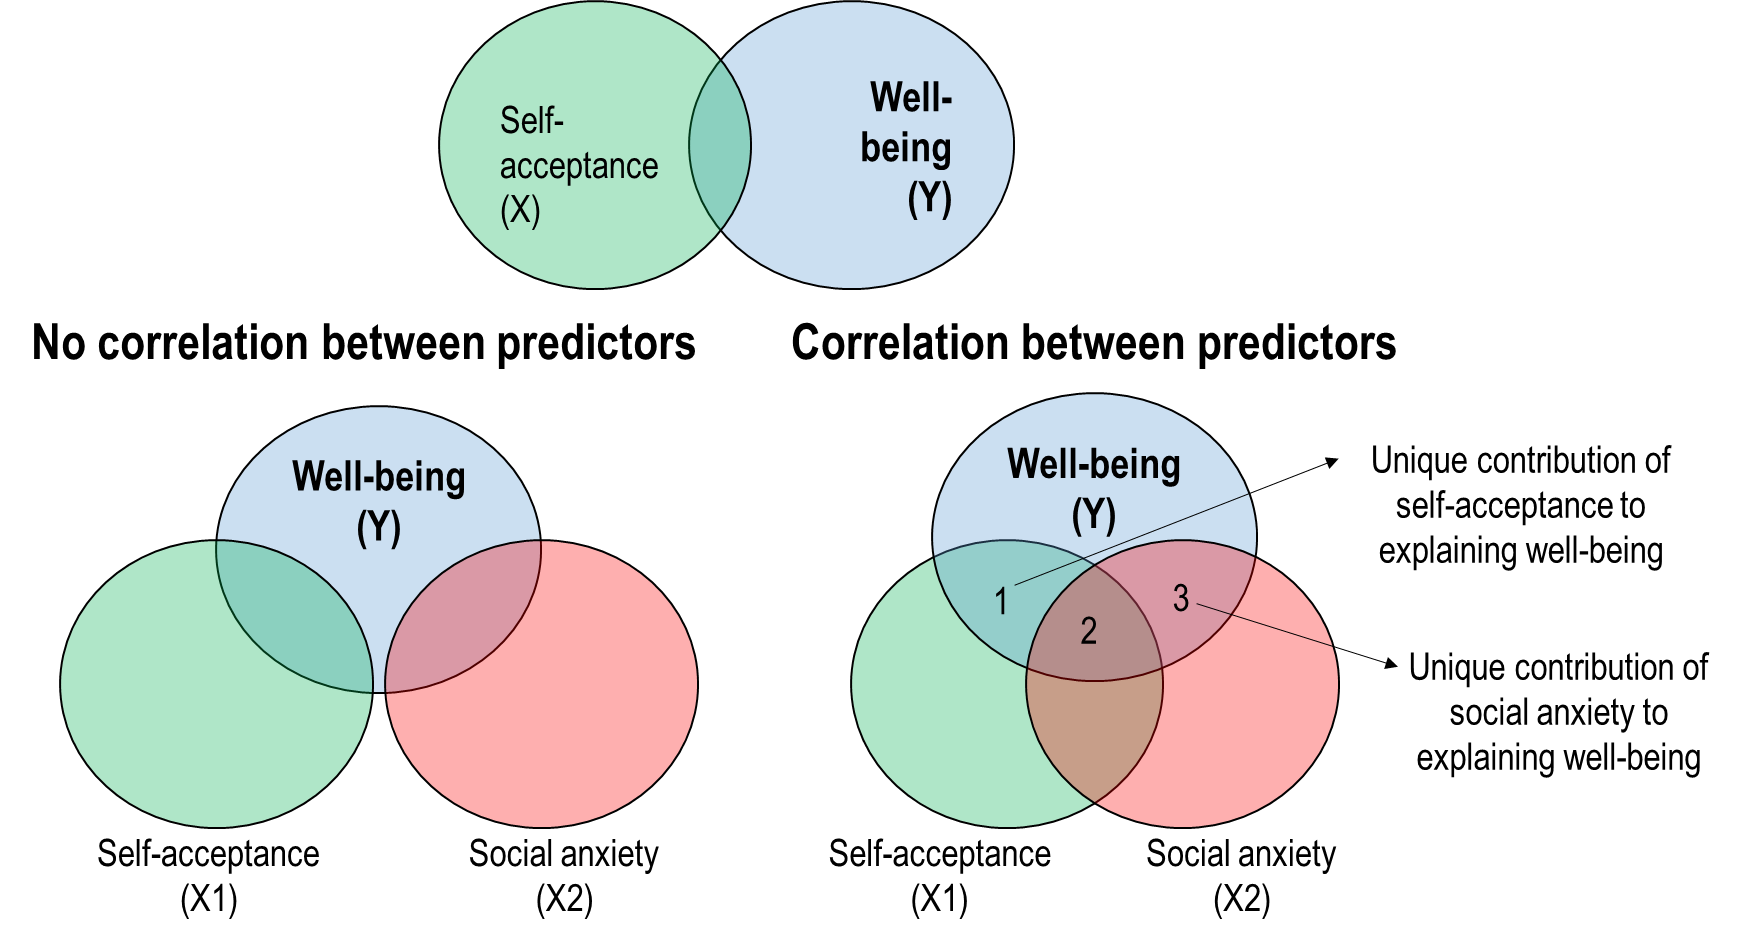
Controlling for other variables
controlling= including in the regression model = ensuring unique contribution
other examples:
The benefit of education to employability while controlling SES = the unique contribution of education, uncontaminated by SES
The benefit of coffee to health while controlling smoking = the unique contribution of coffee, uncontaminated by smoking
controlling explanation:
SPSS tests for individual predictors
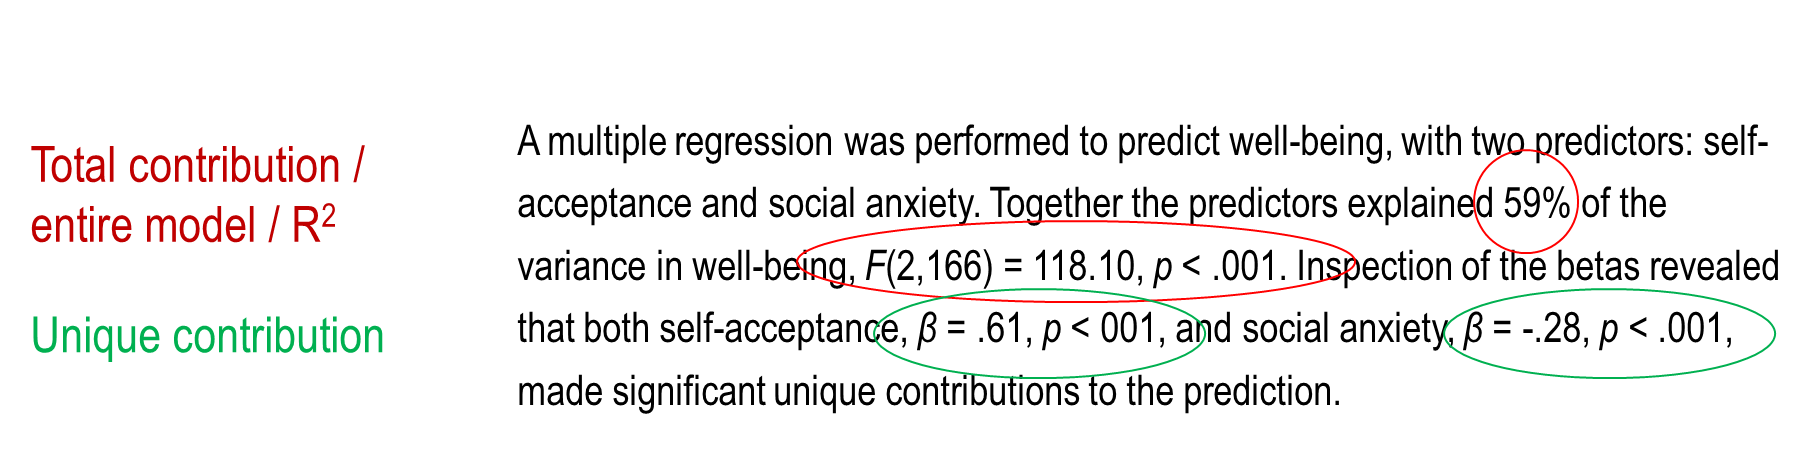
Reporting
Moving from simple to multiple regression

Workshop
ACTIVITY 1
In a study with 120 participants, a clinical psychologist administered a self-compassion scale (scores on this scale could range from 0 to 10) and a measure of depression (scores on this scale could range from 0 to 20).
The data were entered into a SPSS data file: Workshop5_SelfCompassion_data.sav.
Q1a) If you wanted to run a linear regression analysis to test whether self-compassion explains variance in depression scores, which variable should be the independent variable (IV) and which variable should be the dependent variable (DV)?
The DV is the output, which is the predicted variable values, so this is depression scores
The IV is the input, which is the predictor variable values - self-compassion
Q1b) If you wanted to draw a scatterplot of self-compassion scores by depression scores, which variable should be put on the y axis (vertical line), which on the x axis (horizontal line), and why?
Depression scores is the y axis and self-compassion is the x axis
Q1c) Draw a scatterplot of self-compassion scores by depression scores in SPSS and then add the line of best fit (regression line) on the scatterplot.
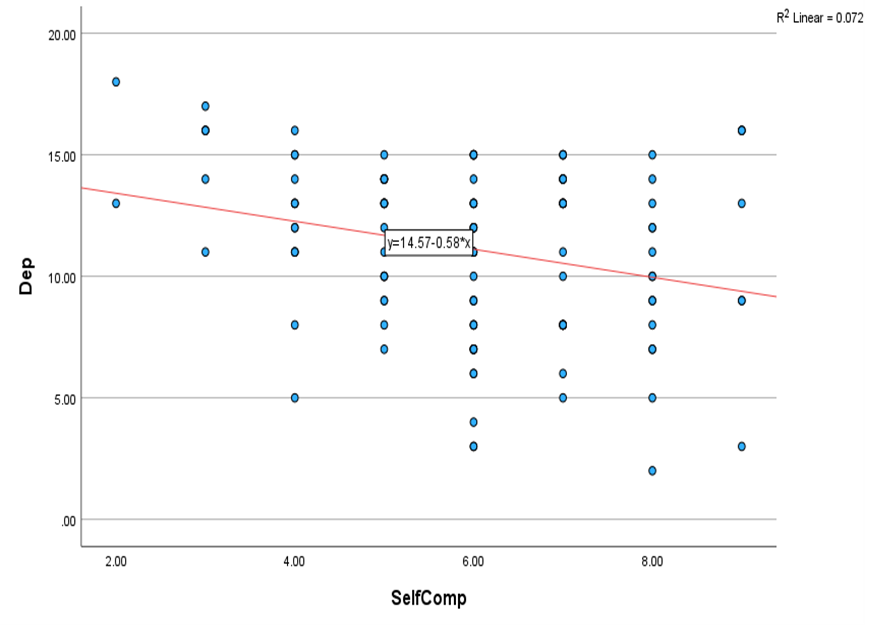
Q1d) At what point does the regression line intercept the y axis?
14
Q1e) What is the slope of regression line?
Y=14.57-0.58*x
Q1f) What does the slope of regression line indicate (in this example)?
There is a weak negative relationship between depression and self-compassion
Q1g) Conduct a Pearson correlation analysis to examine the strength of the relationship between self-compassion and depression. Report the result of the correlation analysis. Include a statement on the nature of the relationship.
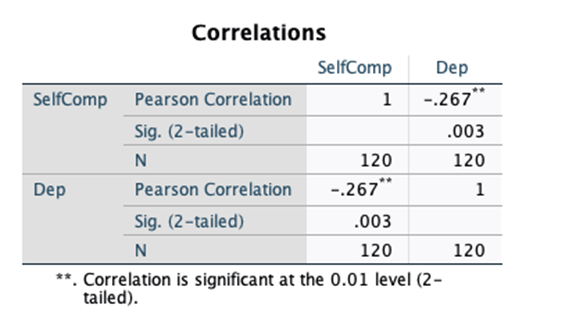
It is significant
Q1h) Conduct a regression analysis to examine the extent to which self-compassion can be used to explain variance in the depression scores.
Step 1:
Step 2:
Q1i) From the output, what is the regression equation?
Y’ = a + bx
b= r x sy/sx, 0.267 x 3.45969/1.60616 = 0.575122
y’ = 14.569 – 0.576 x
Q1j) On a scale from 0.00 to 1.00, what proportion of the variance in depression is explained by self-compassion?
R^2 = 0.072
Q1k) What is this proportion of variance explained in percentage terms?
7.2%
Q1l) Is this amount of variance explained significant? What is the correct way to report this analysis?
Q1m) Based on the significance of the results, what can the researcher conclude about the slope of the regression and about the proportion of explained variance in the population?
ACTIVITY 2
The clinical psychologist also administered measures of positive affect (scores on this scale could range from 0 (low levels of positive affect) to 10 (high levels of positive affect)) and negative affect (scores on this scale could range from 0 (low levels of negative affect) to 10 (high levels of negative affect)).
The variables are also included in the SPSS data file: Woekshop5_SelfCompassion_data.sav.
Q2a) If you wanted to run a multiple regression analysis to test whether self-compassion, positive affect and negative affect explain variance in the depression scores, which variables would be the independent variables (IVs) and which variables would be the dependent variable (DV)?
Q2b) Conduct a (Pearson) correlation analysis to examine the strength of the relationships between self-compassion, positive affect and negative affect, and depression.
Q2c) Report the result of the correlation analysis. Include a statement of the nature of the relationships.
Q2d) Conduct a regression analysis to examine the extent to which depression can be explained by self-compassion, positive affect and negative affect, both as a whole model (Model Summary + ANOVA) and individual predictors (Coefficients table).
Q2e) From the output, what is the regression equation?
Q2f) What proportion of the variance in depression is explained by self-compassion, positve affect and negative affect?
Q2g) What is this proportion of variance explained in percentage terms?
Q2h) Is this amount of variance explained significant? What is the correct way to report this analysis?
Q2i) Which of the independent variables made a significant unique contribution to the prediction of depression?
Q2j) What do we mean when we refer to the unique contribution of an independent variable (IV)?
Q2k) Report the results of the multiple regression analysis that you have just conducted.
Q2l) Compare the significance levels of self-compassion in the simple regression analysis (Q1h) and in the multiple regression analysis (Q2d). What changed? Why?