Chapter 1
jamovi download the solid version
clear some storage for it
turn in homework to lab not lecture
Why learn Statistics
Helps understand articles
Helps with personal research
Improves reasoning and Intuition
Makes you a better consumer of science
What are Statistics
Statistics is a branch of applied mathematics focusing on the organization, analysis, and interpretation of group of numbers or large amounts of data.
There are two main branches
Descriptive
Summarizes a group of numbers form a research study
Provide averages, graphs, tables, etc
The numerical, graphic, and tabular descriptions or output of collected data

Inferential
Methods and procedures for drawing conclusions, make inferences based on scores collected in a research study and going beyond them
Generalizations from sample to population
Samples (statistics) vs. Populations (Parameters: Unknown)
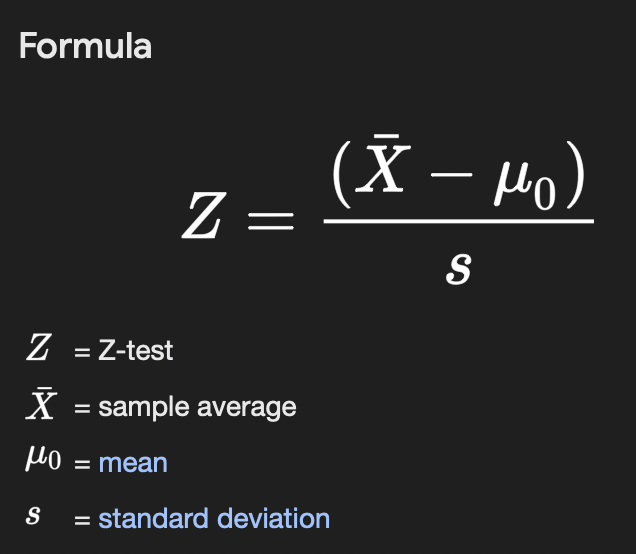
Statistics are the TESTS that can be used to analyze collected data
t-est
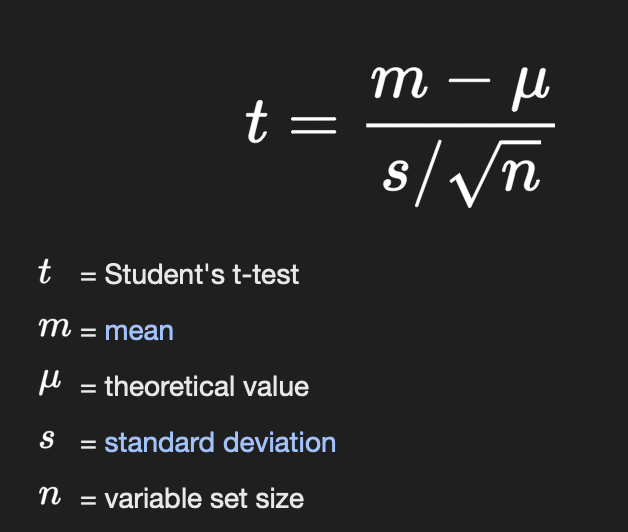
Z-test
Populations and Samples
Population
Total set of subjects of interest (all TAMIU students)
Sample
Representative subset of the bs
Theory and Research
Theory
Organized system of assumptions/principles that attempts to explain certain phenomena and how they are related
Guides research
Karl Popper: Look!Look!
telling someone to look without telling them where
Frames of Reference: Ways of looking at research questions/ problems/ motivation
Hypothesis: Prediction

Variables
Variable
Characteristic/ condition that can have different values
Gender, Ethnicity, Religiosity
Value
Possible number or category a score can have
Rating scale: 1-10; Gender: F vs. M; F=1 vs. M=0
Score
A particular person’s value
e.g., values on a test 70, 80, 90
Discrete (Nominal, Qualitative variable):
Fixed values (Categorical, subcategories)
Religion: (Catholic, Protestant)
Political party: (Republican, Democrat, Independent)
Gender: Male, Female
Numbers no Numerical value: Male = 1, Female = 2
Continuous (Numeric, quantitative variable)
Infinite or unlimited values
Age: in years, 2.3 years old, 3.5 days old child
Discrete and Continuous Variables
Discrete and Quantitative!!
Variables that only take on values from a set of separate numbers
Number of crimes committed
can you have 1.5 or 1.8 crimes)
Number of elections previously voted in
Voted 1.5 times?
Number of children
Household = 1.5 children/ family
Assumptions Underlying Statistical Procedures
Randomization
Random selection
Random assignment
Sample size
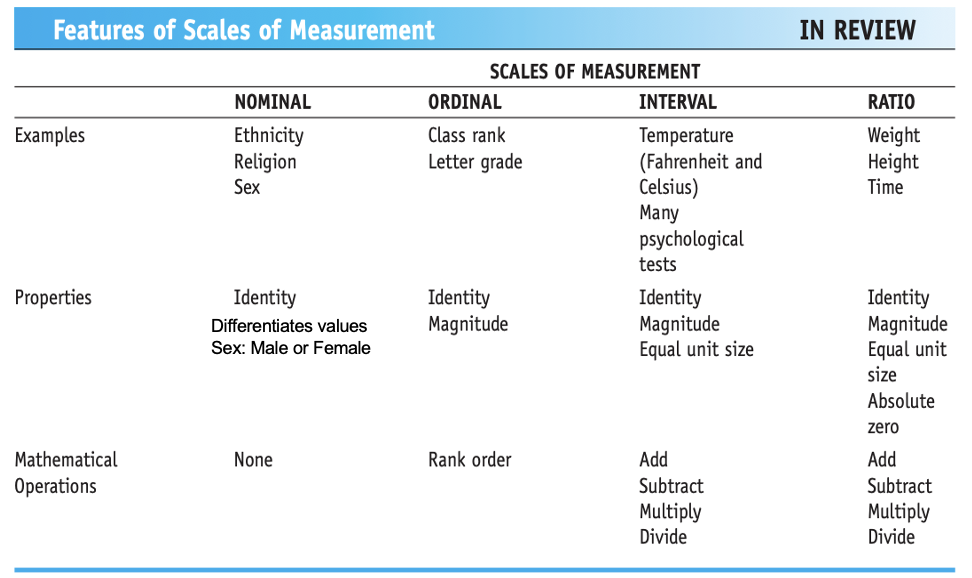
Scales or Levels of Measurement
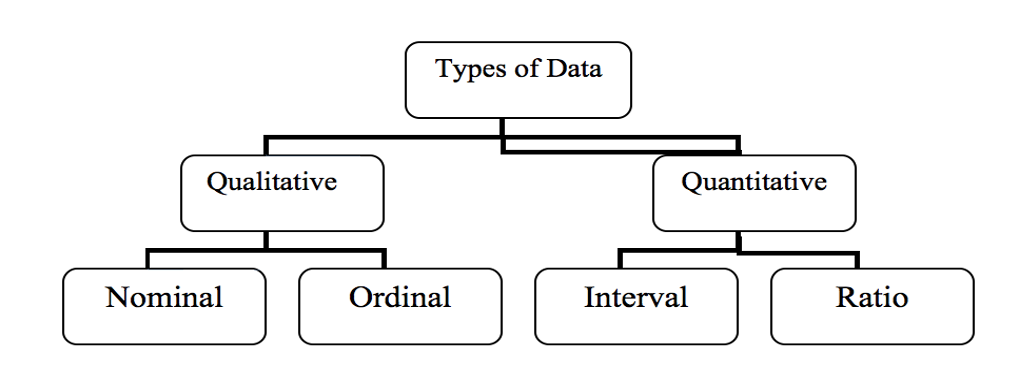
Nominal: variable in which values are categories
Ex) Gender, religion, ethnicity
Ordinal (rank-order): numeric values correspond to the relative position of things measured
Ex) class rank or birth order
Scales or Levels of Measurement
Interval
Numeric, quantitative and continuous
Ages: 5, 10, 15, 20, 25, 30, 35, 40, 45, 50, 55, 60, 65
Continuum of ages: Equal distance intervals
Equal unit size or interval: Units of measurements (intervals) on scale are all equal in size
Distance between 5 and 10 identical to 60 and 65
Temperatures: Difference between 30 degrees and 40 degrees same as differences between 80 degrees and 90 degrees
Underlying numerical information provided by measure
Equal-interval: Numeric Variable (No absolute ZERO)
Carries identity: Days with different temps receive different scores on scale
Magnitude: (cooler days receive lower scores)
Equal unite size: differences between values correspond to differences in the underlying thing being measured (Diff. b/n 20 degrees & 40 degrees is equivalent to the difference of 50 degrees & 70 degrees)
Ex) pain level, stress level, ratings of mood, age
Ratio
Identical to interval with one exception
it has an absolute zero
ZERO stands for the absence of something.
Temperature in K (0K = - 459.67 F!)
F or C Temperatures can go below ZERO
Time, weight
Income: Persons can have no money? Is it a ratio?
Technically both
Key Points
Descriptive statistics are used to describe and summarize a group of numbers from a research study
A value: is a number or category; a variable is a characteristic that can have different values; a score is a particular person’s value on the variable.
Some numeric variables are rank-ordered and some variable are names or categories and not numbers