Week 5 & 6: Cardiovascular System (inc. practical)
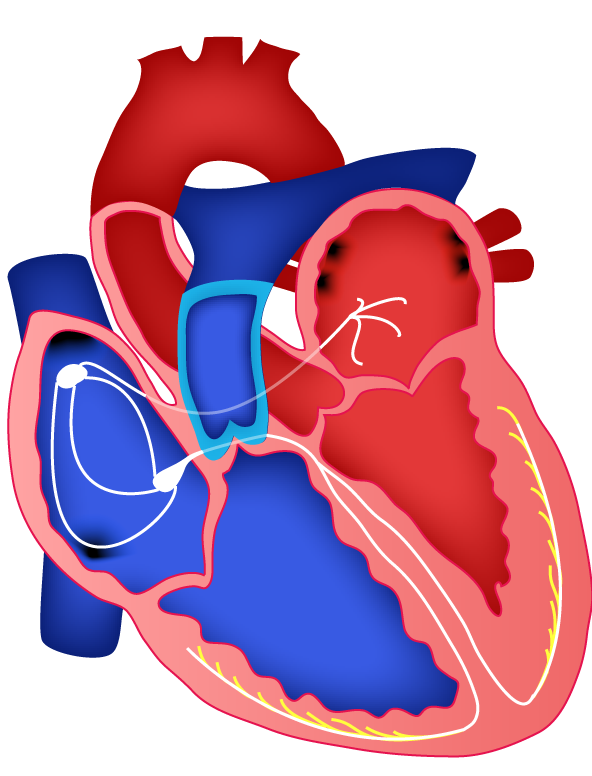
Electrical conduction pathway
Sinoatrial (SA) node
- Located in the right atria.
- Generates cardiac action potentials spontaneously- allows the heart to beat spontaneously and independently of nerves. cardiac action potentials is at a greater frequency than other cardiac muscle cells.
- Activation leads to excitation along internodal tracts towards the left atrium and the AV node. This results in atrial contraction.
Atrioventricular (AV) node and bundle of His
- Located medial to the right atrioventricular valve.
- Action potentials are propagated slowly through these areas compared to the rest of the heart's conduction system.
- Ventricular depolarisation precedes ventricular contraction.
- The propagation delay allows atrial contraction to be completed, and the ventricles to fill with blood before ventricular contraction begins.

Left and right bundle branches
- Electrical conduction pathway divides at the interventricular septum to form the left and right bundle branches, which descend to the apex of each ventricle.
- At the ventricle apex, the bundle branches ÷ repeatedly for distribution throughout the ventricular walls.
- Ventricular depolarisation precedes ventricular contraction.

Purkinje fibers
- Terminal branches of the bundle branches become Purkinje fibres→ cardiac muscle fibres that have special structural modifications. Which allow APs to travel more rapidly than they would in cardiac muscle tissue.
- Found towards the endocardial surface. Thus, electrical activity at any level travels outwards towards the epicardial surface.
Three clear waves occur
- P wave = atrial depolarisation
- QRS complex = ventricular depolarisation
- T wave = ventricular repolarisation Three intervals/segments determine function
P-Q interval = conduction time from atrial to ventricular excitation
S-T segment = time ventricular contractile fibers are depolarised
Q-T interval = time of ventricular depolarisation to repolarisation
Cardiac cycle
Atrial Systole – Contraction (~0.1 seconds) During atrial systole, the ventricles are in diastole
- Depolarisation of the SA node causes atrial depolarization (P wave in Fig A)
- Causes systole that exerts pressure, forcing the blood through the AV valves (blue & green line in Fig B)
- Contributes a final ~25 mL of blood into each ventricle. (Fig D) • At the end of atrial systole, the volume of blood in the ventricle is known as the end-diastolic volume (EDV).
- The QRS complex (Fig A) = the onset of ventricular depolarisation
Ventricular Systole – Relaxation (~0.3 seconds) During ventricular systole, the atria are in diastole 5. Ventricular depolarization (QRS complex, Fig A) causes systole. • Increases pressure in the ventricle (blue line Fig B). • Pressure causes AV and semilunar valves to close = isovolumetric contraction 6. Pressure rises sharply (Fig B). Left ventricular pressure above aortic pressure & right ventricular pressure above pulmonary trunk= both valves open = ventricular ejection 7. Ejects blood into the aorta and pulmonary artery (Fig D) • Volume at the end of systole = end-systolic volume (ESV). 8. The T wave (Fig A) = ventricular repolarisation
Isovolumetric Relaxation (~0.4 seconds)
Atria and ventricles are relaxed 9. Ventricular repolarisation (T wave, Fig A) causes ventricular diastole.
• Pressure falls, closing all semilunar valves to prevent backflow.
• All four valves close, and no blood is leaving = isovolumetric relaxation (Fig D) 10. Ventricular pressure drops below atrial pressure (Fig B) = AV valves open = ventricular filling (Fig D).
Cardiac output= SV x HR
Blood Pressure
- Baroreceptor monitor blood
- The baroreceptor reflex helps to maintain blood pressure
- Rapid negative feedback loop
- ↑vascular resistance if BP drops
- Mediated by receptors in the carotid sinus