ACC406 Chapters 4 & 5
CHAPTER 4: Cost-Volume-Profit Analysis
Overview of Cost-Volume-Profit (CVP) Analysis
CVP Analysis is a crucial managerial planning tool that provides integral insights to aid in decision-making processes impacting profitability. This analysis evaluates the relationships between various levels of sales and production, cost structures, and overall profit. It assists managers by:
Calculating Units for Break-Even: This helps in setting realistic sales targets and understanding the sales volume required to cover total costs, essential for budget planning and operational efficiency.
Assessing Fixed Costs Impact: By examining the effects of reductions in fixed costs on the break-even point, management gains insights into cost management strategies and their implications on profitability.
Profit Evaluation on Price Changes: Understanding how profit levels respond to alterations in selling prices aids in developing effective pricing strategies and evaluating their financial impact. This understanding can guide pricing adjustments based on market conditions and consumer demand.
Break-Even Point (BEP)
Definition:
The break-even point signifies a crucial interval where total revenue meets total costs, resulting in zero profit. This point is instrumental for evaluating the financial sustainability and operational viability of a business.
Calculation:
Basic Equation: Total Revenue = Total Cost
Alternatively, this can be expressed as: Total Revenue - Total Cost = 0 Profit
Operating Income in CVP Analysis
The concept of break-even can also pertain to scenarios where the operating income is zero. This emphasizes the necessity of covering both fixed and variable costs to maintain financial stability.
Income Statement Structure:
The contribution margin income statement presents a clear overview:
Sales
Variable Costs = Contribution Margin
Contribution Margin - Fixed Costs = Operating Income
Contribution Margin Income Statement Preparation
Case Study: Whittier Co.
Assumptions:
Planned Sale: 1,000 mowers at a price of $400 each.
Costs Breakdown:
Direct Materials per mower: $180
Direct Labour per mower: $100
Variable Overhead per mower: $25
Fixed Factory Overhead: $15,000
Variable Selling Expense: $20 per mower
Fixed Selling/Admin Expense: $30,000
Required Calculations
Total Variable Cost per Unit:
Formula: Variable Cost per Unit = Direct Materials + Direct Labour + Variable Overhead + Variable Selling Expense
Calculation: $180 + $100 + $25 + $20 = $325
Total Fixed Expenses:
Formula: Total Fixed Expenses = Fixed Factory Overhead + Fixed Selling/Admin Expense
Calculation: $15,000 + $30,000 = $45,000
Contribution Margin Income Statement for Whittier Co.
Total Sales:
1,000 mowers x $400 each = $400,000
Total Variable Expense:
1,000 mowers x $325 each = $325,000
Total Contribution Margin:
Total Sales - Total Variable Expense = $75,000
Total Fixed Expense: $45,000
Operating Income:
Total Contribution Margin - Total Fixed Expense = $30,000
Break-Even Point in Units
Formula:
Break-Even Number of Units = Total Fixed Costs / (Selling Price - Variable Cost)
For Whittier Co.:
Break-Even Number of Mowers = $45,000 / ($400 - $325) = 600 Mowers
Break-Even Point in Dollars
CVP analysis also determines the total dollar sales revenue necessary to achieve break-even.
Variable Cost Ratio:
Variable Cost Ratio = Variable Cost per Unit / Selling Price = 81.25%
Contribution Margin Ratio:
Contribution Margin Ratio = (Selling Price - Variable Cost) / Selling Price = 18.75%
Margin of Safety
Definition:
The margin of safety indicates the extent to which sales can decline before reaching break-even, providing a buffer against uncertainties in sales performance.
Calculation:
Margin of Safety in Units = Sales - Break-Even Units
Example Calculation:
1,000 mowers sold - 600 mowers break-even = 400 mowers
Operating Leverage
Definition:
Operating leverage measures the proportion of fixed costs relative to total costs, reflecting the degree of risk associated with the company's cost structure. High operating leverage indicates greater risk as profits are more sensitive to sales fluctuations.
Formula:
Operating Leverage = Contribution Margin / Operating Income
Example Calculation:
For Whittier Co., with an operating income of $30,000, calculating the degree of operating leverage assists in evaluating profit susceptibility to variations in sales volume.
Assumptions of CVP Analysis
Linear Revenue and Cost Functions: Assumes selling prices, total fixed costs, and variable costs remain constant within a relevant activity range, simplifying forecast and decision-making processes.
Inventory Management: Assumes all produced units are sold, without variations in inventory levels, which may not always align with real-world operations.
Constant Sales Mix: Assumes a uniform product mix in environments with multiple products, making analysis more straightforward and applicable.
Key Takeaways
CVP analysis is an essential management tool facilitating comprehensive strategic planning involving pricing, sales volumes, and costs. Effectively understanding and calculating break-even points, contribution margins, and margins of safety is critical for making informed decisions about sales tactics, operational adjustments, and financial forecasts, thus enhancing overall business performance and sustainability.
CHAPTER 5: Job-Order Costing
Importance of Unit Costs to Firms
For manufacturing firms, unit costs are essential for:
valuing inventory
determining income
making important decisions
For service firms, unit costs are used to determine:
profitability
feasibility of introducing new services
Job-Order Vs. Process Costing
Job-Order Costing
Firms operating in job-order industries produce a wide-variety of services or products that are quite distinct from each other
Wide variety of distinct products
Costs accumulated by job
Unit cost computed by dividing total jobs costs by units produced for that job
Process Costing
Firms producing identical products or services can use a process-costing accounting system
Homogeneous Products
Costs accumulated by process or department
Unit cost computed by dividing process costs for the period by the units produced in the period
Normal Costing and Estimating Overhead
In normal costing, overhead must be estimated and applied to output.
Three-step process:
Calculate the predetermined overhead rate
Apply overhead to production
Reconcile applied overhead with actual overhead or allocate applied overhead to WIP and finished goods ending inventories
Calculate the Predetermined Overhead Rate
Formula:
Best estimate of manufacturing-related costs, such as factory-related costs, indirect materials, and indirect labour
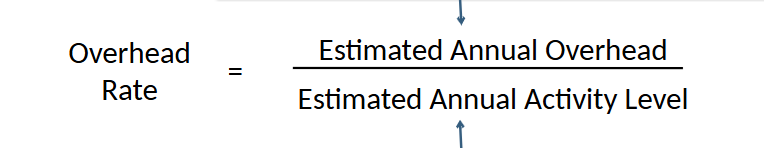
Both overhead and activity level are estimated because overhead rate must be calculated at beginning of year
Reconciling Applied Overhead to Actual Overhead
is crucial for ensuring that the estimated costs align with the actual expenses incurred during production. This process involves comparing the overhead that was applied throughout the year based on the predetermined rate to the actual overhead costs recorded, allowing for adjustments and accurate financial reporting.
Normal Costing and Estimating Overhead
Normal costing uses a predetermined overhead rate to allocate overhead costs to products or services, which simplifies the accounting process and helps in budgeting. This method allows businesses to estimate costs more accurately by applying a consistent rate, rather than fluctuating with actual costs, facilitating better decision-making and financial analysis.
In normal costing, overhead must be estimated and applied to output.
Three-step process:
1. Calculate the predetermined overhead rate.
2. Apply overhead to production.
3. Reconcile applied overhead with actual overhead or allocate applied overhead to WIP and finished goods ending inventories.
This is called an overhead variance,
which can be either favorable or unfavorable depending on whether the applied overhead is greater or less than the actual overhead.
A favorable variance indicates that the company spent less on overhead than anticipated, which can positively impact profit margins, while an unfavorable variance suggests overspending, requiring management to investigate the causes and implement corrective actions.
Understanding these variances is essential for effective budgeting and financial planning, as it provides insights into operational efficiency and cost control measures.
Additionally, analyzing these variances helps in identifying trends over time, allowing companies to adjust their forecasts and improve their cost management strategies.
Plantwide and Departmental Overhead
Plantwide Overhead Rate: this rate is calculated by dividing the total estimated overhead costs by the total estimated activity base, such as direct labor hours or machine hours, for the entire plant.
Departmental Overhead Rate: this rate is determined by dividing the estimated overhead costs for each department by the estimated activity base specific to that department, which allows for a more accurate allocation of overhead costs based on the actual consumption of resources.
Unit Costs in the Job-Order System
Unit cost is a sum of Direct Material + Direct Labour + Overhead
Source Documents Used in Job-Order Costing
Job-Order Cost Sheet
Material Requisition Form
Job Time Tickets
Source Documents as Sources for Account Balances
Work In Process: Total of all job-order cost sheets for unfinished jobs
(WIP) accounts are essential for tracking the costs associated with unfinished goods, allowing for accurate financial reporting and inventory management.
Finished Goods: Total of all job-order cost sheets for finished but unsold jobs
Total of all job-order cost sheets for completed jobs (FG) represents the costs that have been incurred for products that are ready for sale, providing insights into inventory levels and cost of goods available for sale.
Cost of Goods Sold: Total of all job-order cost sheets for sold jobs
Total of all costs associated with jobs that have been sold, reflecting the expenses incurred in producing those goods and impacting the company's profitability.
This metric is crucial for understanding the financial performance of the business and for making informed pricing and production decisions.
Accounting for Actual Overhead Costs
Never enters Work-in-Process account
Costs are recorded as debits in Manufacturing Overhead control account
At end of period, actual overhead is reconciled
with applied overhead
Accounting for Finished Goods
Costs of completed jobs are transferred from
Work-in-Process to Finished Goods.
Accounting for Actual Overhead Costs
Once a job is sold, it is added to cost of goods sold and reported on the income statement.
Accounting for Cost of Goods Sold
This process involves tracking the costs associated with producing goods that have been completed and are ready for sale, which is crucial for accurately determining profit margins and overall financial performance.
When jobs are sold:
finished goods inventory is decreased
cost of goods sold is increased
The selling price is recognized by:
increasing (crediting) sales revenue,
decreasing (debiting) accounts receivable (or cash)
Accounting for Nonmanufacturing Costs
Manufacturing costs are not the only costs incurred by a firm.
Selling and general administration are period costs.
Period costs are shown on the income statement.
These costs are deducted from revenue in the period they are incurred, reflecting their impact on net income.
Job-Order Costing for Service Firms
A job-order costing system may be used for service firms as well.
Architects, accountants, lawyers, tutors, physicians, and advertising agencies provide services to individual clients, students, or patients.
In such cases, the client, student, or patient can be viewed as a job for which costs are accumulated and reported.
Any materials or supplies used in rendering services are normally insignificant.
For that reason, materials and supply costs are included in the overhead cost.
Direct labour and overhead costs of rendering services to a client are accumulated in a Work-in-Process account.
This account reflects the total costs incurred for services that are in progress but not yet completed, allowing for accurate financial reporting and analysis of service delivery efficiency.