Describing Variation & Distribution of Data
Variable
A measure of a single characteristic that can vary
Causes of Variations:
Biologic Differences
Genes
Nutrition
Environmental
Exposures
Age
Sex
Race
Presence or absence of disease and extent of disease
Ex. Cancer of the cervix may be in situ, localized, invasive, or metastatic
Different conditions of measurement
Often account for the variations observed in medical data
Factors: time of the day, ambient temperature or noise, and the presence of fatigue or anxiety in the patient
Different techniques of measurement
Can produce different results
Measurement error
Can also cause variation
Types of Errors:
Systematic Error
Can distort data systematically in one direction.
Can introduce bias
Random Error
Does not introduce bias
Quantitative Data
Numbers and measurement
Qualitative Data
Generally use words
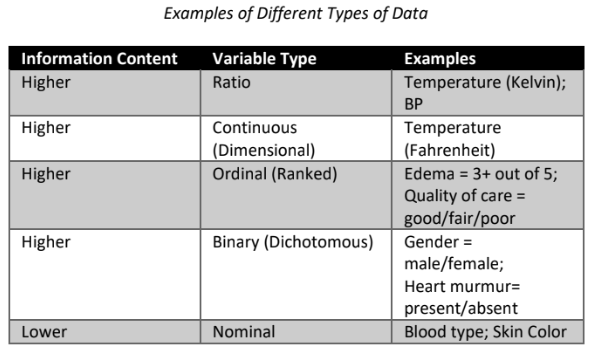
Types of Variables:
Nominal Variables
Naming or categoric variables that are not based on measurement scales or rank order.
Ex. Blood groups, occupations, skin color
Dichotomous (Binary) Variables
Variables with only two levels
Ex. Study of heart murmurs (systolic or diastolic)
Ordinal (Ranked) Variables
Data that can be characterized in terms of three or more qualitative values
Ex. Satisfaction of care
Continous (Dimensional) Variables
Continous scales
Observation differs over time
Ex. Height, Weight, Blood pressure
Ratio Variables
If a continous scale has true 0 point
Ex. Kelvin Temperature
Frequency Distributions
Frequency Distributions of Continuous Variable
Can be shown by creating a table that lists the values of the variable according to the frequency with which the value occurs.
Range of a variable
Range is the distance between the lowest and highest observations of the variable.
Real and Theoretical Frequency Distributions
Real Frequency Distributions
Obtained from actual data or sample
Theoretical Frequency Distributions
Calculated using assumptions about the population from which the sample was obtained
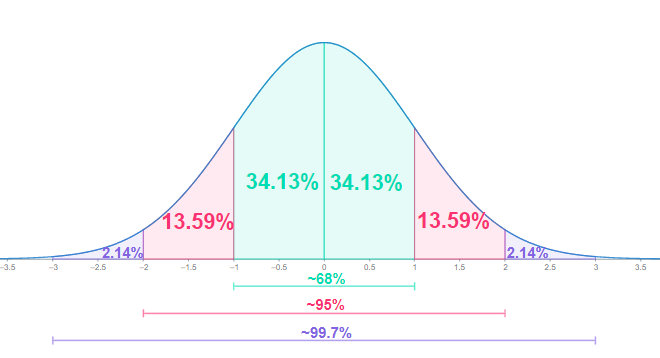
Normal Distribution
Also called the Gaussian distribution after Johan Karl Gauss
Bell-shaped curve
Parameters of a Frequency Distribution
Measures of Central Tendency
Mean (x̄) – Average value
Median – Middlemost or halfway value
Mode – Most frequent value
Measures of Dispersion
Based on Percentiles
Percentile of Distribution
A point which at which a certain percentage of the observations lie below the indicated point when all the observations are ranked in descending order.
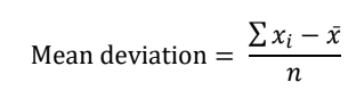
Based on Mean
Mean Absolute Deviation
Seldom used, but helps define the concept of dispersion
Does not have mathematical properties (as based form many statistical tests)
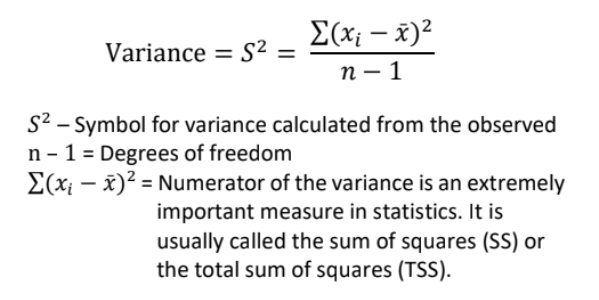
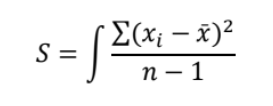
Variance
Fundamental measure of dispersion
Standard Deviation
Square root of the variance
Used to describe the amount of spread in the frequency distribution
Average of deviations from the mean
Problems in Analyzing a Frequency
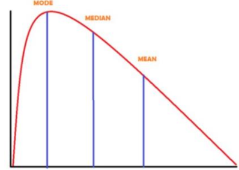
Skewness
A horizontal stretching of a frequency distribution to one side or the other, so that one tail of observations is longer and has more observations than the other tail
Skewed to the left
When histogram or a frequency polygon has a longer tail on the left side of the diagram
Negatively skewed distribution
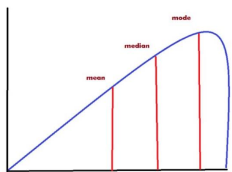
Skewed to the right
When histogram or a frequency polygon has a longer tail on the right side of the diagram
Positvely skewed distribution
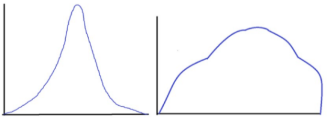
Kurtosis
Characterized by a vertical stretching or flattening of the frequency distribution
Leptokurtic: Distribution with heavy tails.
Platykurtic: Distribution with light tails.
Mesokurtic: Distribution with moderate tails, similar to a normal distribution.
Graphical Representations
Graphs provide a visual way to understand the distribution and variation in the data.
Histogram: A bar graph that shows the frequency of data points within specified ranges (bins).
Box Plot (Box-and-Whisker Plot): Displays the median, quartiles, and potential outliers. It helps visualize the spread and skewness of the data.
Dot Plot: Shows individual data points and their frequency.
Stem-and-Leaf Plot: Similar to a histogram but retains the original data values.
Density Plot: A smoothed version of the histogram, often used to estimate the probability density function of the data.
Descriptive Statistics Summary
Combining various descriptive statistics provides a comprehensive overview of the data.
Five-Number Summary: Consists of the minimum, Q1, median, Q3, and maximum.
Summary Table: Includes mean, median, mode, range, variance, standard deviation, and other relevant statistics.
Outliers
Outliers are data points that significantly differ from the rest of the dataset.
Detection: Using methods such as the IQR (1.5*IQR rule) or Z-scores.
Impact: Outliers can skew the results and give a misleading picture of the data distribution.
Comparing Distributions
Comparing different datasets involves looking at their central tendency, spread, and shape.
Side-by-Side Box Plots: Useful for comparing the spread and central tendency of multiple groups.
Multiple Histograms: Placing histograms side by side or overlaying them for comparison.
Summary Statistics Comparison: Comparing means, medians, ranges, and standard deviations.